Casual reading of this chart by @MilanV spins 2 popular narratives of day - 1 capture by few cos(regulatory capture,invincible moats etc) that they become larger.2 In polarised mkt,where few performing,so follows only handful co worth investing! Alternative narratives possible? https://twitter.com/MilanV/status/1263867374412926977">https://twitter.com/MilanV/st...
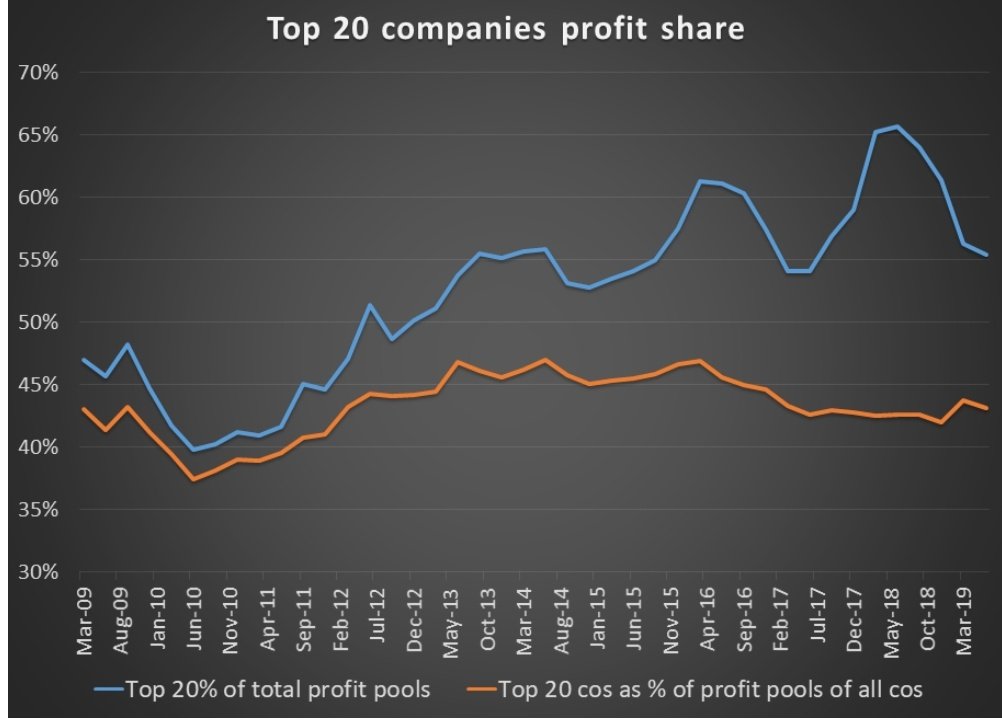
Looking under hood suggests alternate narratives!Listed universe(approx 5k cos)shows trend of top 20 profit share of all PAT of 5k cos going from 40%to 65%(2009-2019).But,plot top 20 cos profit share of profit pool of only profitable cos shows flattish trend at 43% over 10 years
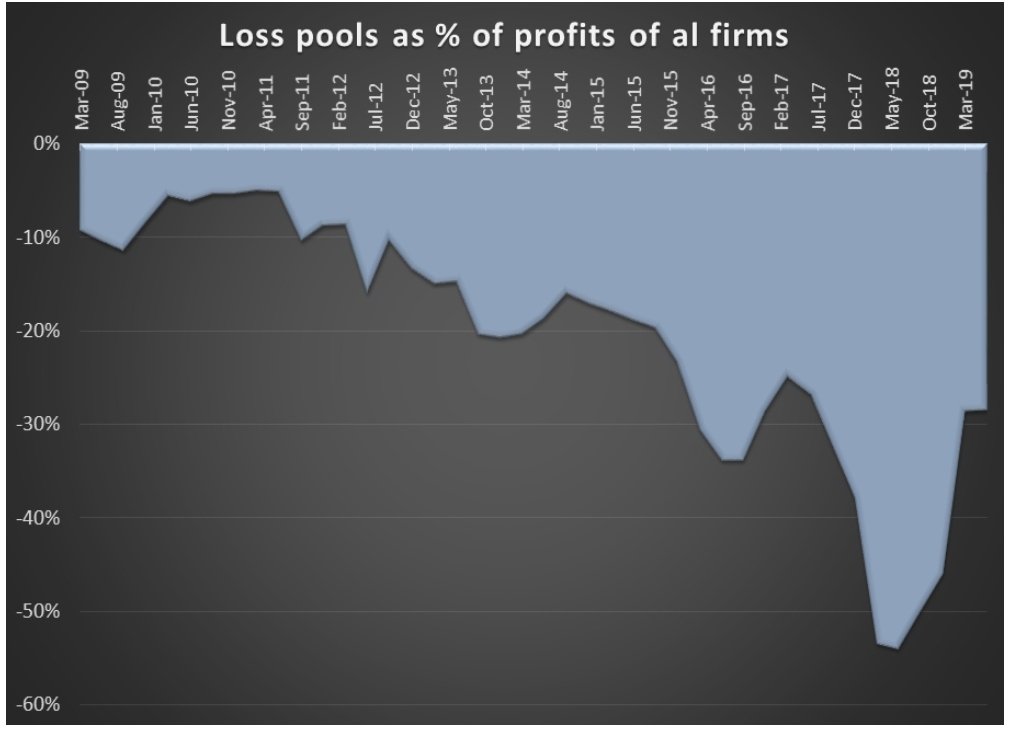
So,rather than regulatory capture etc causing dominance of chosen few,top 20 share is function of how loss pools have moved.Large losses in banks,telcos,infra,overseas acquisition gone wrong etc meant aggregate loss pool has zoomed from single digits to 55% of total profit pools!
While loss pools have come down from 55% to sub 30% in fy19 of total profits, covid induced lockdown will further aggravate this, as vulnerable cos will see losses widen!
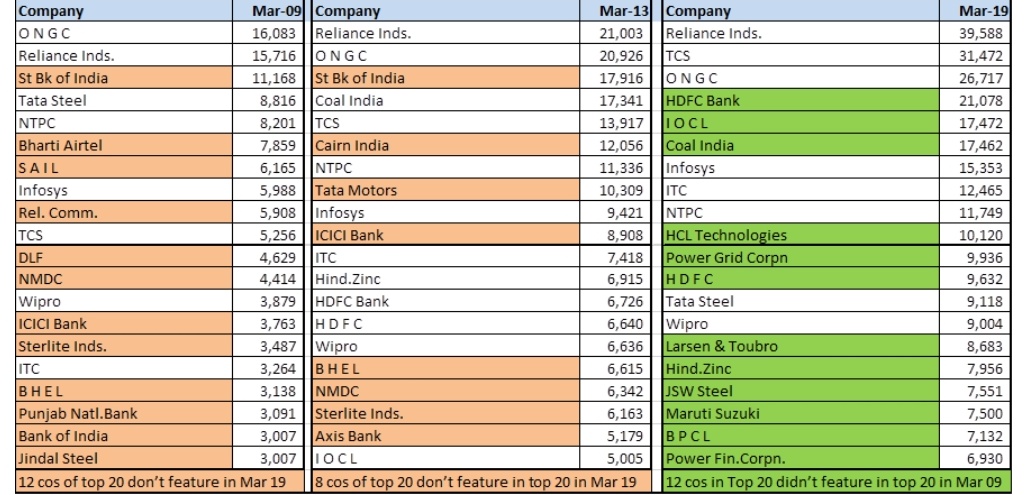
Now coming to churn within top 20 profitable companies, the & #39;chosen few& #39; have been in minority camp. As much as 12 of top 20 profitable companies don& #39;t feature in top 20 list as of Mar 19.
Finally, as we reflect on concentration of profit pools over last 10 years,loss pools have mushroomed massively over last decade,& is larger driver of profit concentration.Also,what seems invincible now may not be same, a decade from now as churn in top 20 companies show.
This analysis is of listed universe of 5k cos.Some data on unlisted India Inc here,clearly listed India Inc has been lagging due to losses in many sectors.Covid will sadly take significant toll on India Inc profit pools,hope they bounce sooner than later https://abs.twimg.com/emoji/v2/... draggable="false" alt="🤞" title="Crossed fingers" aria-label="Emoji: Crossed fingers"> https://twitter.com/hktg13/status/1226176756391923712?s=19">https://twitter.com/hktg13/st...

 Read on Twitter


