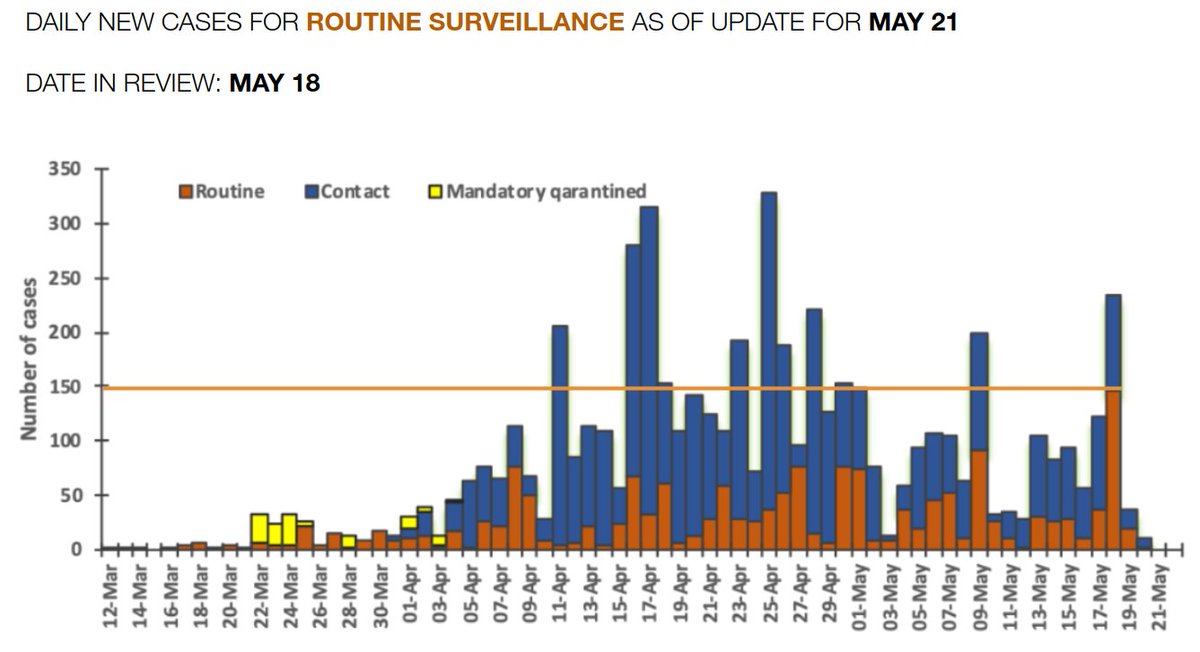
1/Recent updates on Routine Surveillance (RS) are really unsettling. @DSD_GHS really ought to clarify what& #39;s going on with reporting of daily new cases. The May 21 update makes it critically urgent, as it suggests an unexpected new record in daily no. of new RS cases.
#COVID19 https://twitter.com/nkquakyi/status/1262654047955423232">https://twitter.com/nkquakyi/...
#COVID19 https://twitter.com/nkquakyi/status/1262654047955423232">https://twitter.com/nkquakyi/...
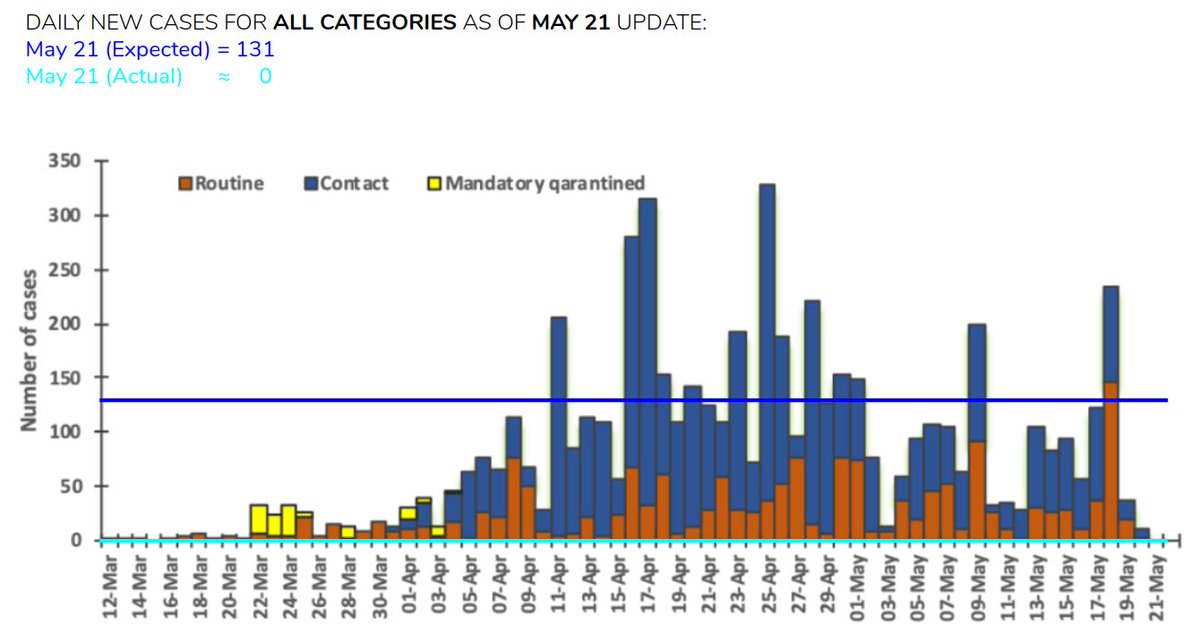
2/The assumption about the data provided in the daily updates is that it represents the results of SAMPLING and TESTING for the date in question. But the accompanying histogram of new cases (by sampling date) consistently contradicts this.
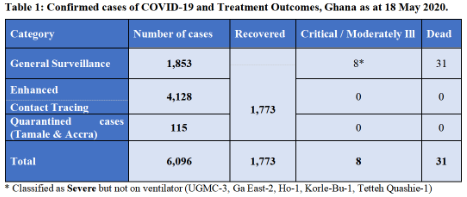
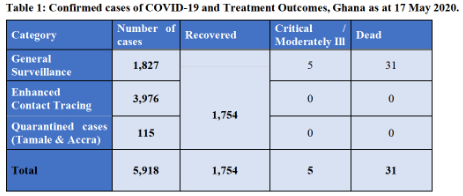
3/The "new" cases calculated after updates of Table 1 on the @DSD_GHS page don& #39;t (as per the histogram) represent testing for the date in question. The 131 "new" cases from today& #39;s & #39;May 21& #39; update, for example, barely have any relation to the report date.
https://twitter.com/DSD_GHS/status/1264061260058025986?s=20">https://twitter.com/DSD_GHS/s...
https://twitter.com/DSD_GHS/status/1264061260058025986?s=20">https://twitter.com/DSD_GHS/s...
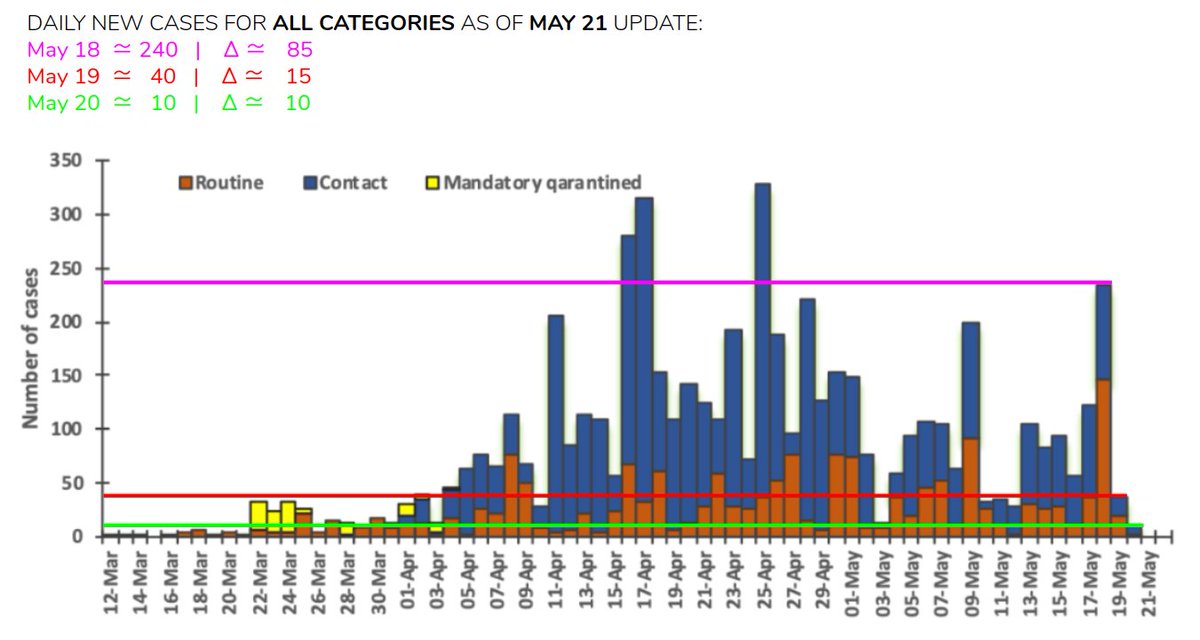
4/Almost none of the 131 additional cases attributed to May 21 register under that date as the graph above shows (see overlaid lines for expected (blue) and actual (cyan) cases). In fact, ~85 of these cases are attributed to May 18 alone after retrospective edits of the graph.
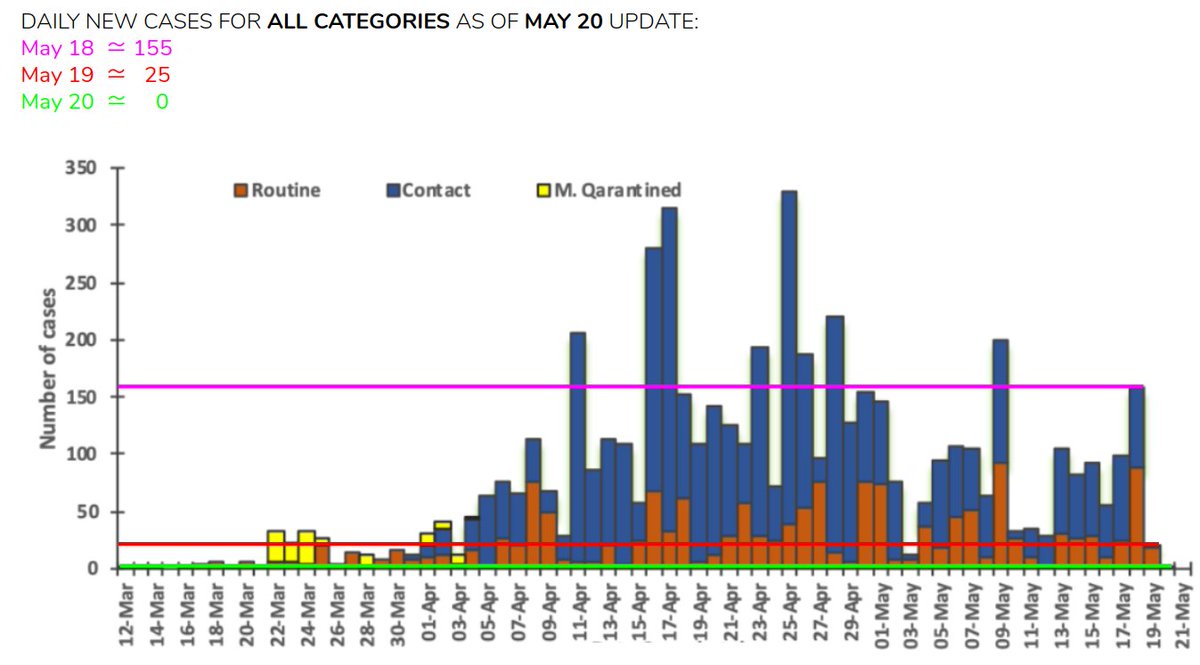
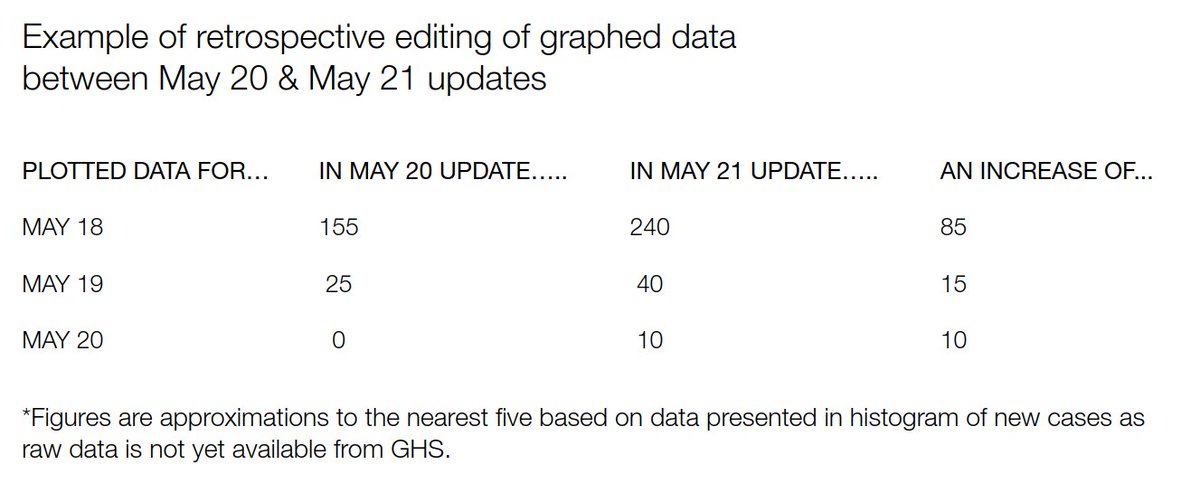
5/ @DSD_GHS still has not provided the raw data behind the histogram (promised 2 weeks ago) so we have to gauge it visually. The changes in the data for May 18, 19 & 20 between the May 20 and 21 updates are captured below.
6/The concerning thing about May 18 data and these retrospective edits - going by the graph as at May 21 - is that the highest ever recorded number of new cases in Routine Surveillance occurred that day (~150). But that was not clear for 4 DAYS after the official May 18 update.
7/The original May 18 update reported 26 new Routine Surveillance cases between May 17 and May 18 in Table 1, but that data is brought into question by these retrospective edits in the histogram that show as many as 150 new cases for May 18 instead as of May 21.
7/If the correct data source for daily new cases is the histogram, then the underlying premise of "real-time data" would be invalid as the histogram edits suggest that updates for any stated date are incomplete and may include reporting backlogs as far back as 3 days prior.
8/And if that is the case, then calculations of daily positivity rate based on increases in Tables 1 & 2 are wrong. Same goes for estimates of Ghana& #39;s effective reproduction number since they rely on daily new cases reported, which is incomplete at time of reporting.
9/Naturally, we are unable to accurately calculate a positivity rate for the day on which the highest number of random symptomatic people walked into hospitals/clinics seeking treatment. That is a worrying state of affairs, and one that @DSD_GHS must rectify and explain ASAP.
10/We cannot continue to be this sloppy in data management/reporting. We risk making some truly grave errors by calculating poor statistics with incomplete data and using that as a rationale for policy decisions. We are out of room for error. Time to get serious.

 Read on Twitter