Latest @ICNARC report on intensive care admissions and outcomes was released last night. Here’s a quick summary on behalf of @ICS_updates and @COVID19actuary.
Report includes 327 new patients (9,026 total); 587 new outcomes (7,447 total).
Full report is here https://abs.twimg.com/emoji/v2/... draggable="false" alt="👇" title="Down pointing backhand index" aria-label="Emoji: Down pointing backhand index">. /1 https://twitter.com/icnarc/status/1261366641495072768">https://twitter.com/icnarc/st...
Report includes 327 new patients (9,026 total); 587 new outcomes (7,447 total).
Full report is here
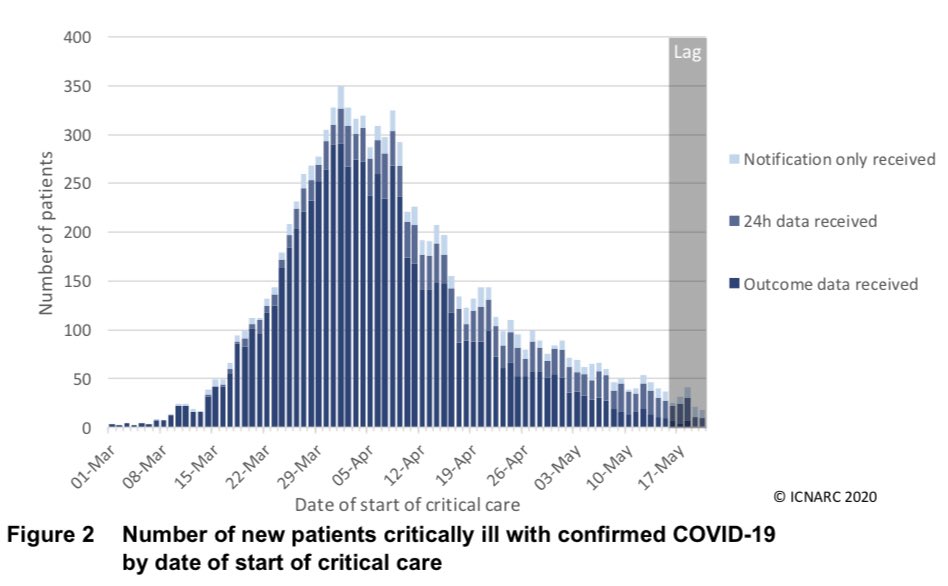
Daily admissions are low but have perhaps stopped falling.
If there’s been any increase in infections after Government messaging changed on 11 May then next week’s update is one of the first public data sources where we’ll be able to look for early signs. https://abs.twimg.com/emoji/v2/... draggable="false" alt="👀" title="Eyes" aria-label="Emoji: Eyes"> /2
If there’s been any increase in infections after Government messaging changed on 11 May then next week’s update is one of the first public data sources where we’ll be able to look for early signs.
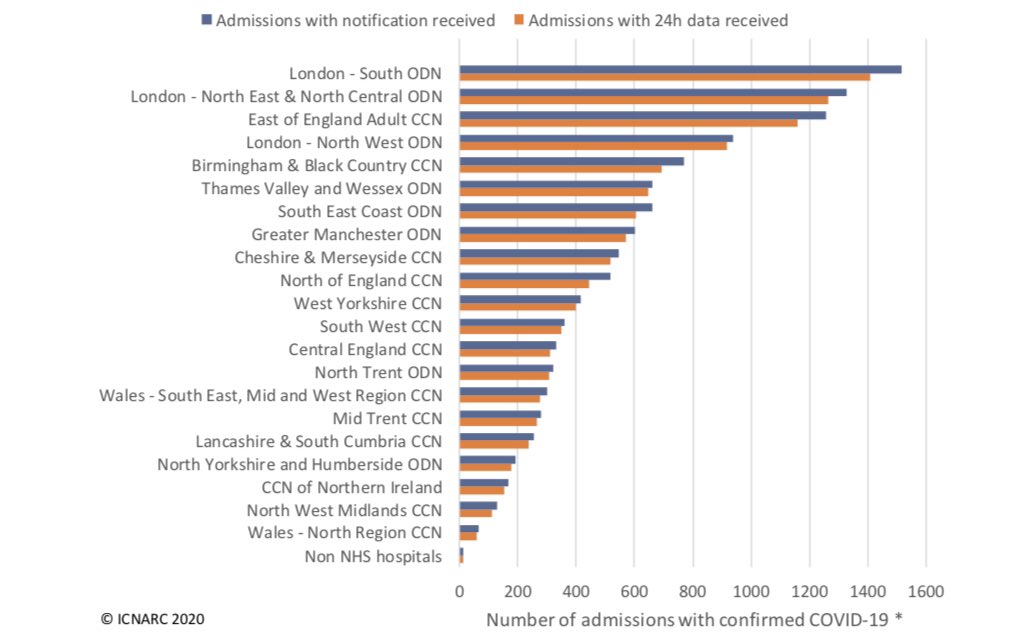
Little change to geographic distribution. Three of the networks with most admissions are London.
These are cumulative so they don’t tell you where admissions are happening today (unless you compare back to last week). /3
These are cumulative so they don’t tell you where admissions are happening today (unless you compare back to last week). /3
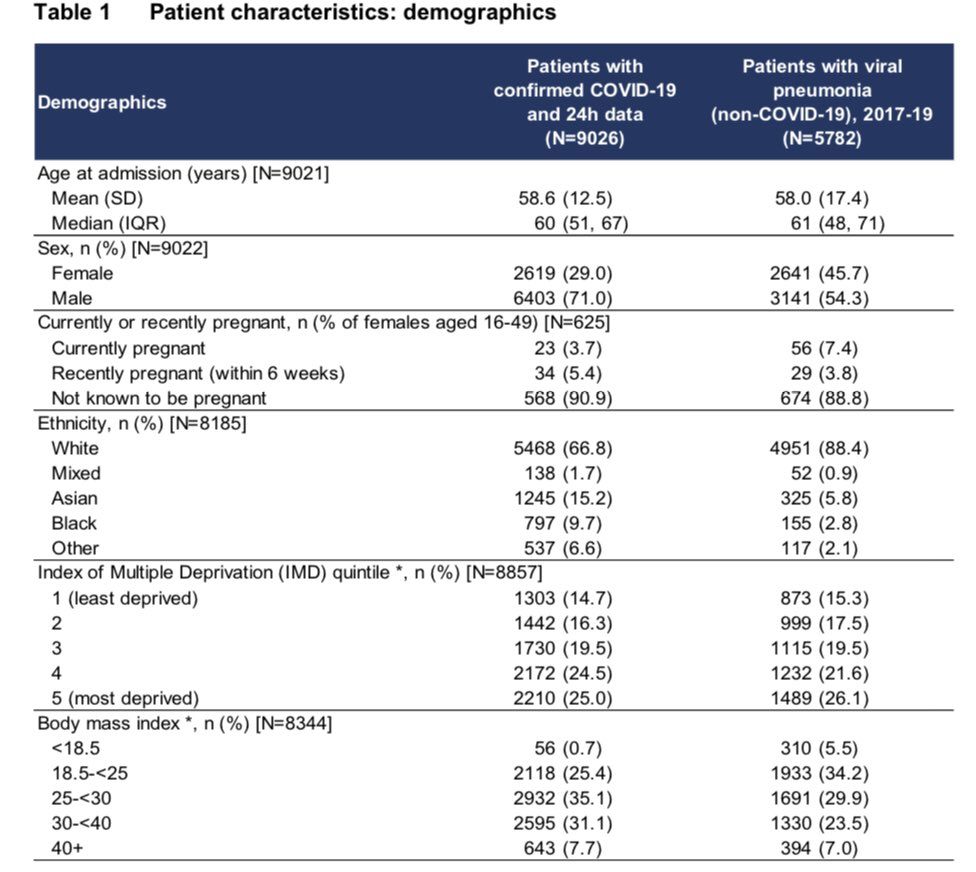
Table 1 shows demographic characteristics, compared to pneumonia caused by other viruses.
A few year’s worth of admissions in just 11 weeks!
Groups at higher risk of needing ICU care include:
- males
- non-whites
- more deprived groups (poorest 40%)
- overweight/obese. /4
A few year’s worth of admissions in just 11 weeks!
Groups at higher risk of needing ICU care include:
- males
- non-whites
- more deprived groups (poorest 40%)
- overweight/obese. /4
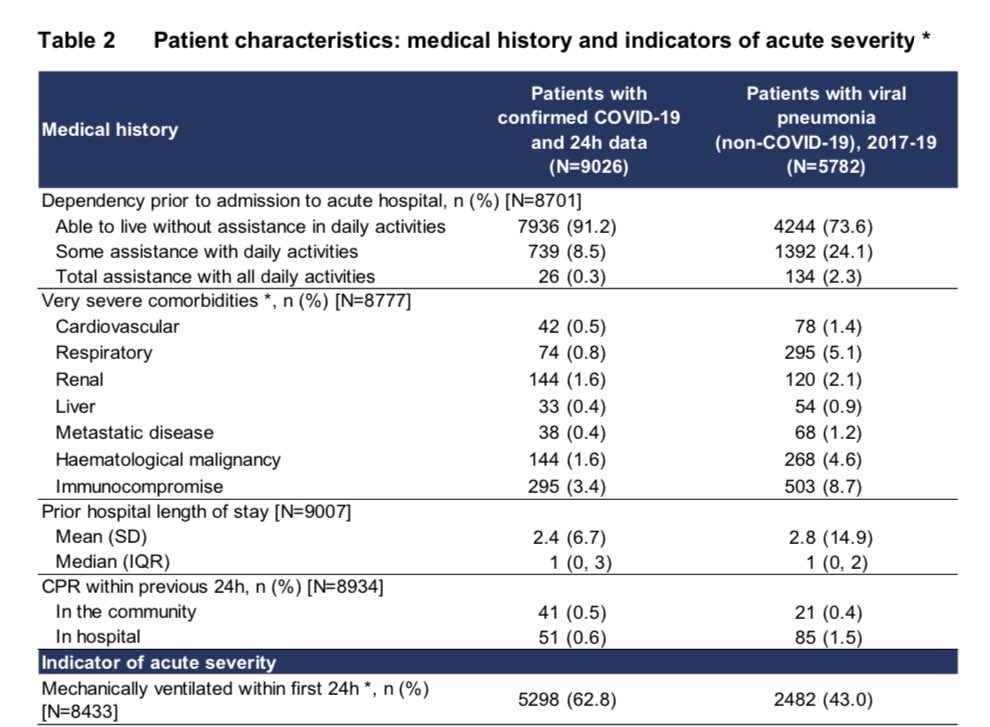
Table 2 shows medical history. Compared to viral pneumonia patients, ICU admissions for COVID-19 are three times LESS likely to need assistance with daily living (91% don’t) or have very severe comorbidities (8% do).
It is not just people “at death’s door” who fall victim. /5
It is not just people “at death’s door” who fall victim. /5
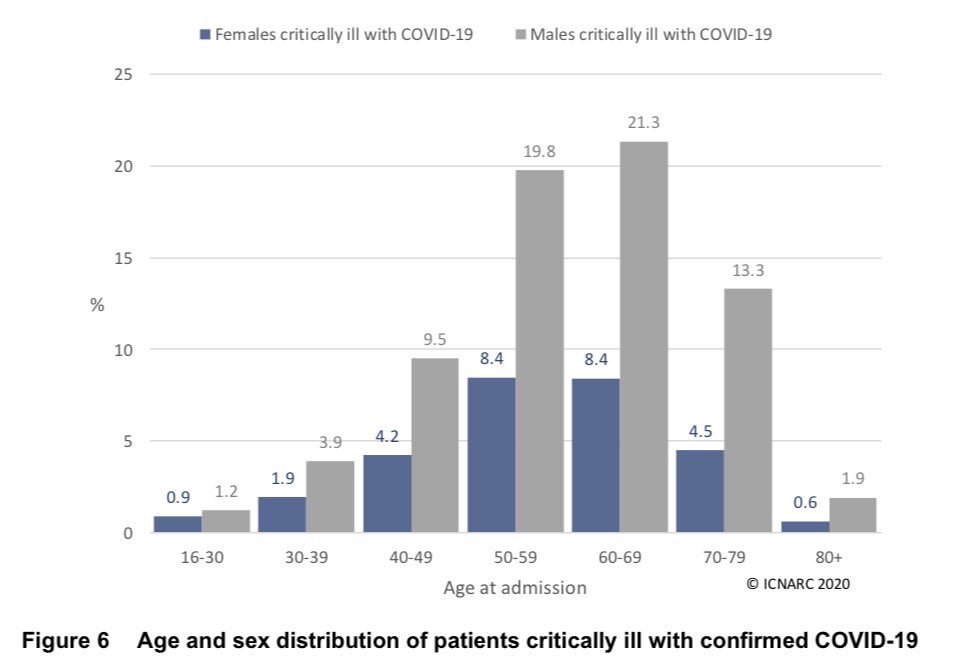
The age and sex distribution remains striking. Two thirds of the ICU patients are men aged 40-80. Men are more at risk than women in every age group. /6
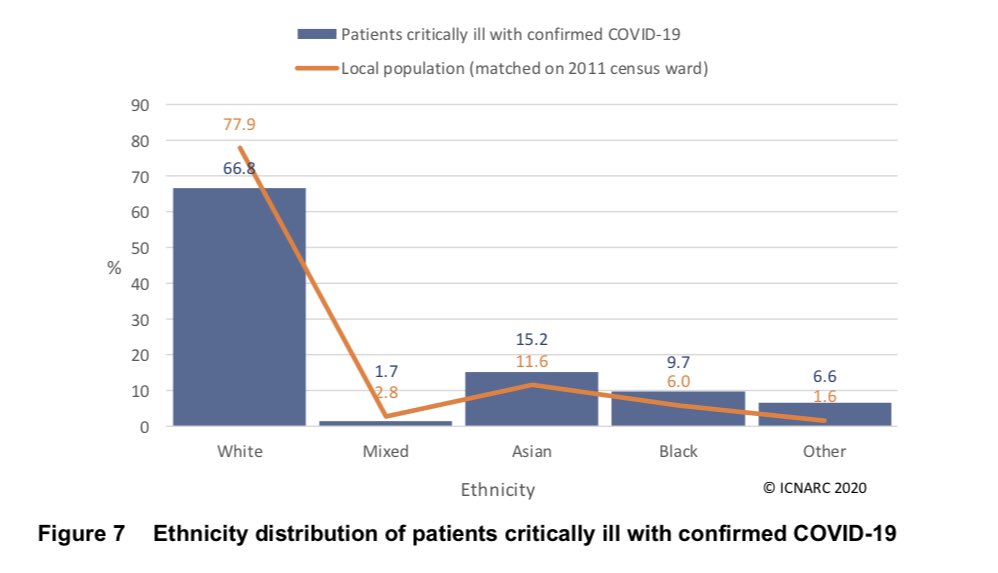
It remains clear that Asians, Blacks and other ethnicities are over-represented.
Compared to white ethnicity, ICU admission is
- 50% more likely for Asians
- 90% more likely for blacks
- over four times as likely for other ethnicity. /7
Compared to white ethnicity, ICU admission is
- 50% more likely for Asians
- 90% more likely for blacks
- over four times as likely for other ethnicity. /7
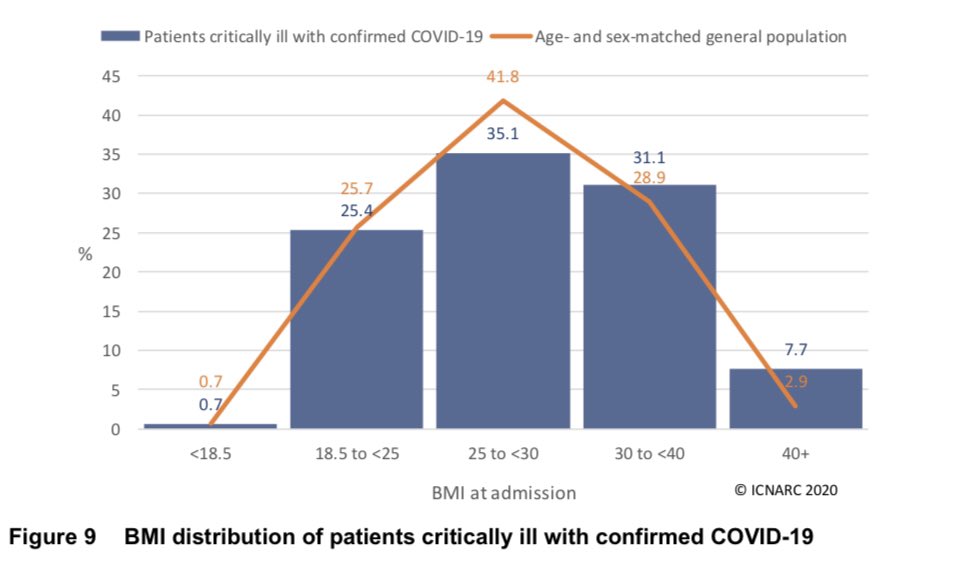
BMI picture is little changed. ICU admissions are about what we’d expect for healthy weight or under. There are fewer ICU admissions than expected for the ‘overweight but not obese’ group and more for obese, especially very obese. /8
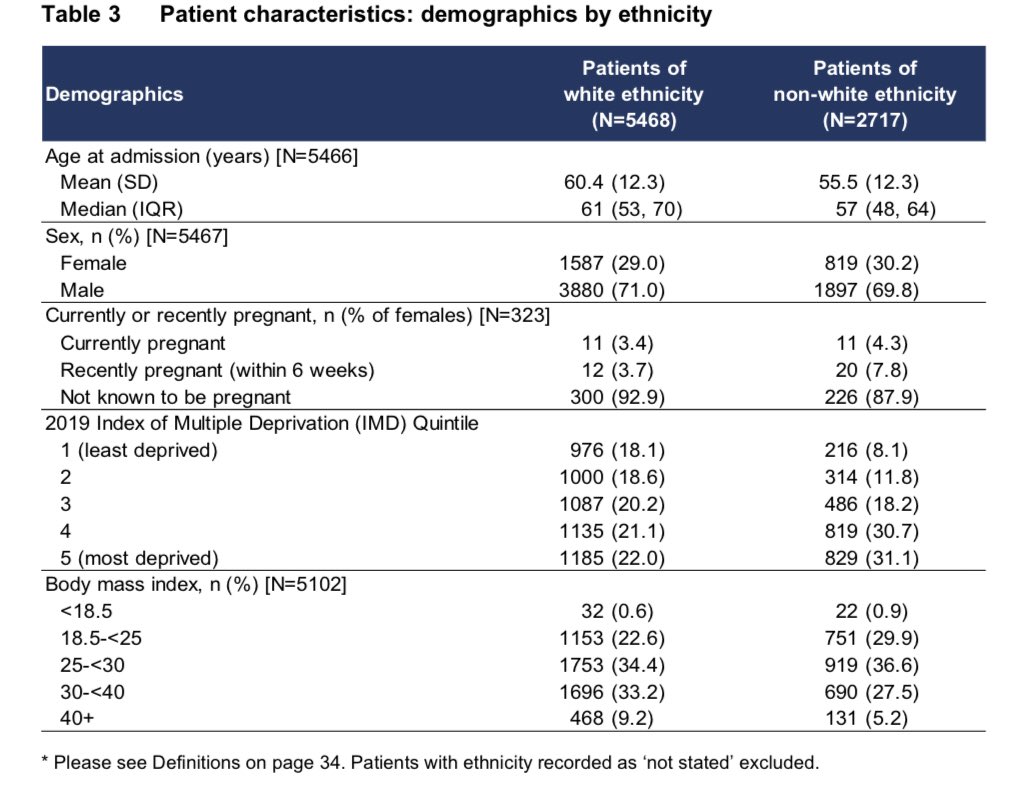
Here’s an interesting NEW breakdown to help us understand ethnic and demographic intersectionality.
Non-white ICU admissions are:
- significantly younger
- much more like to be living in deprivation
- much less likely to be obese. /9
Non-white ICU admissions are:
- significantly younger
- much more like to be living in deprivation
- much less likely to be obese. /9
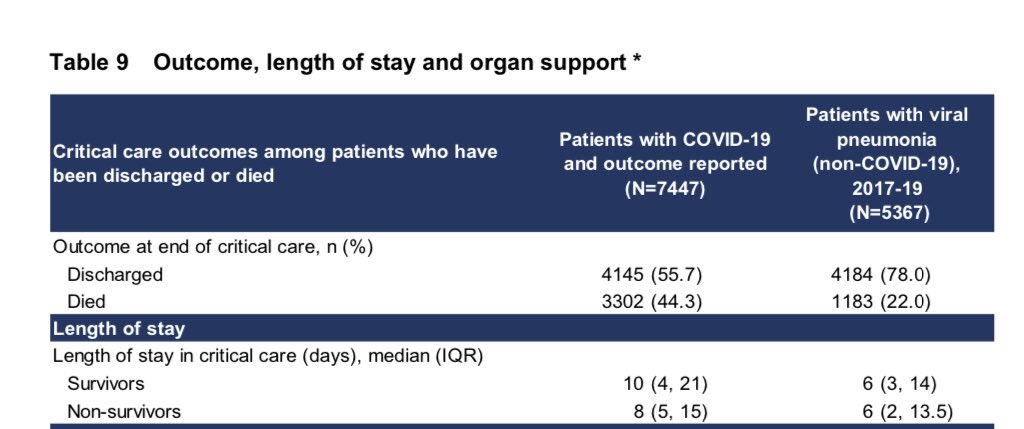
While many charts and tables are now quite stable the outcomes summary is meaningfully changing week on week.
Survival is improving (was 50/50 a few weeks ago).
Length of stay is increasing (initially it was naturally biased towards those who died or recovered quickly). /10
Survival is improving (was 50/50 a few weeks ago).
Length of stay is increasing (initially it was naturally biased towards those who died or recovered quickly). /10
The significantly higher length of stay in ICU for COVID-19 compared to other viral pneumonia https://abs.twimg.com/emoji/v2/... draggable="false" alt="👆" title="Up pointing backhand index" aria-label="Emoji: Up pointing backhand index">is another reason that this disease is such a threat to NHS capacity. We need at least 1.5 times resources (beds, doctors, nurses, ventilators, etc) per patient. /11
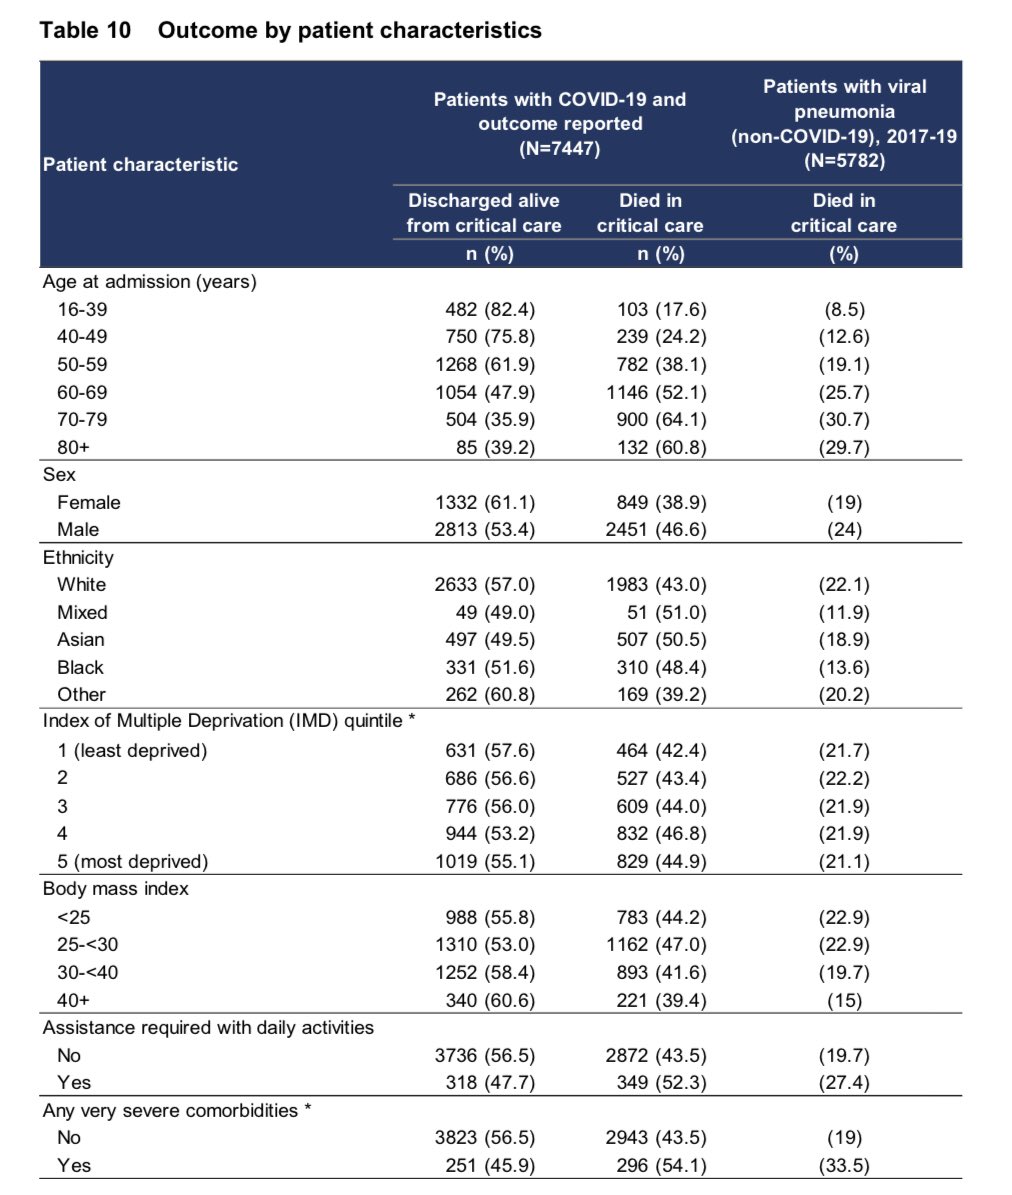
Table 10 (used to be 8) shows outcomes data by individual variables. It’s an interesting summary but we have multivariable analysis available now which is even more informative. /12
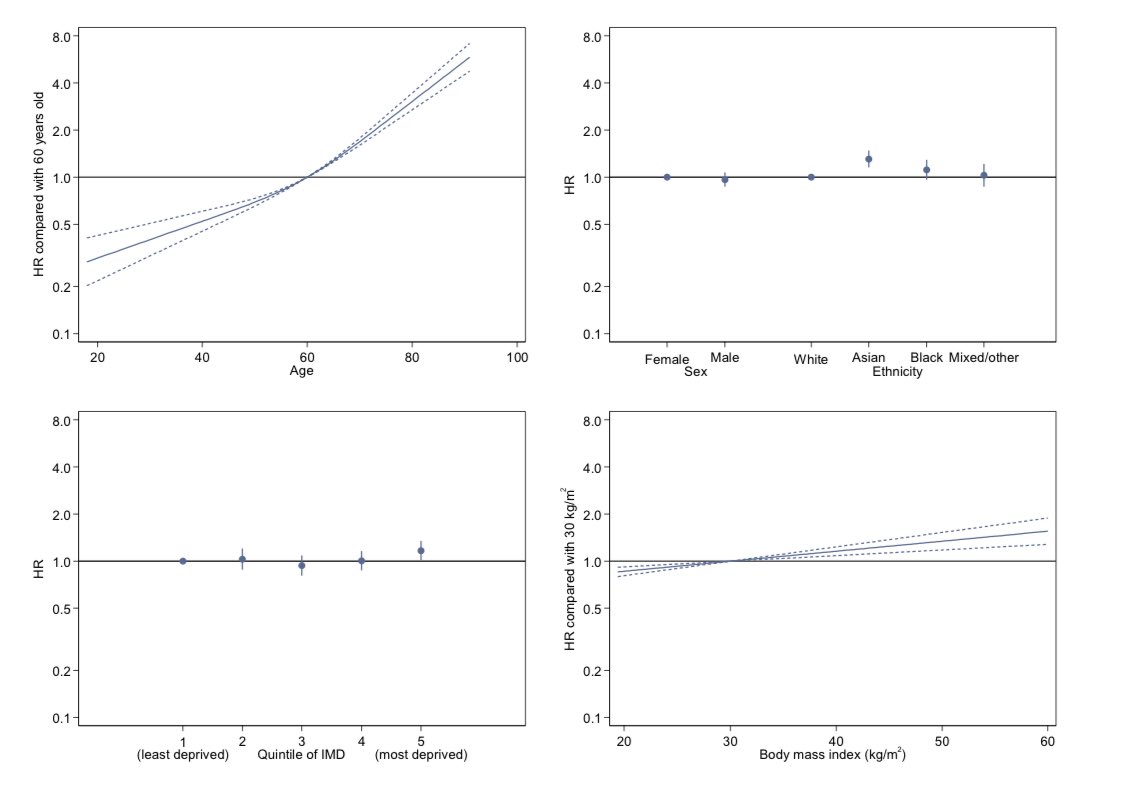
Figure 15 shows hazard ratios for various characteristics.
This is the risk of dying having been admitted to ICU.
In each case comparison to a reference group where the risk is 1.0 by definition.
So for example a patient aged 70 is twice as likely to die as one aged 60. /13
This is the risk of dying having been admitted to ICU.
In each case comparison to a reference group where the risk is 1.0 by definition.
So for example a patient aged 70 is twice as likely to die as one aged 60. /13
The hazard ratios https://abs.twimg.com/emoji/v2/... draggable="false" alt="👆" title="Up pointing backhand index" aria-label="Emoji: Up pointing backhand index">tell us that, all else being equal;
- age is highly significant, the strongest predictor by far of survival after ICU admission
- there is no statistically significant difference by sex. /14
- age is highly significant, the strongest predictor by far of survival after ICU admission
- there is no statistically significant difference by sex. /14
Hazard ratios https://abs.twimg.com/emoji/v2/... draggable="false" alt="👆" title="Up pointing backhand index" aria-label="Emoji: Up pointing backhand index">cont’d:
- only Asians have statistically significant extra mortality risk compared to whites.
- only the most deprived 20% have statistically significant extra mortality risk compared to least deprived 20%
- chance of survival falls significantly as BMI rises. /15
- only Asians have statistically significant extra mortality risk compared to whites.
- only the most deprived 20% have statistically significant extra mortality risk compared to least deprived 20%
- chance of survival falls significantly as BMI rises. /15
I want to draw attention to this extremely helpful expert discussion from last week (David is ICNARC head statistician).
To paraphrase, “all else being equal” is a big caveat as the model is looking at medical and demographic characteristics simultaneously. /16
To paraphrase, “all else being equal” is a big caveat as the model is looking at medical and demographic characteristics simultaneously. /16
So for example, the fact that sex is not significant only tells us that a man and a women who are equally unwell (as measured by the various medical factors) are equally likely to survive. If the average man is sicker on admission then he’s less likely to survive. /17
To summarise and clarify, tweets 4-9 show relative risk of being admitted to ICU.
Tweets 12-17 discuss relative risk of surviving, once admitted to ICU.
Some groups doubly at risk, e.g. Asians.
Some are more likely to need ICU but may be at no extra risk once admitted. /18
Tweets 12-17 discuss relative risk of surviving, once admitted to ICU.
Some groups doubly at risk, e.g. Asians.
Some are more likely to need ICU but may be at no extra risk once admitted. /18
Thanks to @ICNARC for these informative reports which provide ever more insight as data increases and insightful new analysis is added.
The next couple of weeks will be particularly interesting as any consequences of UK change in lockdown emphasis becomes apparent. /19 https://twitter.com/ics_updates/status/1248568944048439296">https://twitter.com/ics_updat...
The next couple of weeks will be particularly interesting as any consequences of UK change in lockdown emphasis becomes apparent. /19 https://twitter.com/ics_updates/status/1248568944048439296">https://twitter.com/ics_updat...
One last point as I think it’s important.
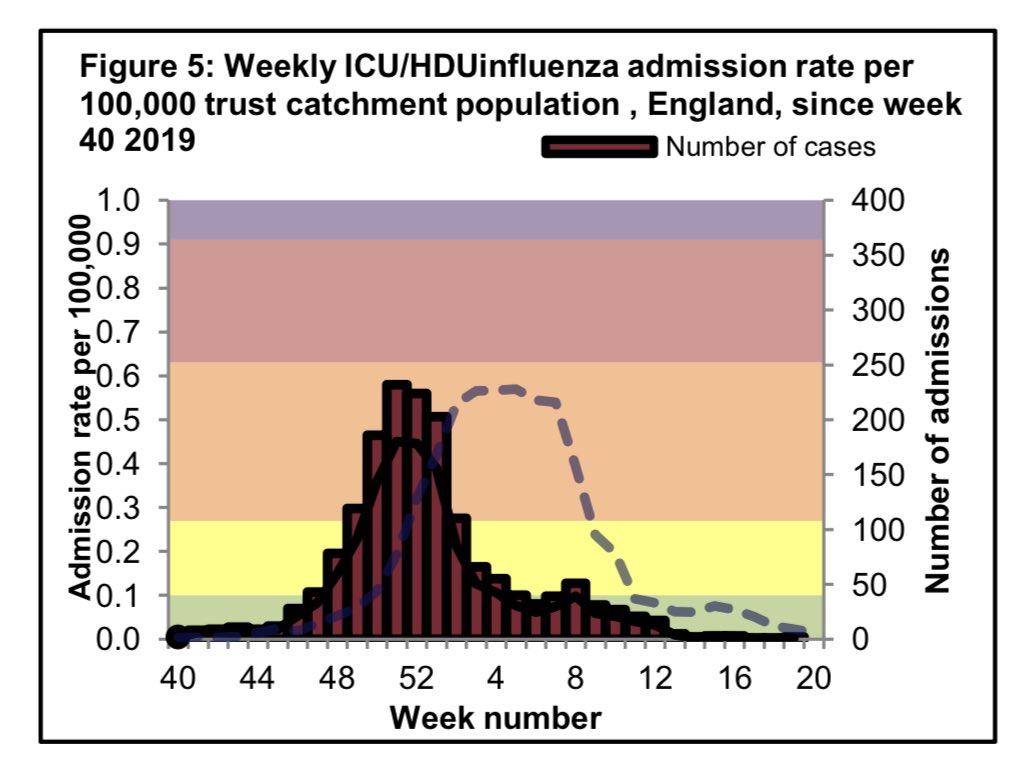
I said “daily admissions are low” but I should have said “relatively low”. They only look low by comparison to the last few weeks!
There were 300 COVID admissions in the last week (ignoring the lag period). /20 https://twitter.com/actuarybyday/status/1264109833495683072">https://twitter.com/actuaryby...

 Read on Twitter
 /2" title="Daily admissions are low but have perhaps stopped falling. If there’s been any increase in infections after Government messaging changed on 11 May then next week’s update is one of the first public data sources where we’ll be able to look for early signs. https://abs.twimg.com/emoji/v2/... draggable="false" alt="👀" title="Eyes" aria-label="Emoji: Eyes"> /2" class="img-responsive" style="max-width:100%;"/>
