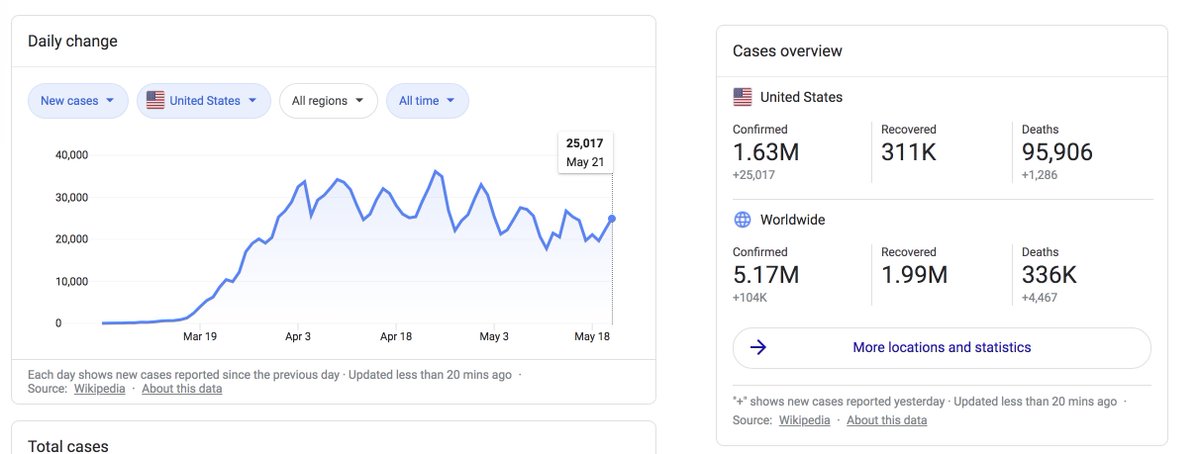
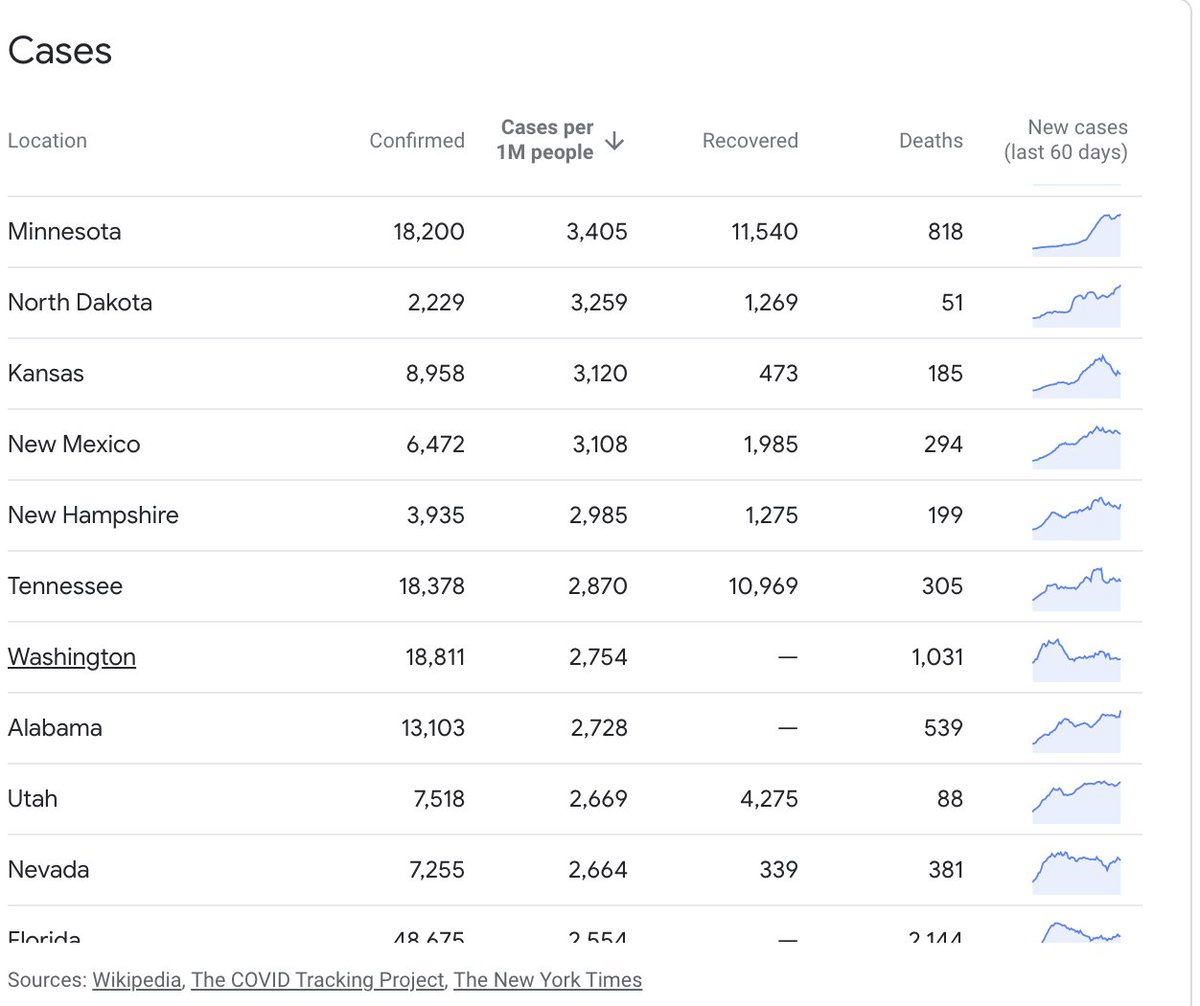
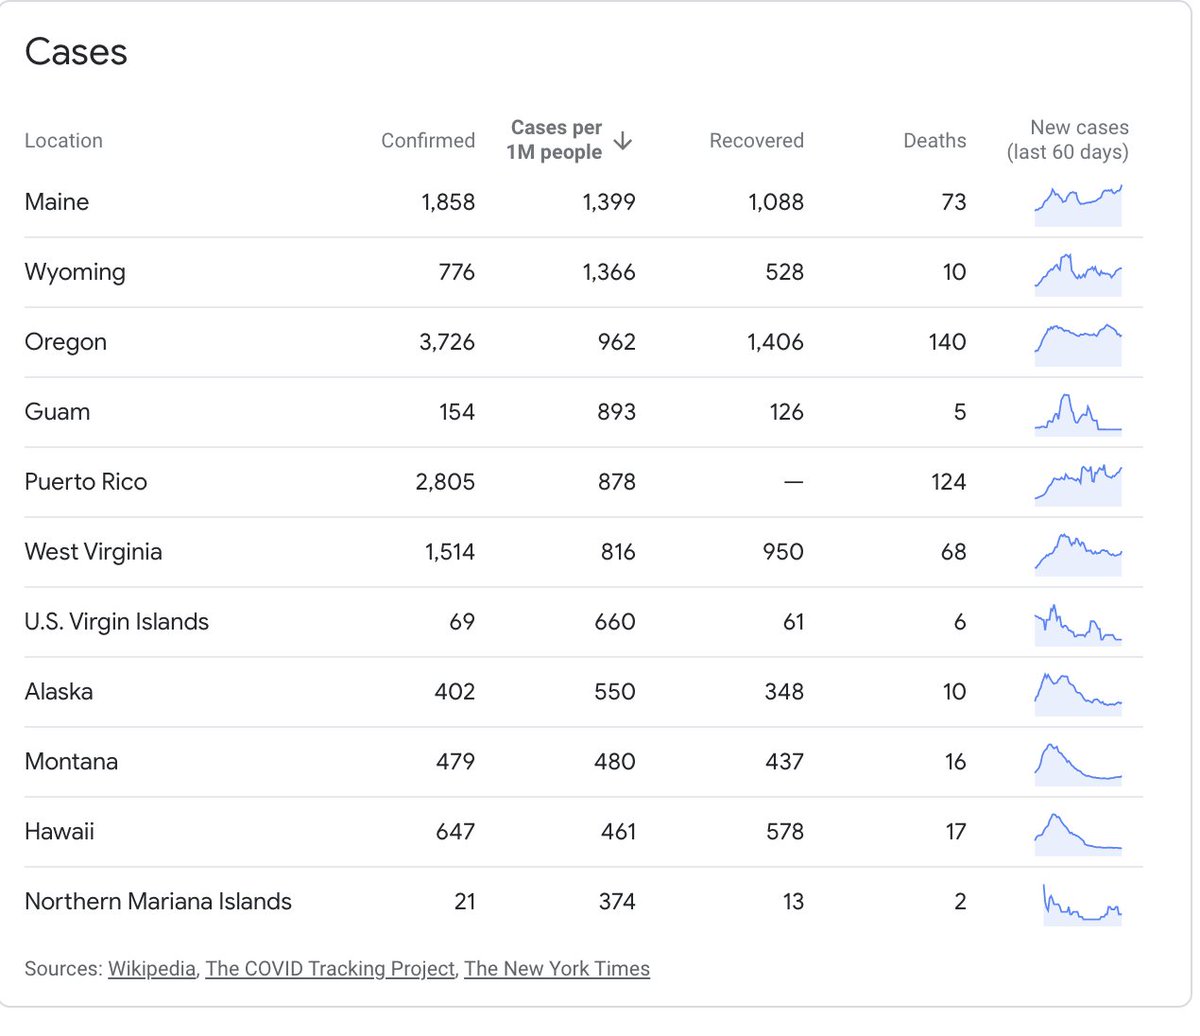
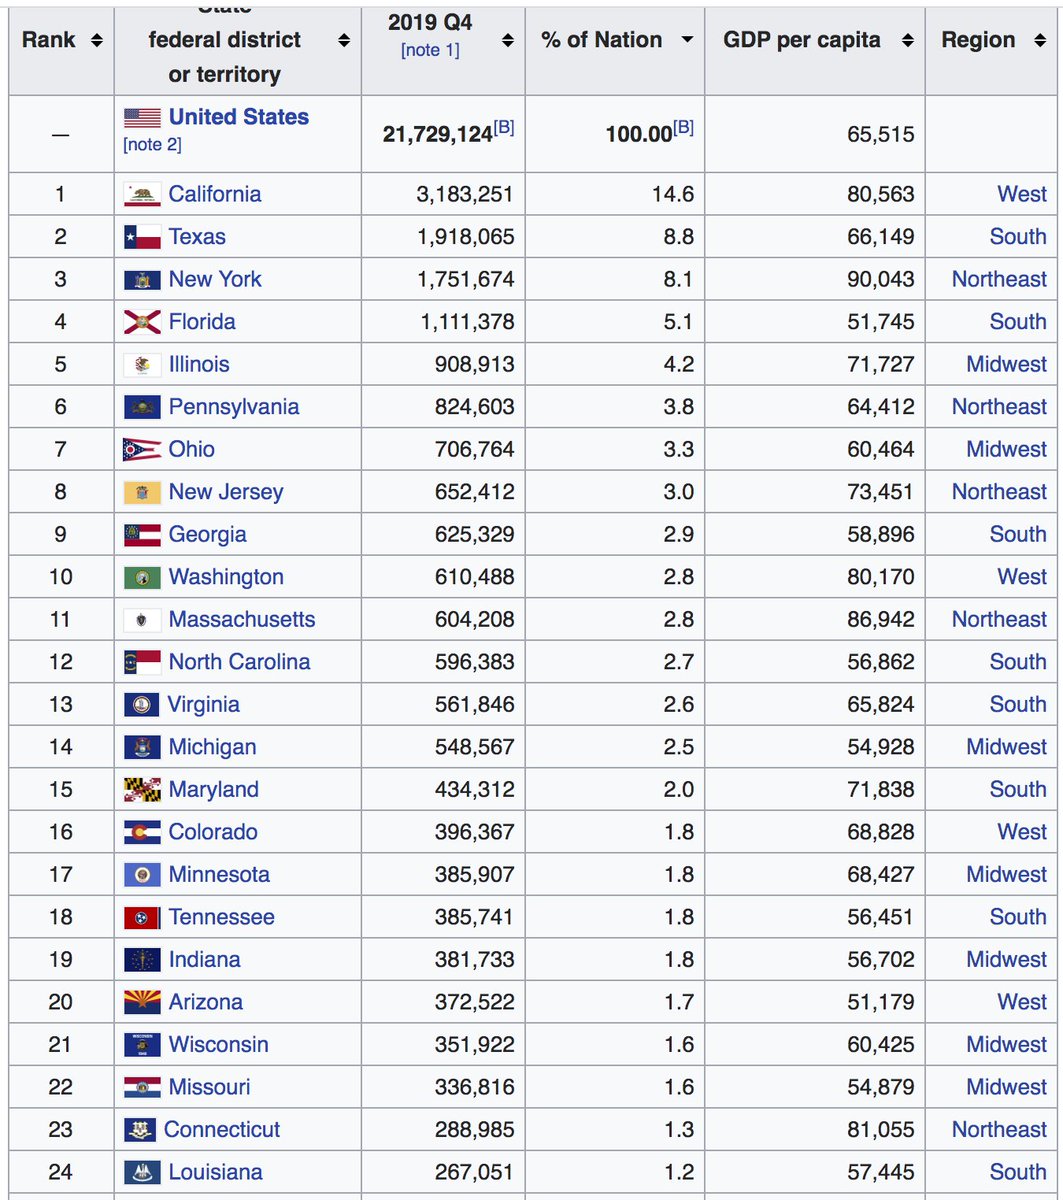
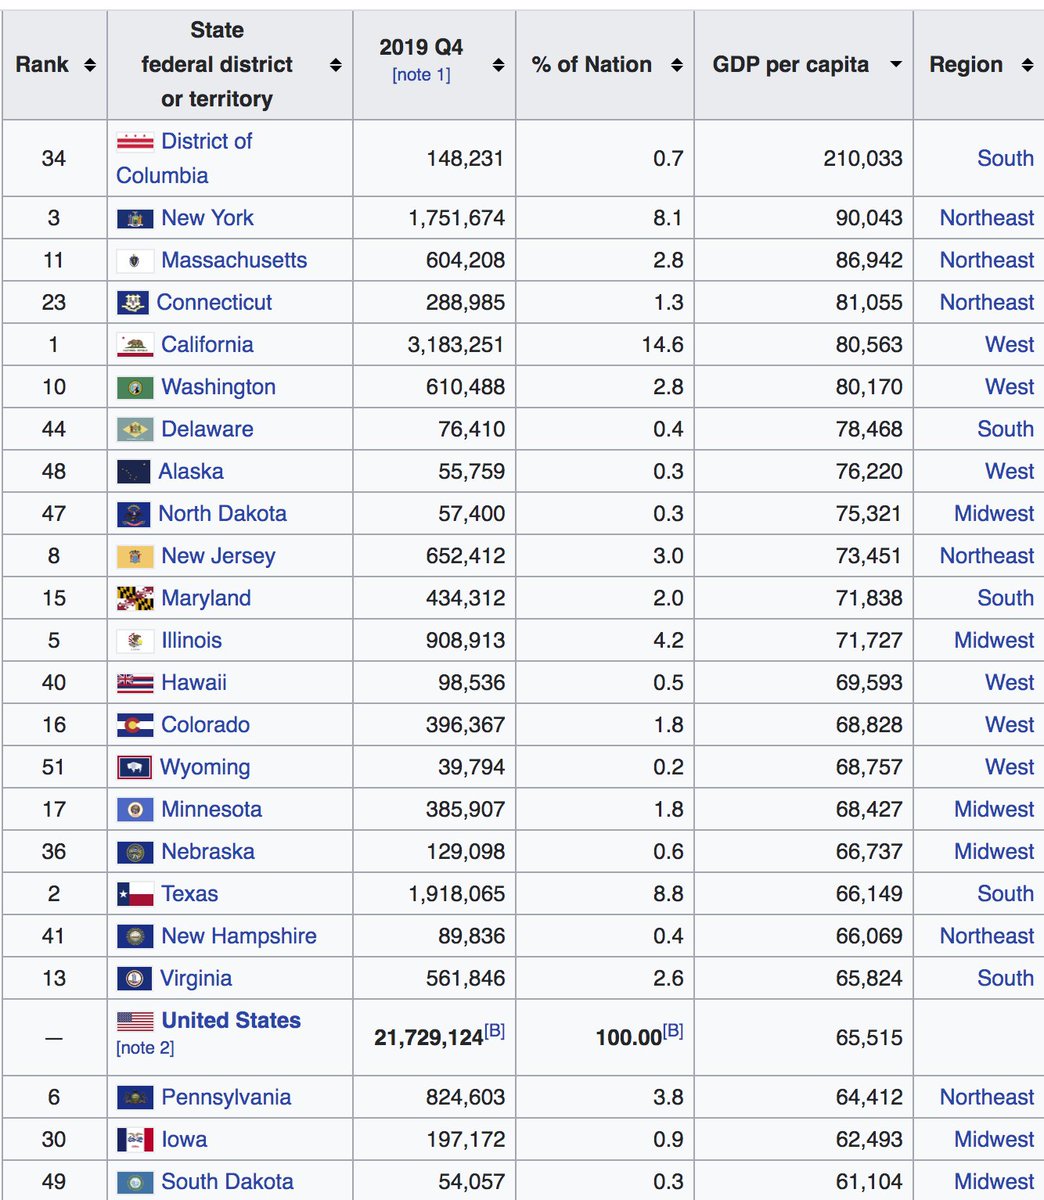
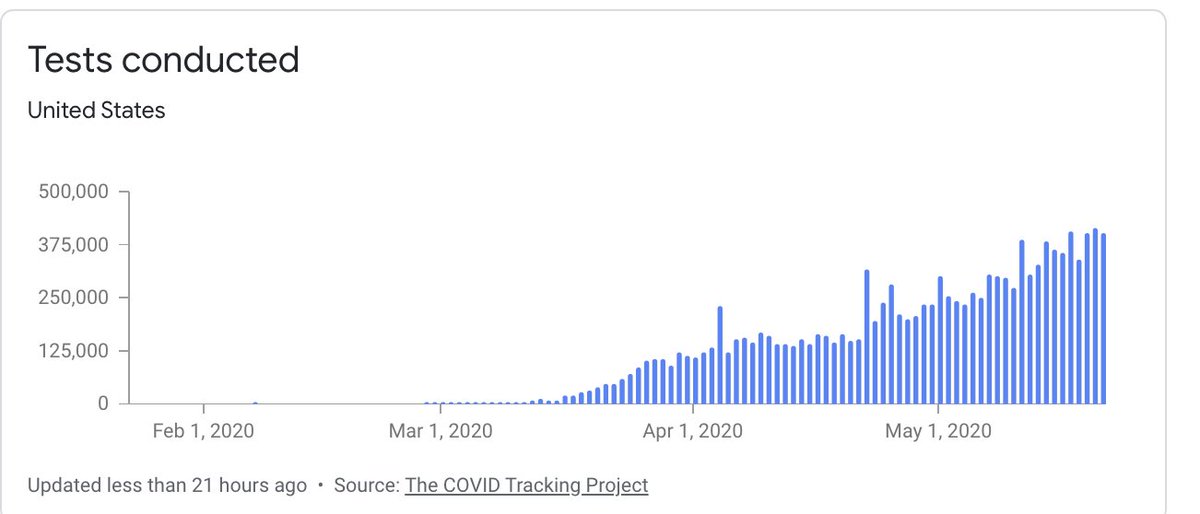
I was looking at the Covid data sets on Google that link to other data sets. Due to testing, reporting, data aggregation & use of different categorizations, they& #39;re not exactly clean, but I suspect in a few months to a year, some more robust data will exist.
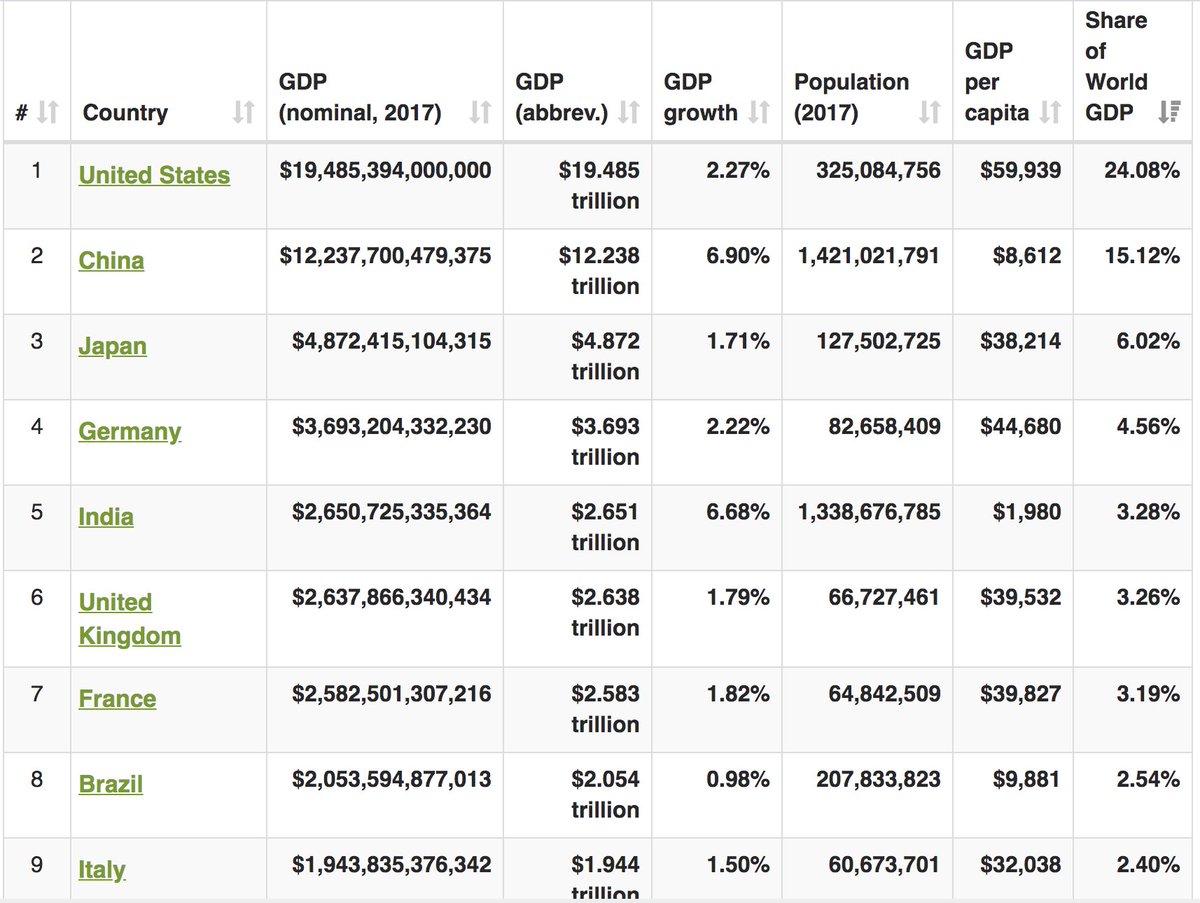
I am interested in several questions, namely population, pop. density, pop as % of world population, GDP, GDP per capita, GDP as % of world GDP, urbanization, trade, Covid cases, deaths, recoveries, cases per population, & the skew between testing & non testing countries.
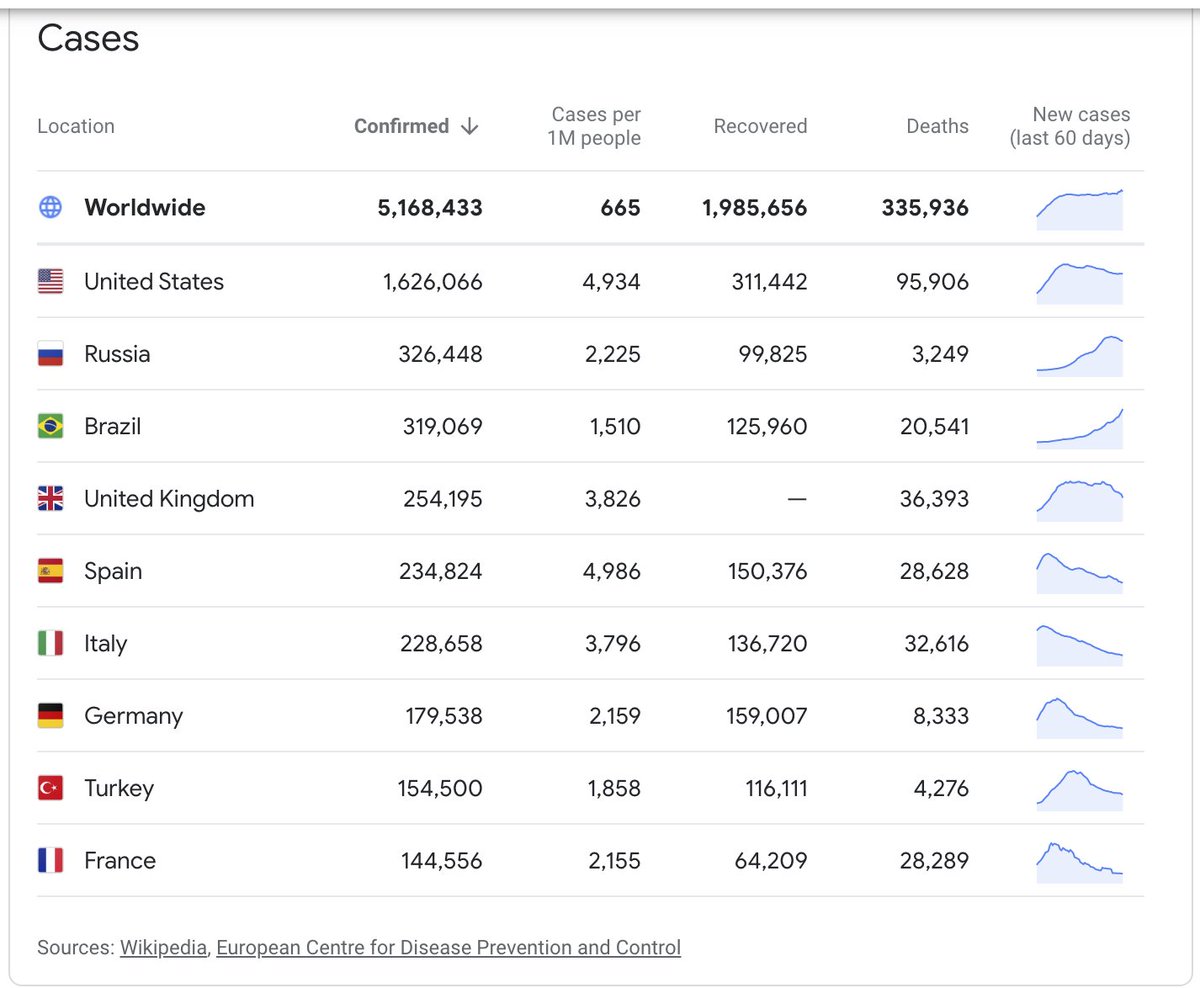
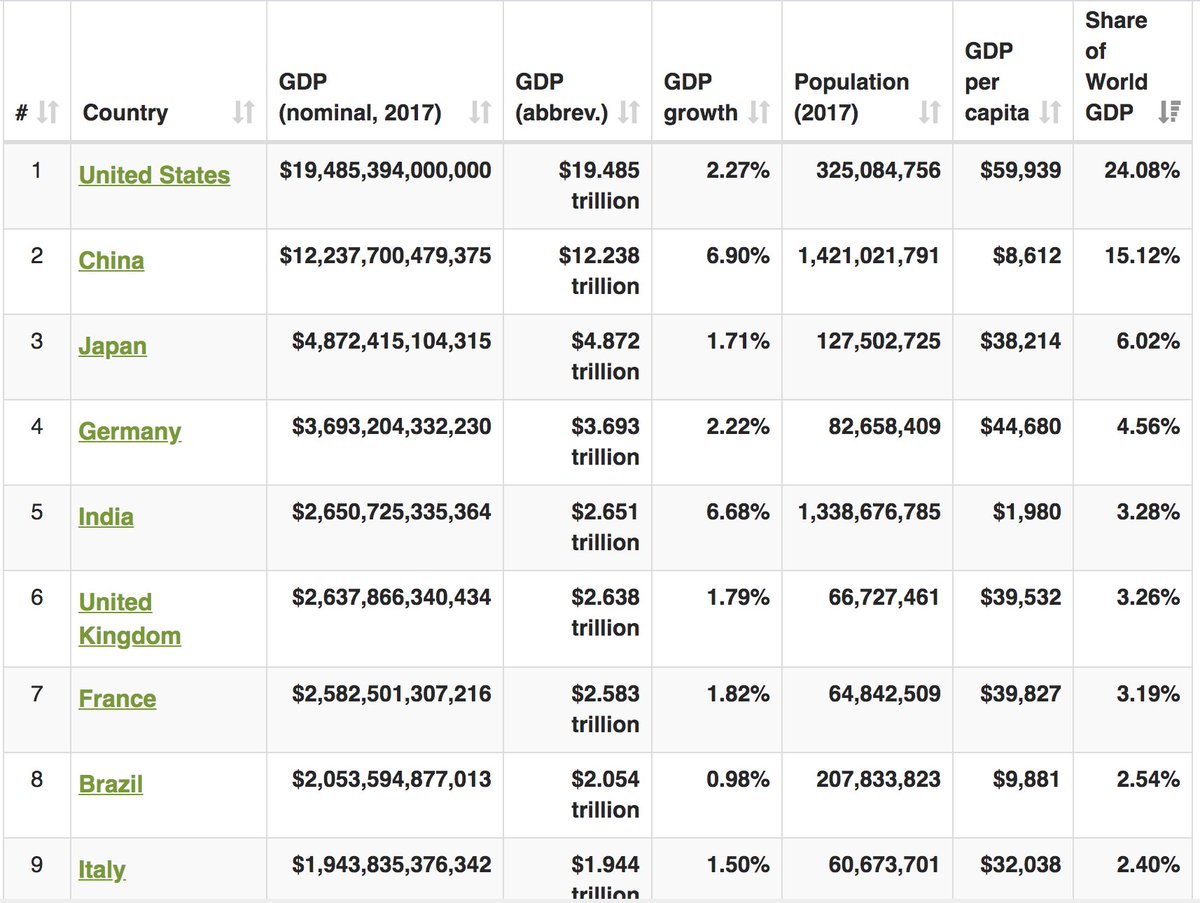
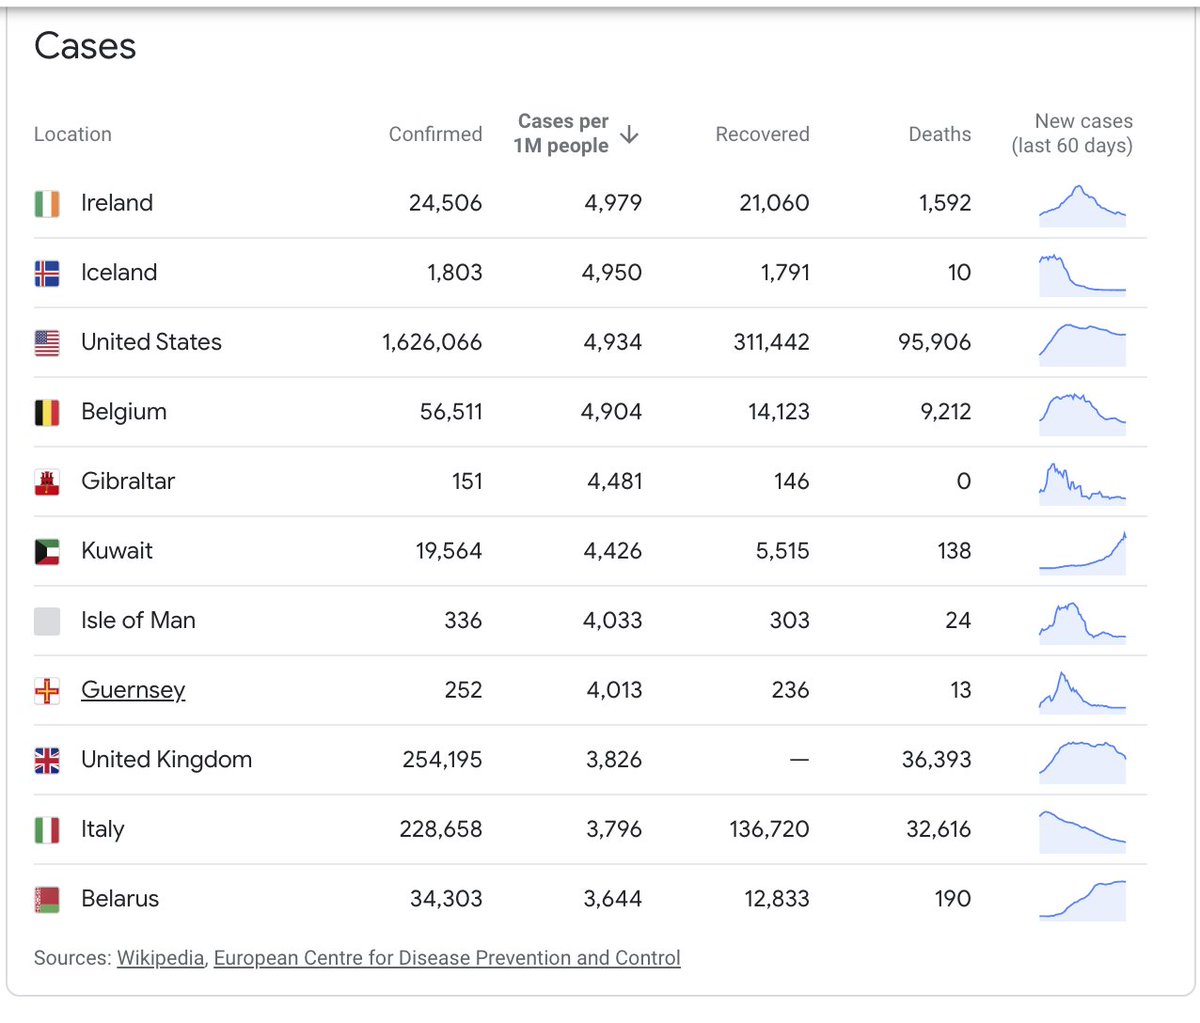
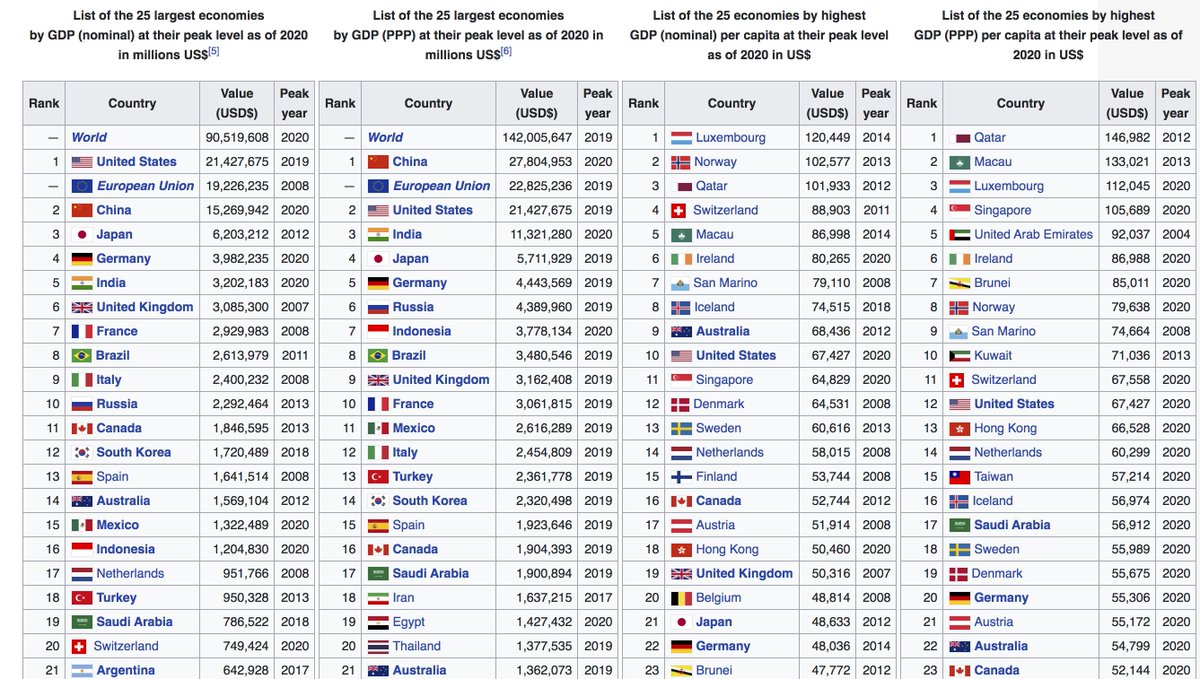
So, for example, I noticed that, at least off the cuff, whereas the skew between US as share of world population (around 4%), and of Covid cases (around 30%), is huge, as compared to share of GDP (24%) it& #39;s much less disparate.
This relation may hold slightly for the world as well, although I am too lazy to aggregate the various data sets and do basic statistics at the moment, even though they have a premade script for loading it into R lol
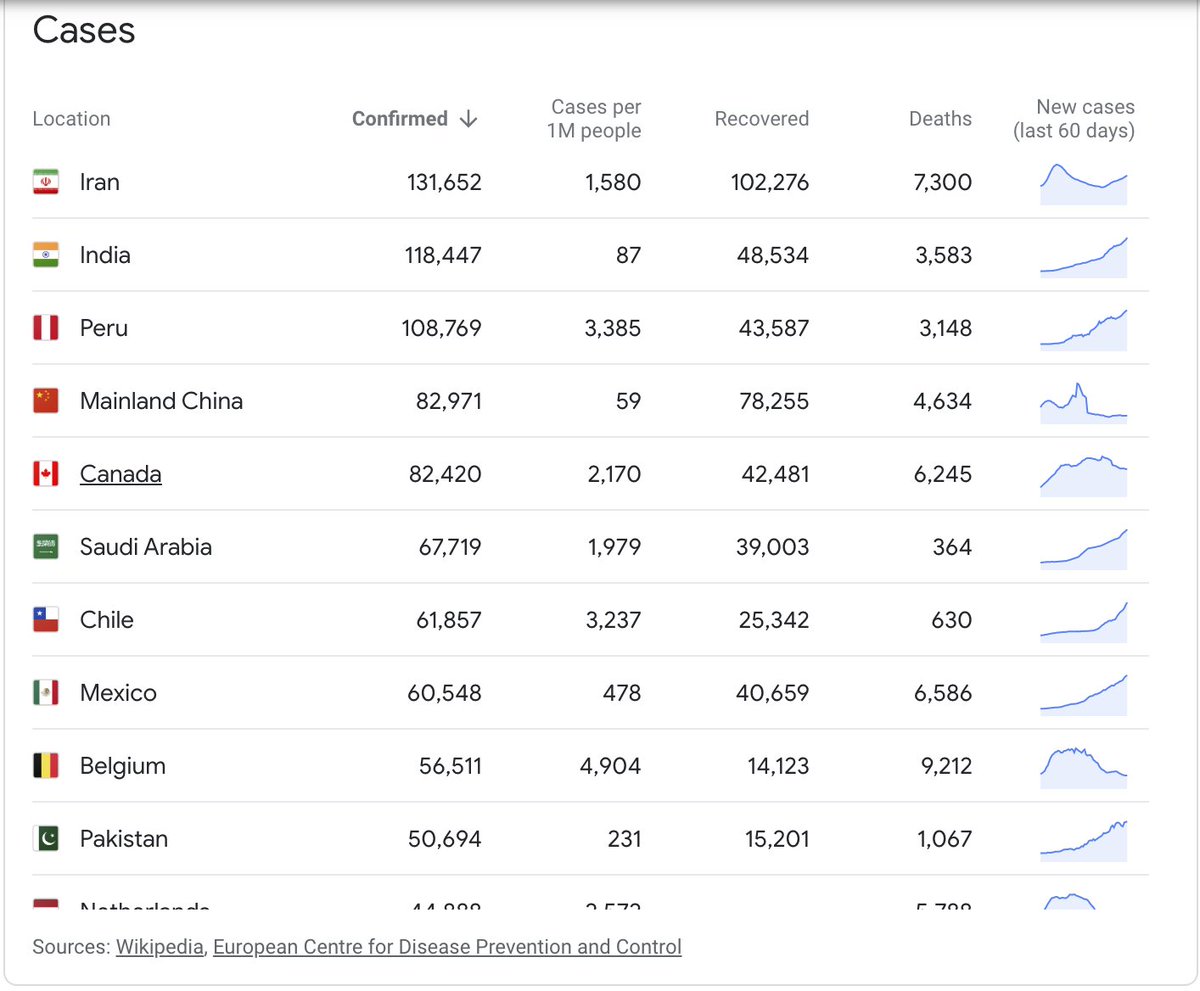
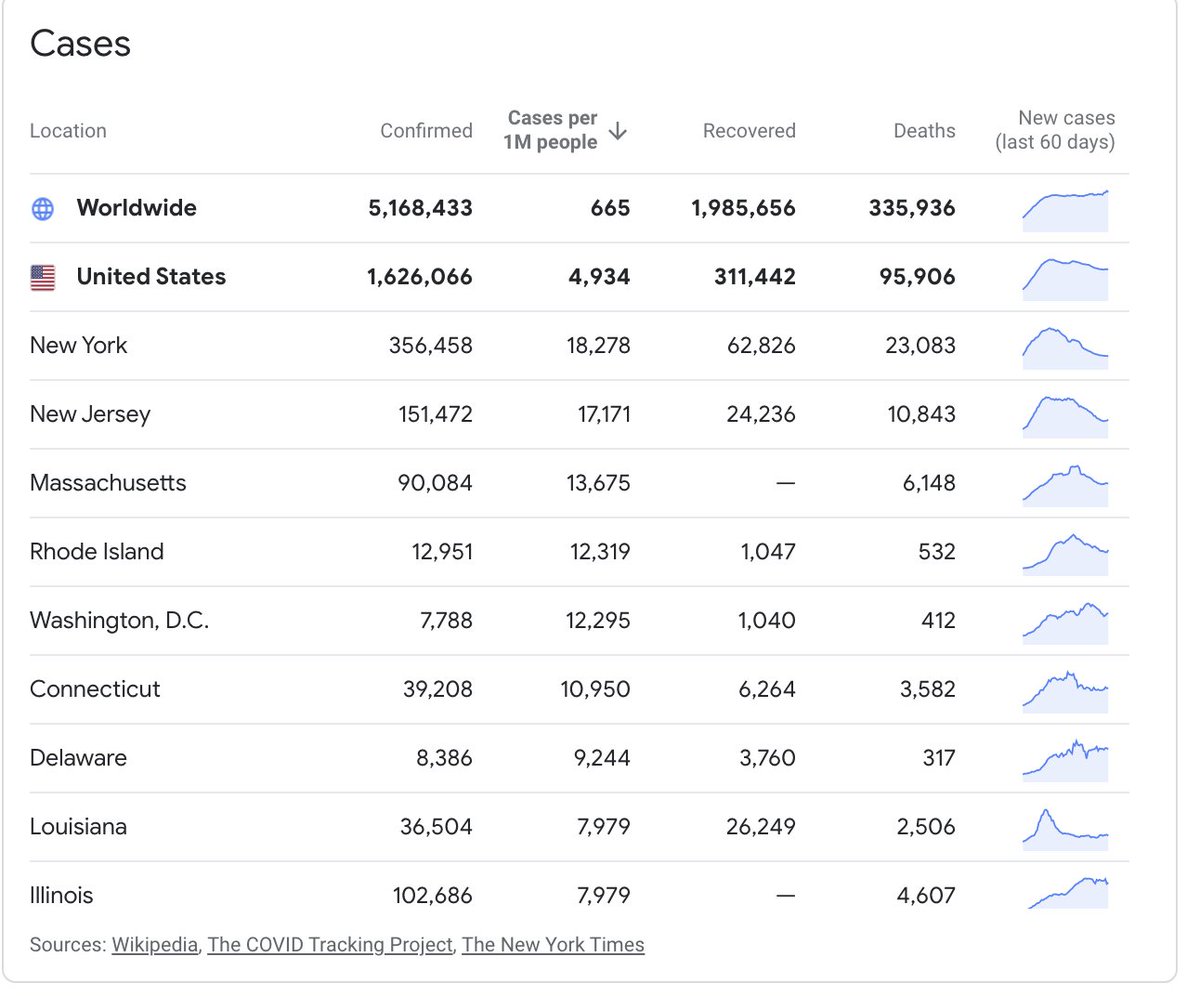
Anyway my math is really off the cuff but from what I could tell, the global mean rate per person is as above 665, while the median per person rate is closer to 300 (since the data set combines two sources they& #39;ve a lot of mismatched terms)
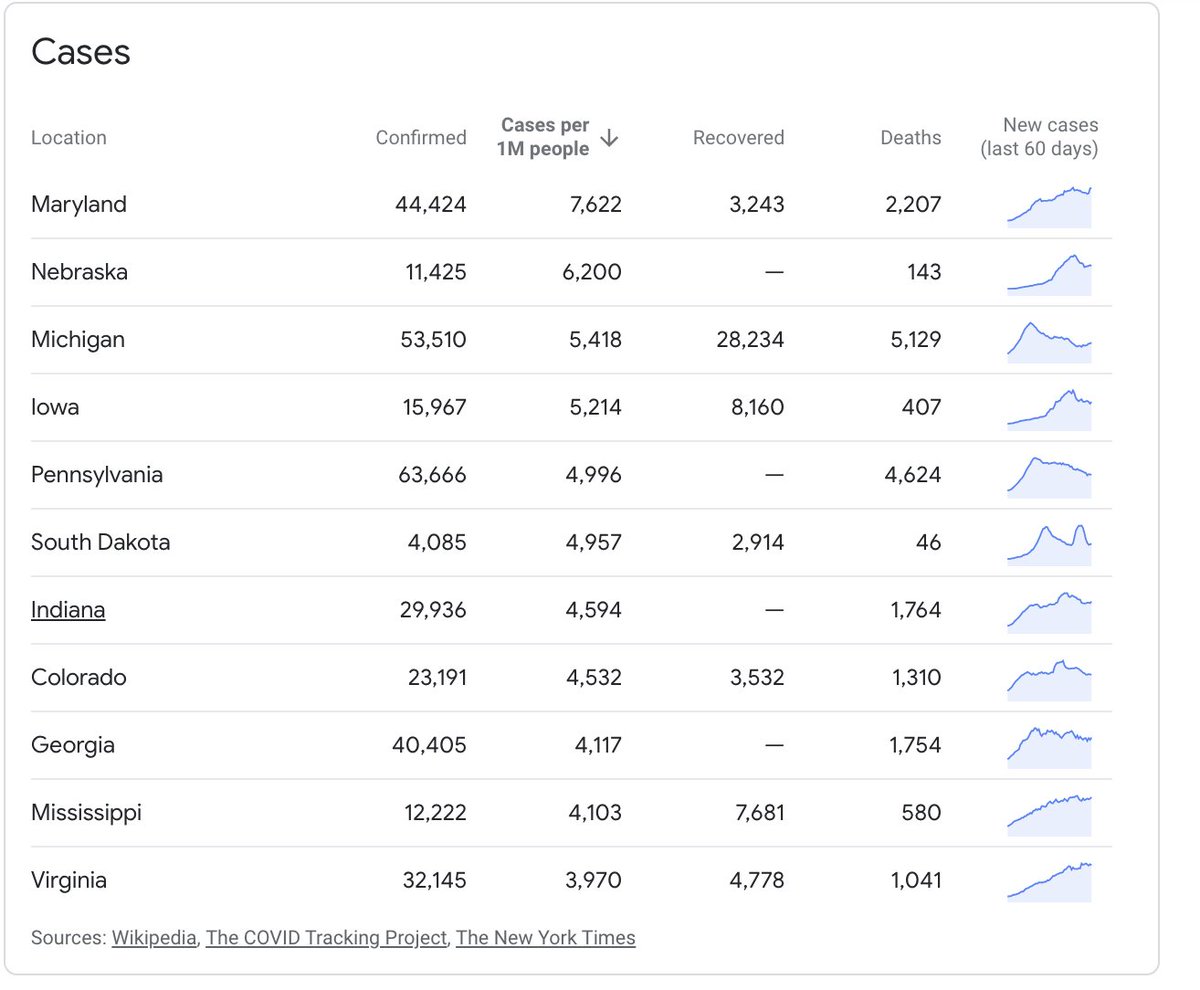
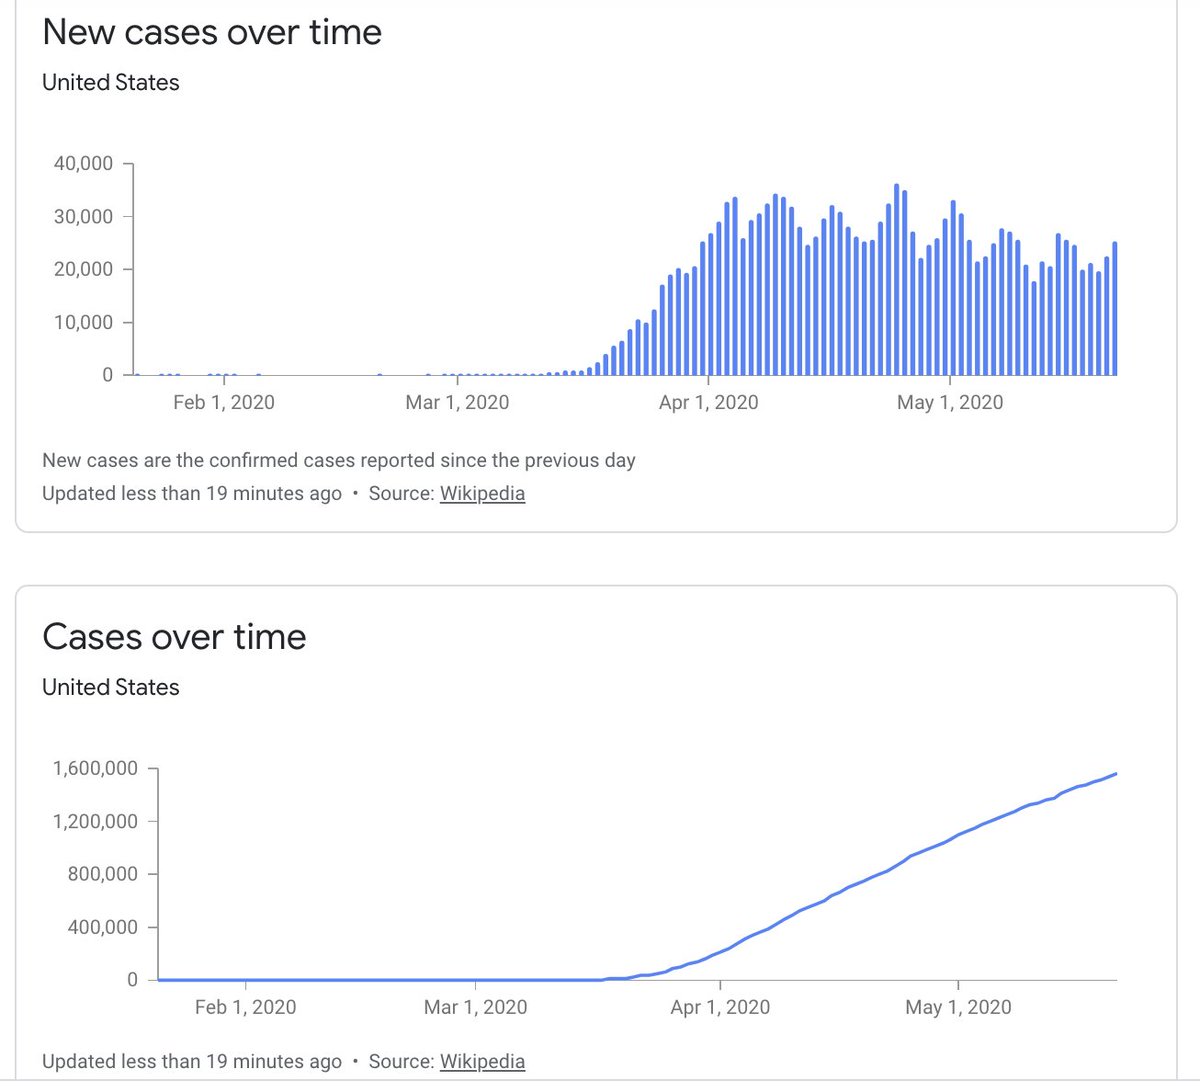
Meanwhile the US& #39; rate per person is more like 5000, but its median is more like 3000 (again this is VERY rough). It& #39;s average per state rate is around 32,00, but its median is more like 12,000 (partly because states are arbitrarily sized lol)
Estimating the relations *within* the US to the above variables (economic, demographic, etc) will be interesting. In a few months to a year we& #39;ll probably have better contact tracing, entry point, spread, & healthcare response data, making this more than idle speculation.
To be clear, I see studies estimating these kinds of things literally every day, and professional epidemiologists are working with substantially more sophisticated models than my off the cuff estimates (lmao), so I& #39;m not trying to generate any conclusions, just to form theories
The thing is I don& #39;t really trust the infection, death, recovery, tracing, healthcare & other data right now, bc all hospitals & governments have incentives to lie or omit, and the testing regimes & classification regimes vary so substantially. But this will improve over time
Also, as a side note, the disparities between mean earnings, median earnings, mean national income (GDP per capita), median income, on individual, household, state & international lines is so interesting, as is that between it and PPP.
If this is to be believed, PPP global income is on the order of $140 Trillion USD. That means in nominal terms, world GDP per capita is around $11,500 whereas in & #39;Real& #39; PPP terms, it& #39;s more like $18,000. Notably, the happiness/Per capita income relation breaks down around here
There& #39;s a TON of issues with this research, including measurement, survey, aggregation & framing issues, but alas
1.
https://econreview.berkeley.edu/beyond-gdp-economics-and-happiness/
2.https://econreview.berkeley.edu/beyond-gd... href=" https://ourworldindata.org/happiness-and-life-satisfaction">https://ourworldindata.org/happiness...
1.
https://econreview.berkeley.edu/beyond-gdp-economics-and-happiness/
2.
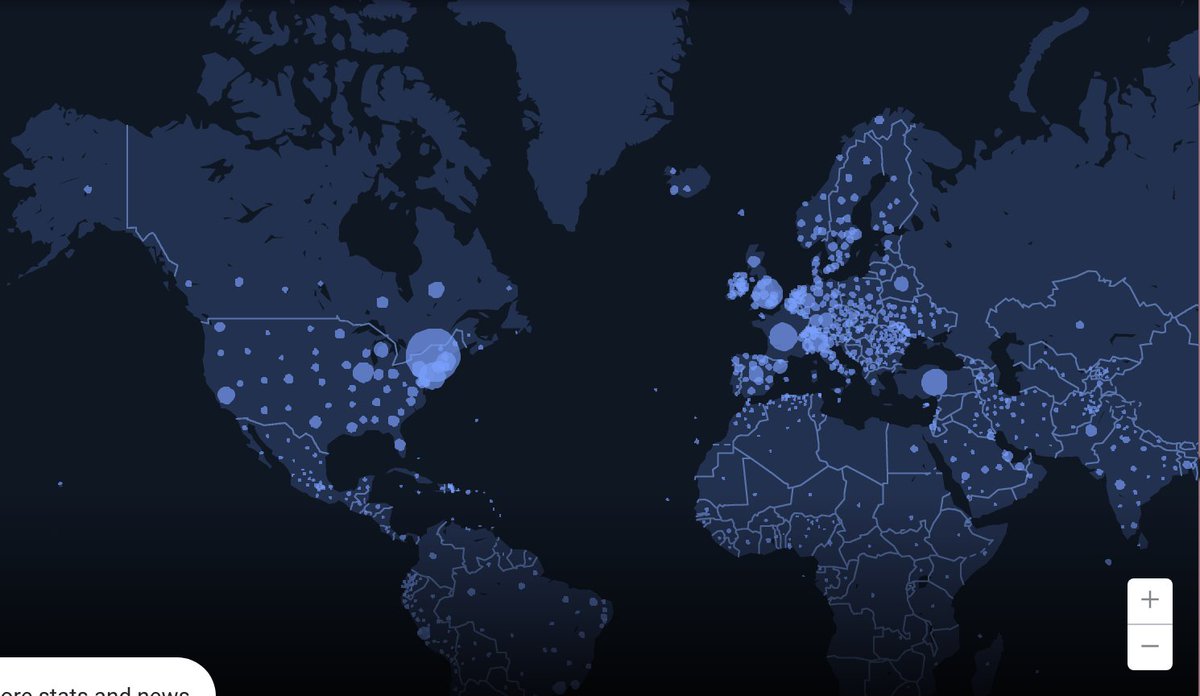
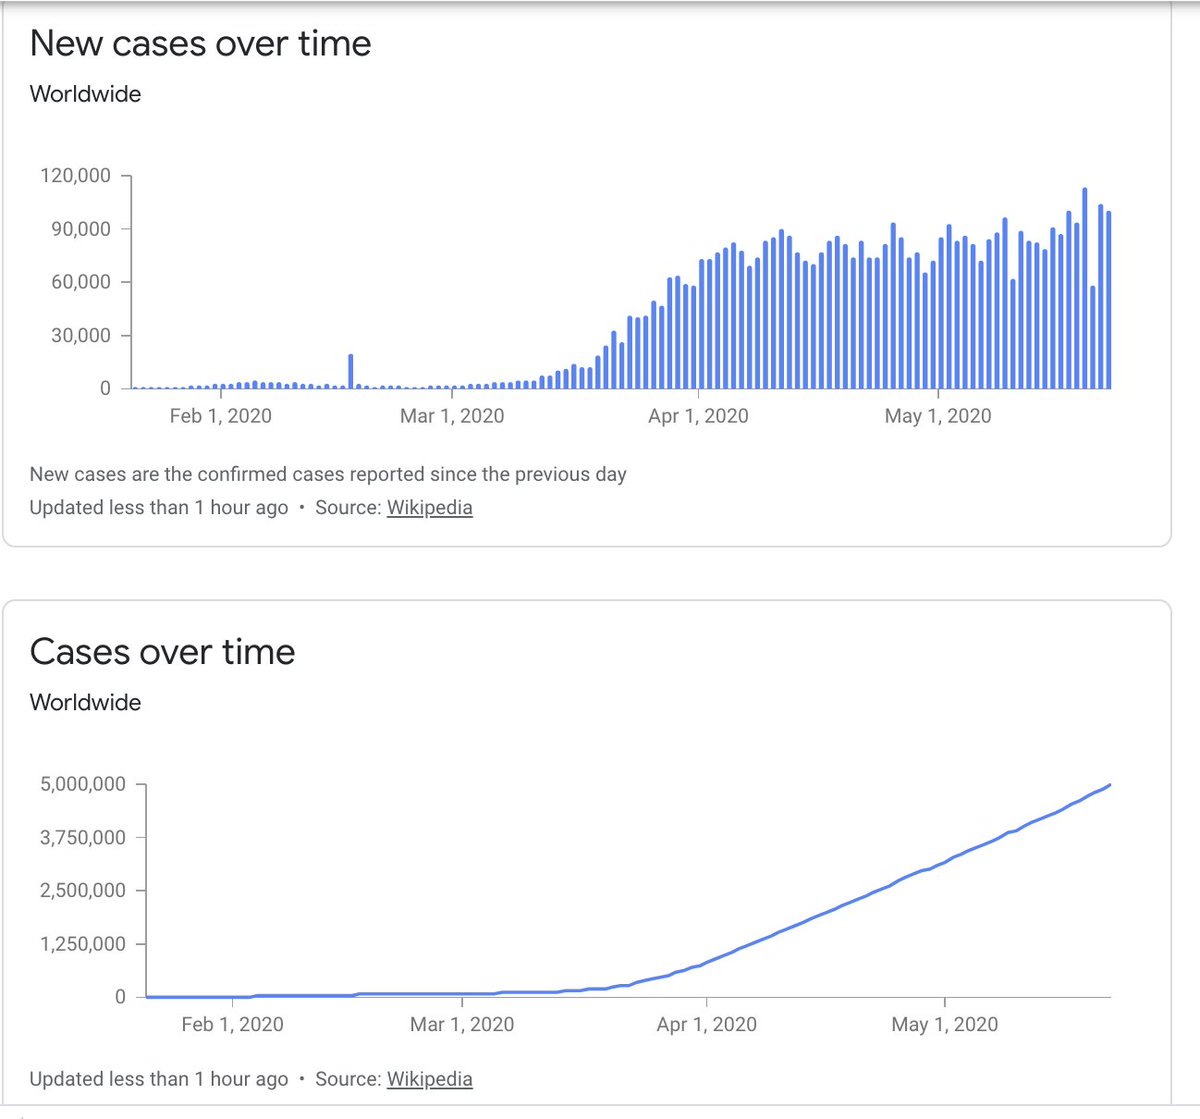
Some of the other cool charts & data sets Google aggregates in daily time. Social network, tracing, GIS, temporal, testing, recovery & death data will eventually probably really fine grained & a global model will reliably be estimated.
The within-week variation in new cases is very interesting, also it seems that the weekly peaks both here & abroad decline more slowly than the troughs. Cases, deaths, & recoveries as a function of testing, both within & across countries & time is interesting.
Eventually it& #39;ll be modeled as a function of social, geographic, & economic distance, centrality, and density, as well as a function of time, aggregate variables, and other things. Epidemiology & social science is dope & I& #39;ve been trying to keep abreast--it& #39;s moving fast.
Anyway, if anyone wants to actually do real social science and not my lazy ass form of it (again I am not trying to make any points here or spread a specific theory, this is just for personal interest!!! read epidemiology!) i& #39;ll link to the data sets
1. https://news.google.com/covid19/map?hl=en-US&gl=US&ceid=US%3Aen&mid=%2Fm%2F09c7w0
2.">https://news.google.com/covid19/m... https://news.google.com/covid19/map?hl=en-US&gl=US&ceid=US%3Aen
3.">https://news.google.com/covid19/m... https://news.google.com/covid19/map?hl=en-US&gl=US&ceid=US:en
4.">https://news.google.com/covid19/m... https://en.wikipedia.org/wiki/Template:COVID-19_pandemic_data
5.">https://en.wikipedia.org/wiki/Temp... https://www.ecdc.europa.eu/en/publications-data/download-todays-data-geographic-distribution-covid-19-cases-worldwide
6.">https://www.ecdc.europa.eu/en/public... https://www.worldometers.info/gdp/gdp-by-country/
7.">https://www.worldometers.info/gdp/gdp-b... https://en.wikipedia.org/wiki/World_economy
8.">https://en.wikipedia.org/wiki/Worl... https://en.wikipedia.org/wiki/COVID-19_pandemic_in_the_United_States">https://en.wikipedia.org/wiki/COVI...
To pay penitence for my idle speculation I am going to try to do a dump of actual scholarly articles on Covid, later. Hey @pp0196 & @sillyolyou wanna send me what y& #39;all have
https://www.ncbi.nlm.nih.gov/pmc/articles/PMC7086482/">https://www.ncbi.nlm.nih.gov/pmc/artic...
https://academic.oup.com/jid/article/221/11/1752/5814216">https://academic.oup.com/jid/artic...
https://www.acmicrob.com/microbiology/the-impact-of-climate-change-and-other-factors-on-zoonotic-diseases.php?aid=220">https://www.acmicrob.com/microbiol...
A lot of these are open access but for those that aren’t go to Sci Hub (search it in google bc its address varies), copy the DOI number from the article and paste it into Sci hub
It was interesting that air pollution, traffic & work reductions (as well as declines in other things like murder, other illness contacts etc), were reducing deaths, but now I bet they’ve been reversed almost entirely by the recent ramp up
https://twitter.com/yungneocon/status/1242214711057399811?s=21">https://twitter.com/yungneoco... https://twitter.com/yungneocon/status/1242214711057399811">https://twitter.com/yungneoco...
https://twitter.com/yungneocon/status/1242214711057399811?s=21">https://twitter.com/yungneoco... https://twitter.com/yungneocon/status/1242214711057399811">https://twitter.com/yungneoco...
Also, while traffic, workplace, pollution, murder & related deaths went down, as did infections in general, deaths rose other places due to hospital overload, medicine access, probably suicide, and obviously Covid.
Lockdown & quarantine was saving lives in many ways. If it had been combined with a robust social safety network, monetary guarantees, contact tracing, testing, vaccine efforts, & quarantines of at risk people for spreading or death, it would’ve been even more so.
This is especially the case if healthcare had been ramped up, if fossil fuels, extraction, and food production, especially meat, weren’t bailed out, subsidized & encouraged, and if robust institutions for mental health & abuse existed.
Under that best case scenario not only would Covid deaths be lower everywhere, but also all sources of death, but anyway, no use for counterfactual like that, back to the research!
This is a pre print and therefore not peer reviewed but is an example of the network analysis i mentioned above. Tentatively it finds most people don’t spread Covid but a small super spread pop does https://www.medrxiv.org/content/10.1101/2020.04.30.20081828v1">https://www.medrxiv.org/content/1...
A science journalism summary https://www.zdnet.com/article/google-researchers-show-how-covid-19-super-spreaders-are-a-big-part-of-the-problem/">https://www.zdnet.com/article/g...
This links to a series of studies. Tentatively it suggests that 10% of the infected may be responsible for 80% of new cases. https://www.sciencemag.org/news/2020/05/why-do-some-covid-19-patients-infect-many-others-whereas-most-don-t-spread-virus-all">https://www.sciencemag.org/news/2020...
Much has been made of asymptomatic carriers. This contains further links to several studies. Some suggest as high as 50% others lower numbers. https://hub.jhu.edu/2020/05/12/gigi-gronvall-asymptomatic-spread-covid-19-immunity-passports/">https://hub.jhu.edu/2020/05/1...
CDC estimates as many as 35% could asymptomatic carriers— careful to interpret this tho bc it means they are contagious before they show symptoms not that the never show them https://hub.jhu.edu/2020/05/12/gigi-gronvall-asymptomatic-spread-covid-19-immunity-passports/">https://hub.jhu.edu/2020/05/1...
The significance of this is that it means death rates for many countries are of a population that has been tested and showed symptoms, making it highly biased. Better testing & contact tracing produces lower death rates.
Some speculation again—i am trying to be very careful here about separating out what I’m thinking about and what the studies say, so, keep that in mind.
Also, for the sake of thot experiment, stipulate the 10/80 result and the 35% (or 50% it doesn’t matter) estimate is correct. Now consider the hypothetical overlap of these two groups. This would, Ceteris paribus, 3.5-5% of the pop are super spreaders & asymptomatic.
But it could be more or less. For example, asymptomatic people could be more likely to be super spreaders bc of more contact, while symptomatic people are treated, quarantined & avoided, but that as a portion of contacts, the symptomatic spread it more frequently.
Also consider, again, hypothetical the case where the super spreaders and the asymptomatic highly overlap, such that most or all of those 10% lie in the 35-50%, This shows how critical contacting tracing, testing & social quarantine would be.
In theory, if there were a way to determine who would be a super spreader, then even a small period of time where they and at risk people were quarantined could vastly reduce deaths, but if they’re asymptomatic this is much harder w/o a massive test & tracing effort.
Okay speculation over, back to studies.
I wanted to get this book but below is a CDC pandemic guide from a few years ago, that’s really interesting & telling https://twitter.com/yungneocon/status/1245849769286578178?s=21">https://twitter.com/yungneoco... https://twitter.com/yungneocon/status/1245849769286578178">https://twitter.com/yungneoco...
I linked to the top of this thread above. It contains survey data on social distancing and deaths from other causes, but much of it is probably already dated. Anyway here’s a cool paper on the issues in modeling covid https://twitter.com/yungneocon/status/1242227121117974534?s=21">https://twitter.com/yungneoco... https://twitter.com/yungneocon/status/1242227121117974534">https://twitter.com/yungneoco...

 Read on Twitter