1/ It& #39;s been a while since I did one of these: a thread of charts and data on the real-time economic impact of COVID-19, from @Quandl and other sources.
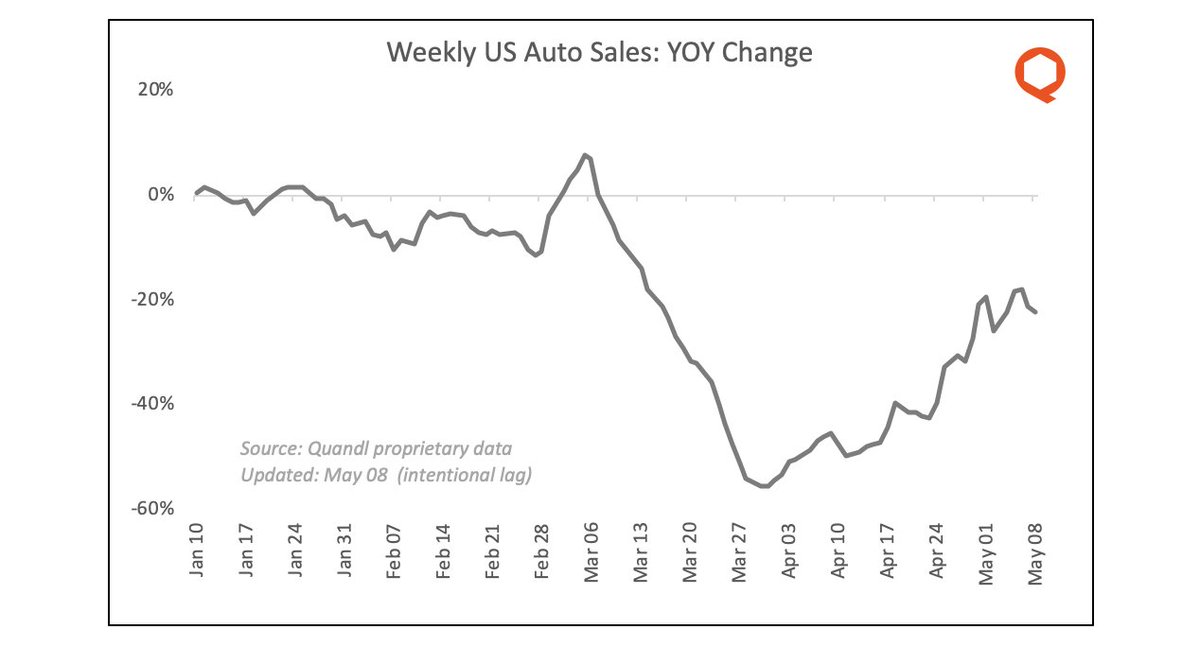
2/ Let& #39;s begin with US car purchases. Daily sales data (inferred from daily insurance policy sales) shows a definite rebound from the lows of early April.
3/ Cars are interesting because they& #39;re both a luxury and a necessity; they reflect economic activity as well as consumer confidence. Daily sales are noisy, driven by discounts, and still running ~20% lower than 2019, but the trend is encouraging.
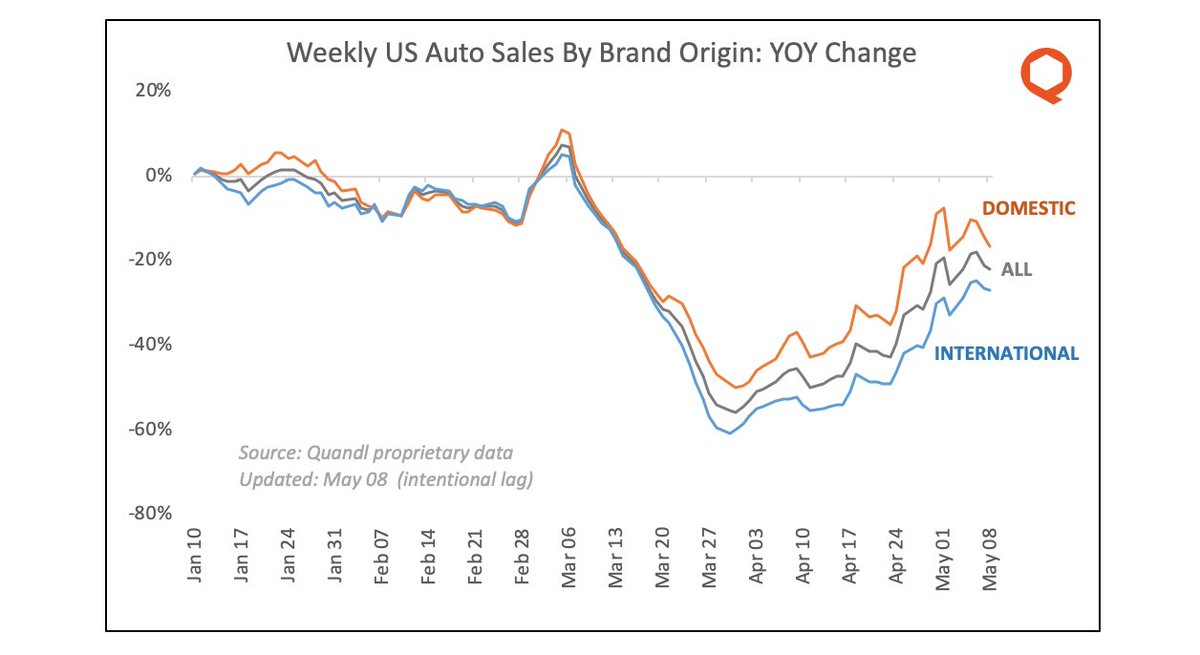
4/ Domestic brands continue to outsell international ones; I have several hypotheses as to why, but they& #39;re mostly speculative.
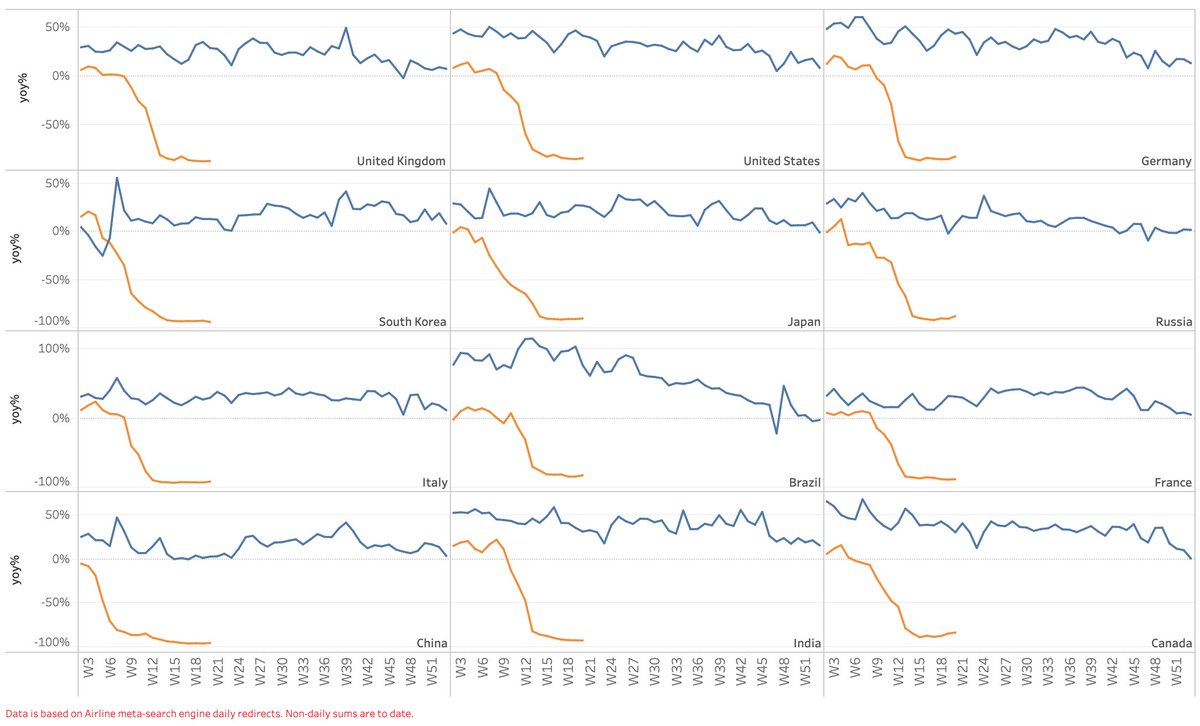
5/ Another indicator that reflects economic activity as well as consumer confidence is air travel (business and vacation, respectively). Revenue-passenger-kms remain depressed globally, as seen below (blue is 2019, orange is 2020).
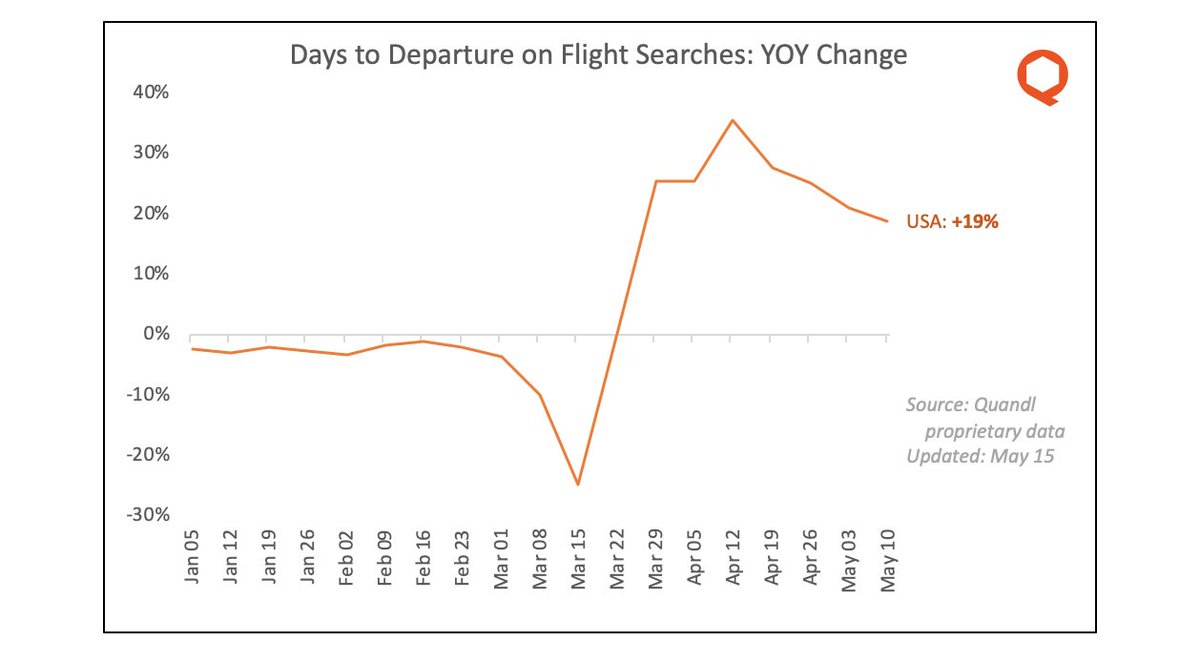
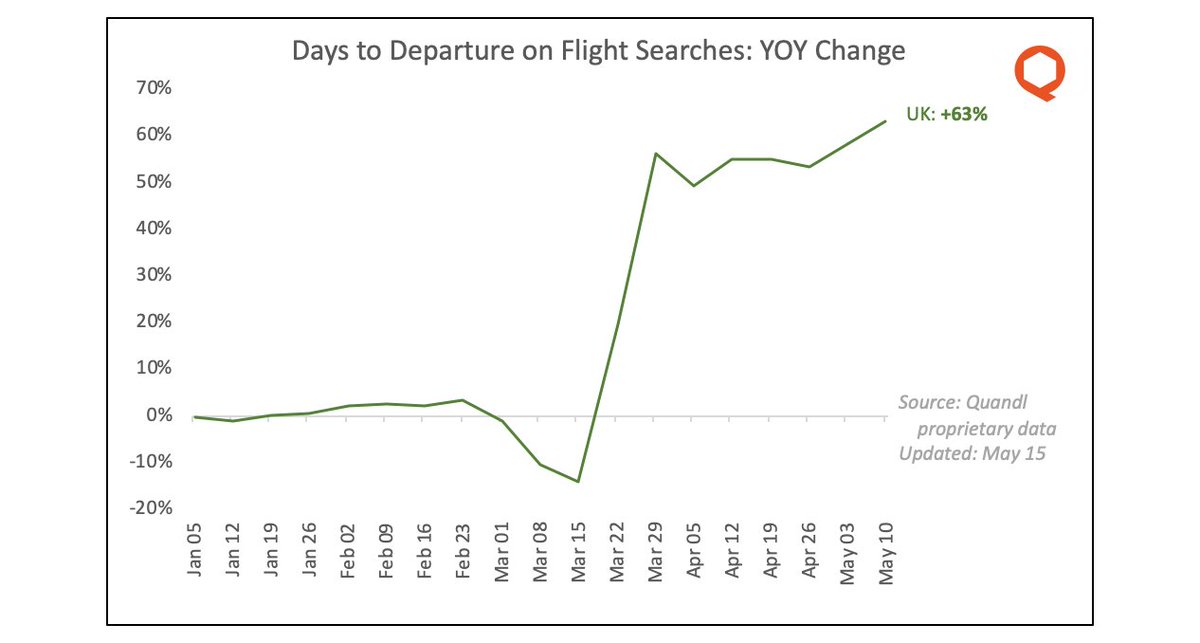
6/ But search activity tells an interesting forward-looking story. Consider "days to departure": how far in the future are people booking (or even looking for) tickets?
7/ US Days to Departure plummeted in early March (relative to 2019) as passengers rushed to complete trips and return home. DtD then rose in April as they postponed travel plans. But in recent weeks DtD has been declining again: a sign of a return to normalcy?
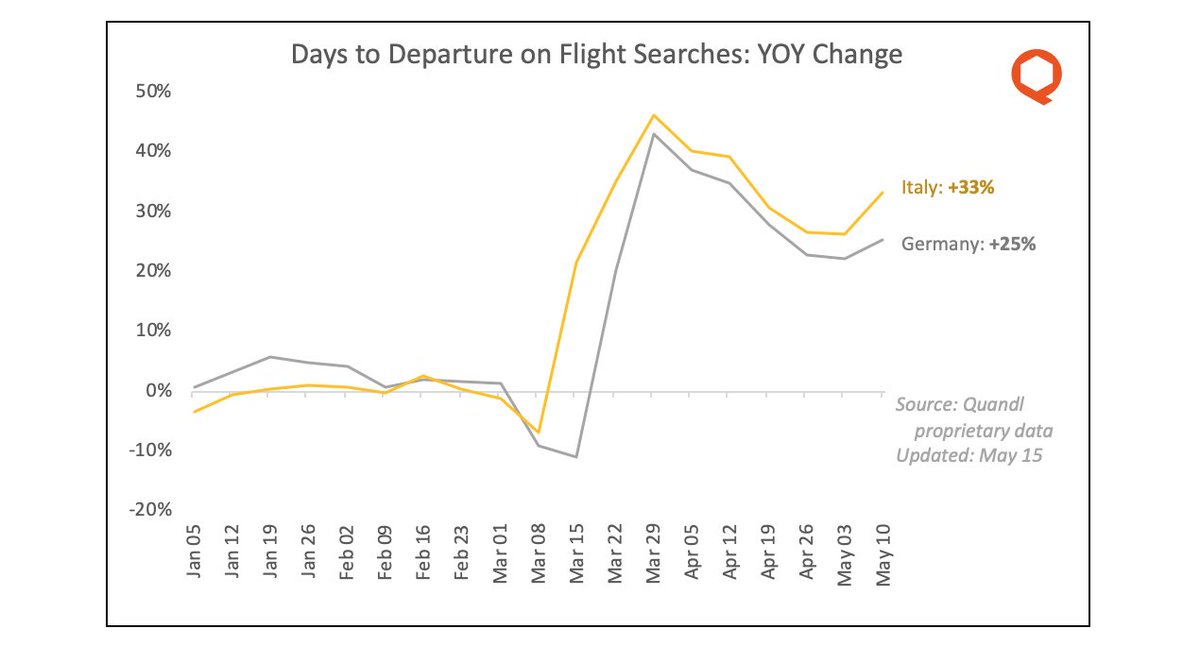
8/ But data from other countries is less encouraging. After declining through much of April, the average "days to departure" for airline searches has begun to increase in both Italy and Germany.
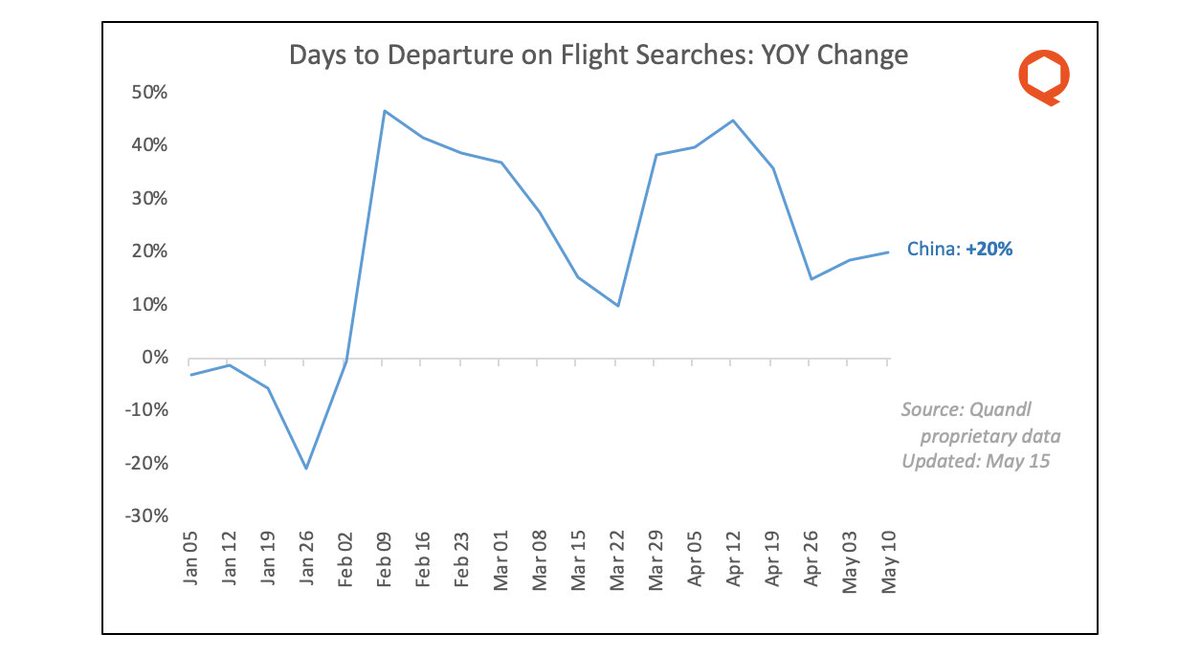
10/ China is perhaps the most interesting. As in other countries, days to departure dropped, increased, and declined again. But since then it& #39;s been oscillating, perhaps reflecting waves of confidence and uncertainty.
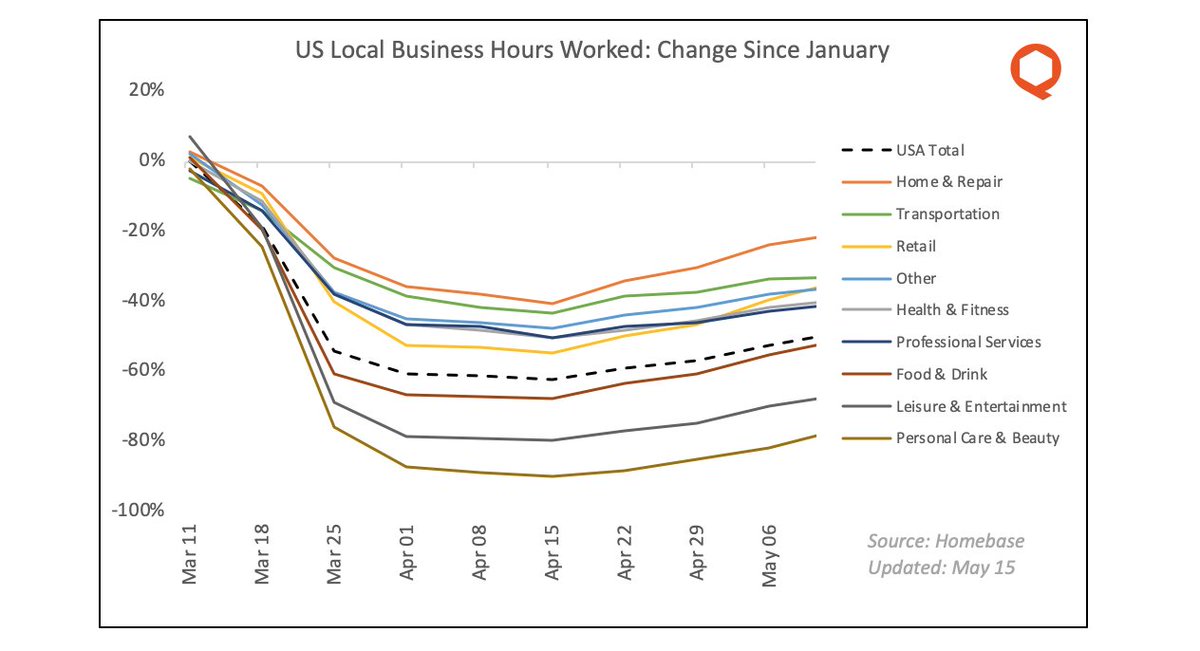
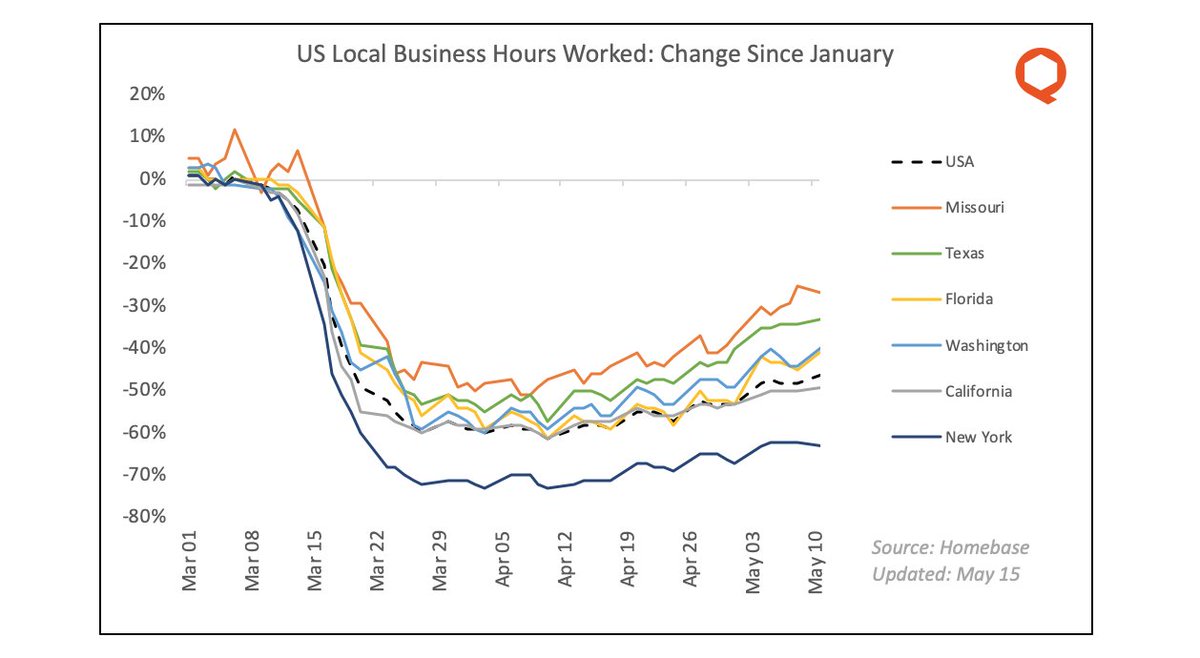
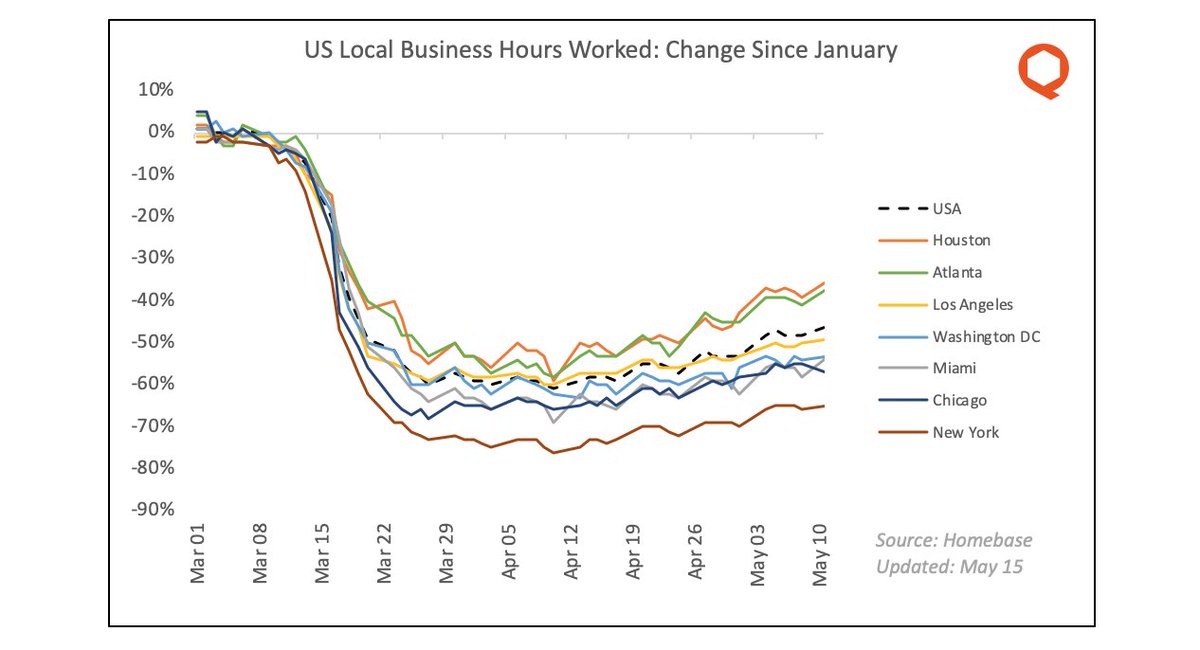
11/ What& #39;s driving confidence in the US? One answer is small business payrolls. After a sharp drop in March, hours worked has recovered for every single category of small business, as data from Homebase shows.
12/ The increase in small-business hours worked is nation-wide, though there& #39;s still a lot of state-level variance.
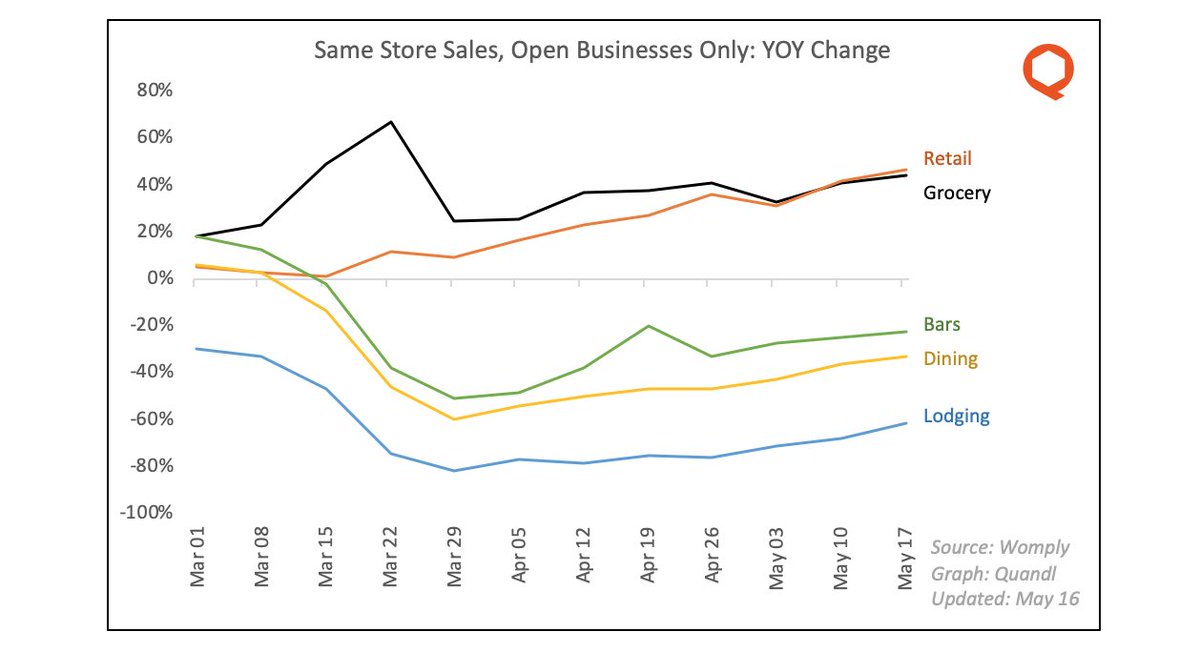
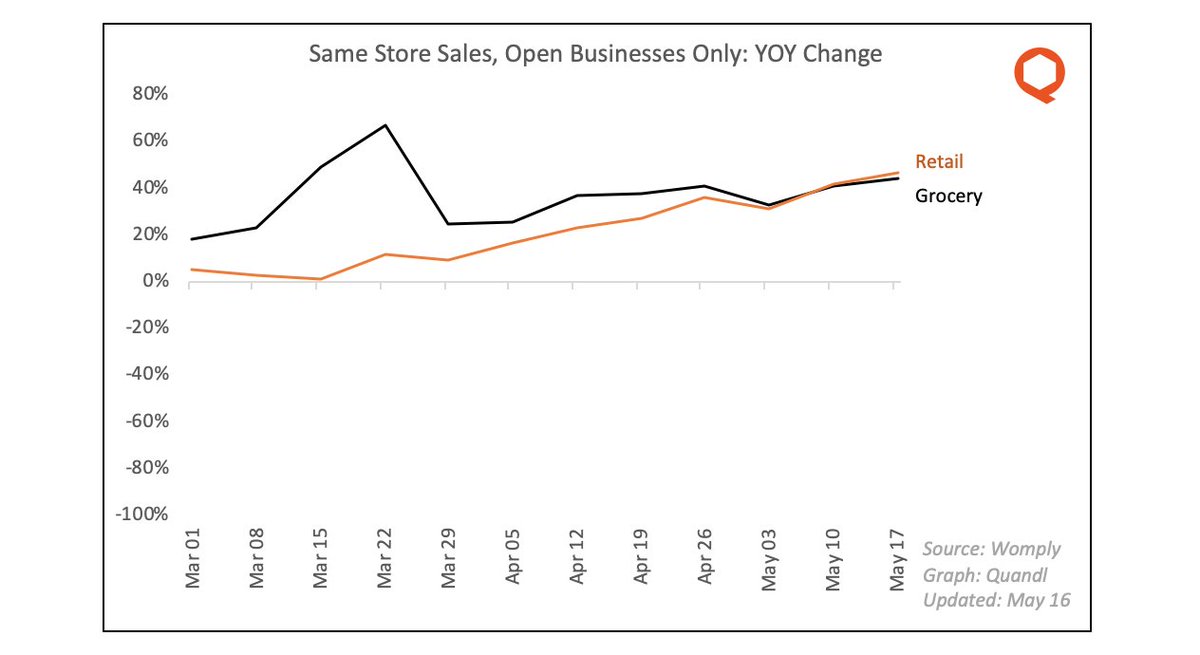
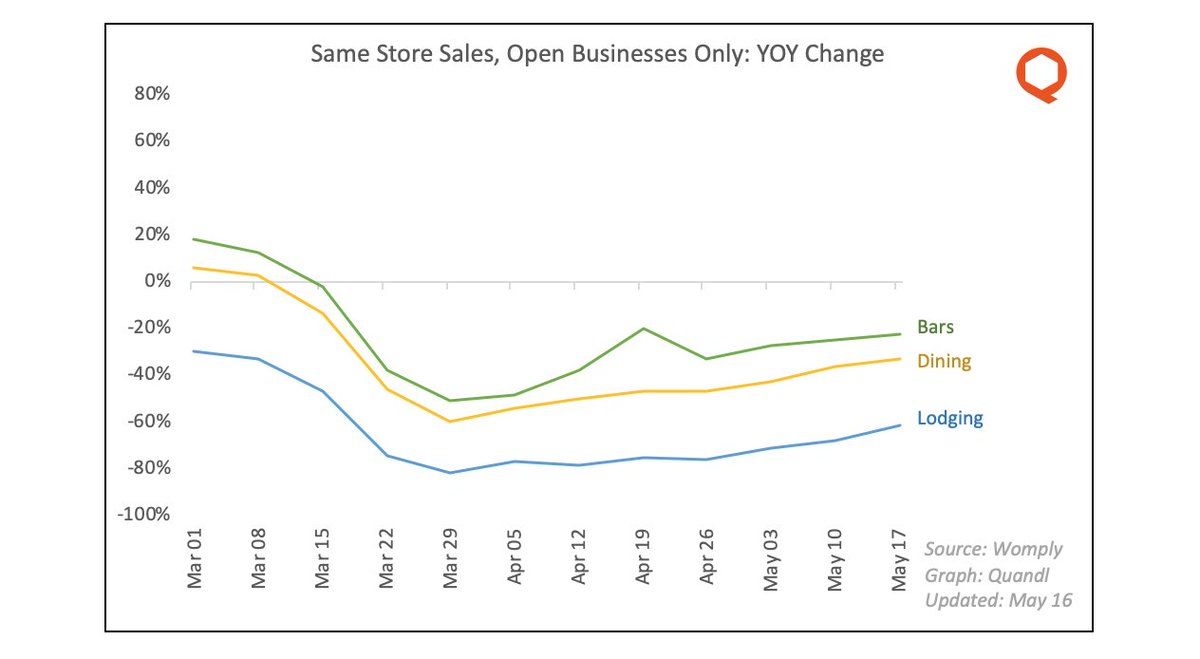
14/ How about the other side of the small business equation -- revenue? Transaction data from Womply shows that same-store sales for local businesses is beginning to recover for every category of firm.
15/ Grocery store revenues have stayed elevated even after the end of pantry-stocking in March. Other (non-grocery) retailers that remain open are also doing well.
16/ Meanwhile, businesses directly affected by the pandemic and by lockdowns -- bars, restaurants, lodging -- have all seen modest recoveries in revenue.
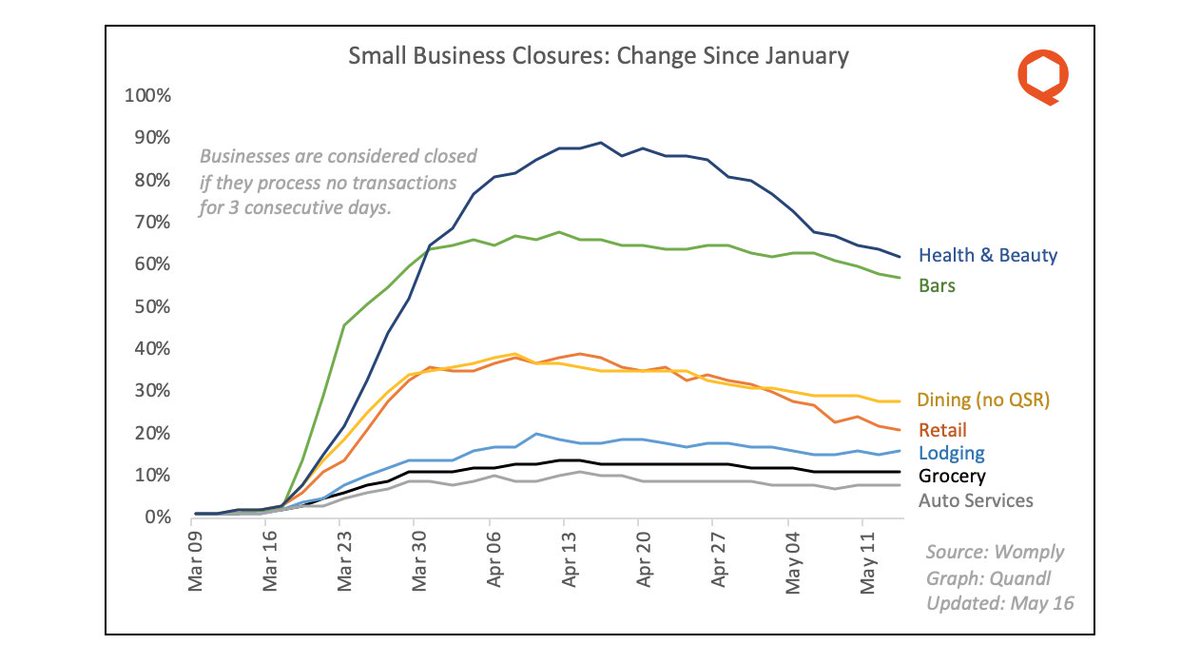
17/ However, there is a *huge* caveat to all these same-store sales charts, and that is that they only capture revenue for stores that remain open. Many stores have closed.
18/ The same Womply dataset of same-store sales also tracks business closures. After a huge wave of closures in late March and early April, many local businesses are cautiously reopening.
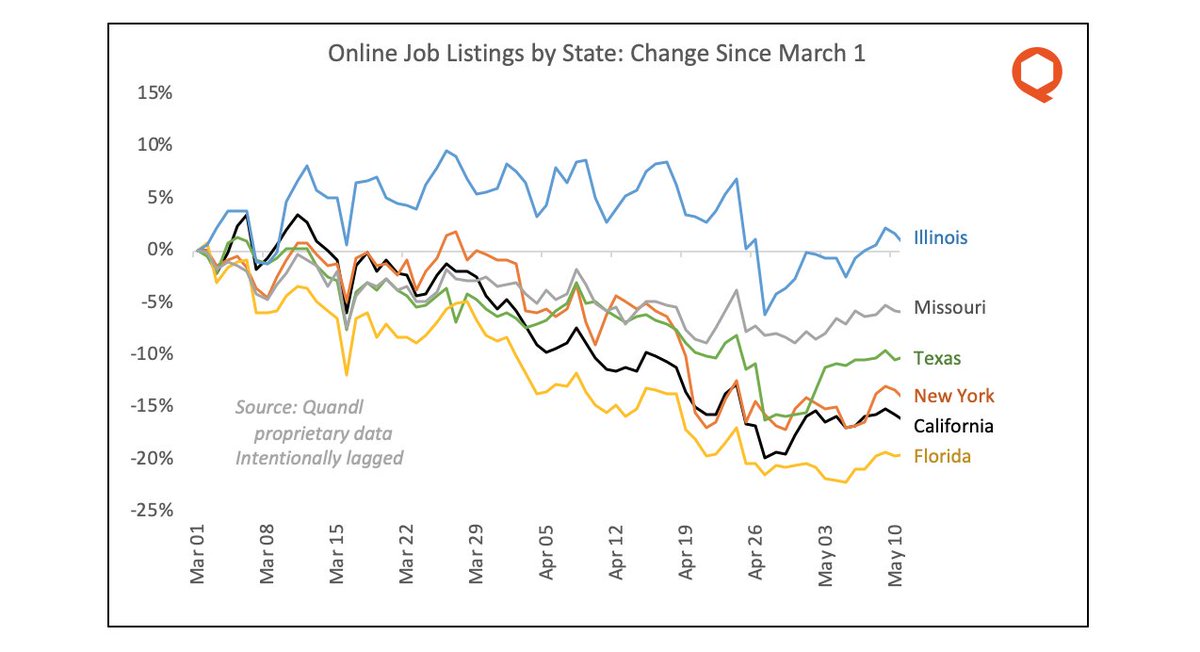
19/ That& #39;s small business. What about big business? Online job postings from firms in the S&P 500 have finally started to recover in recent days, though once again the recovery is not evenly distributed.
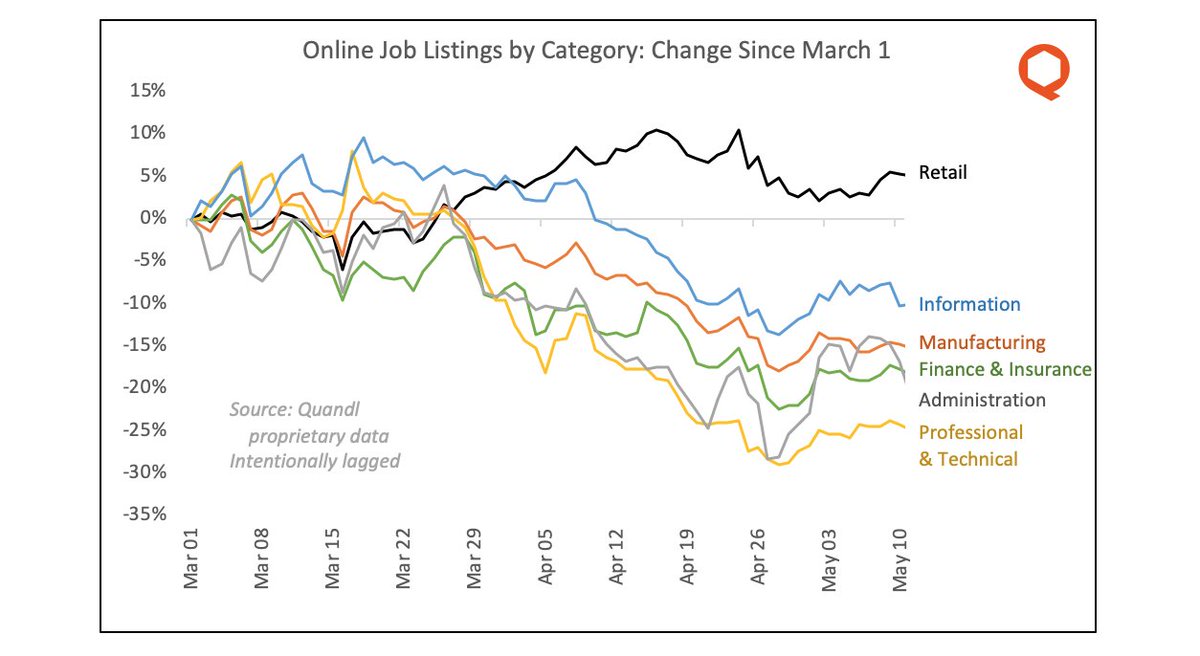
20/ The variance in job listings is even more pronounced if you slice by type of job instead of by location. Retail hiring remains strong; other job categories, not so much.
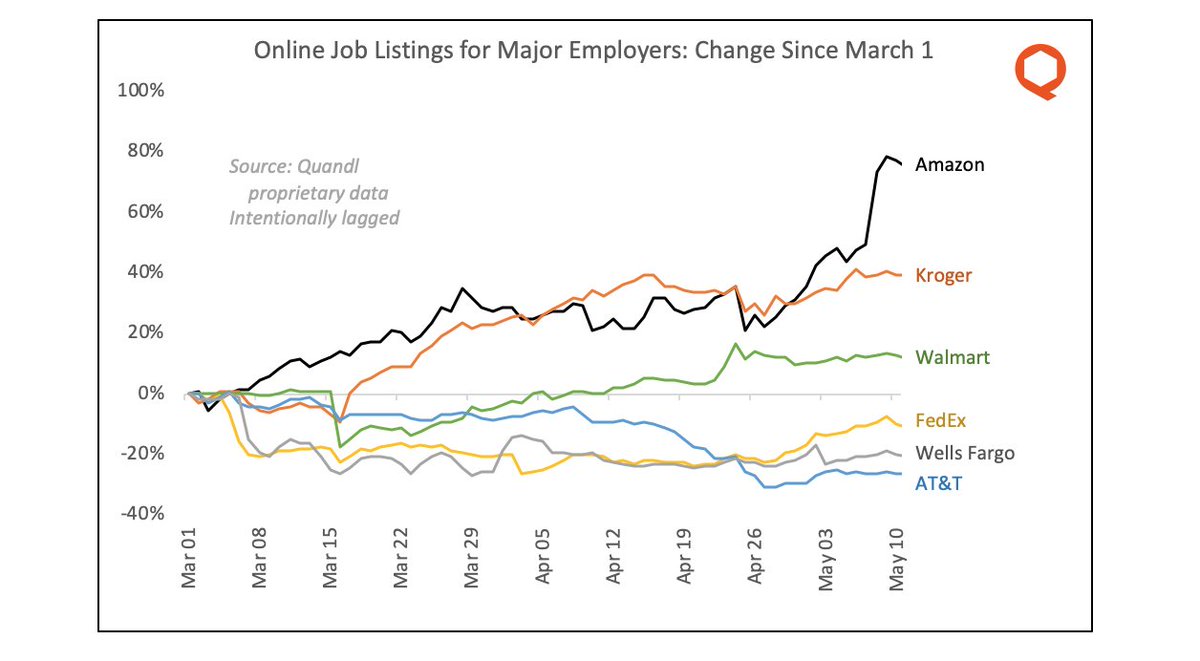
21/ Nothing shows this divergence so clearly as job postings for individual companies. For example, AT&T, Wells Fargo and FedEx are all cautious; Kroger and Walmart are hiring steadily; and Amazon is almost off the charts.
22/ (In addition to being a representative sample across industries, these are some of the largest employers in the country, so this divergence is reflective of fairly big sectoral and structural shifts.)
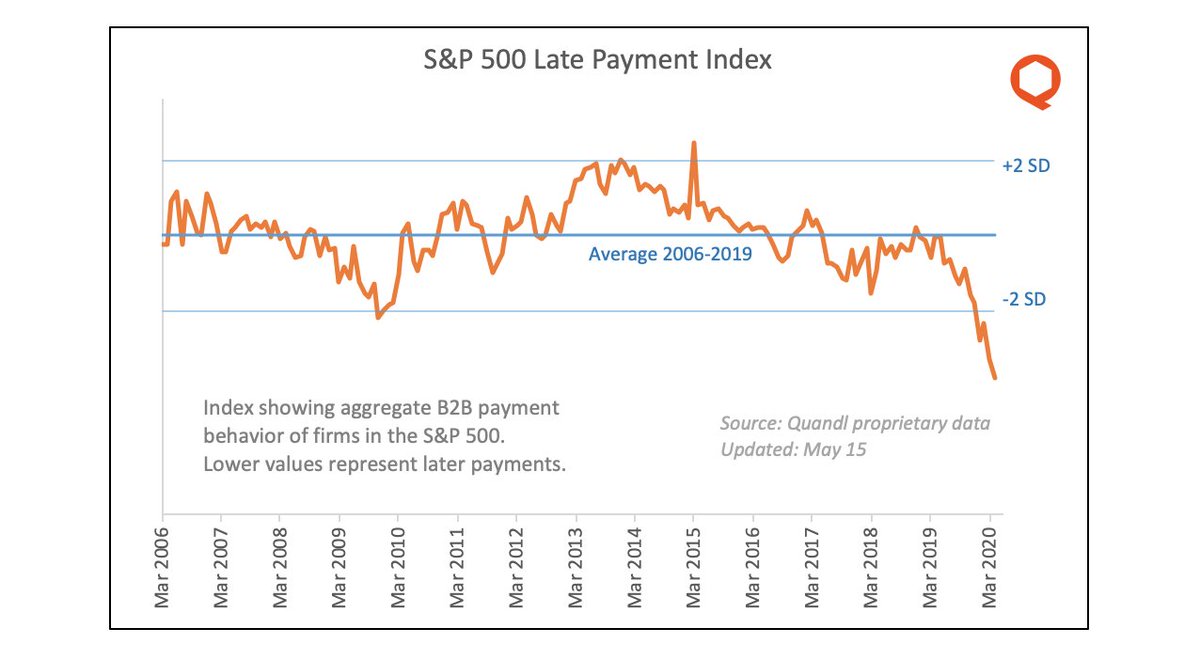
23/ A more subtle indicator of big business psychology is how they& #39;re managing their cash. Firms in the S&P 500 have become markedly more conservative, slow-paying suppliers to an unprecedented degree (4 standard deviations from the norm!)
(taking a break; to be continued)

 Read on Twitter