one of the checks on COV is all cause deaths. if it were killing an unusually large number of people, you& #39;d see it spike.
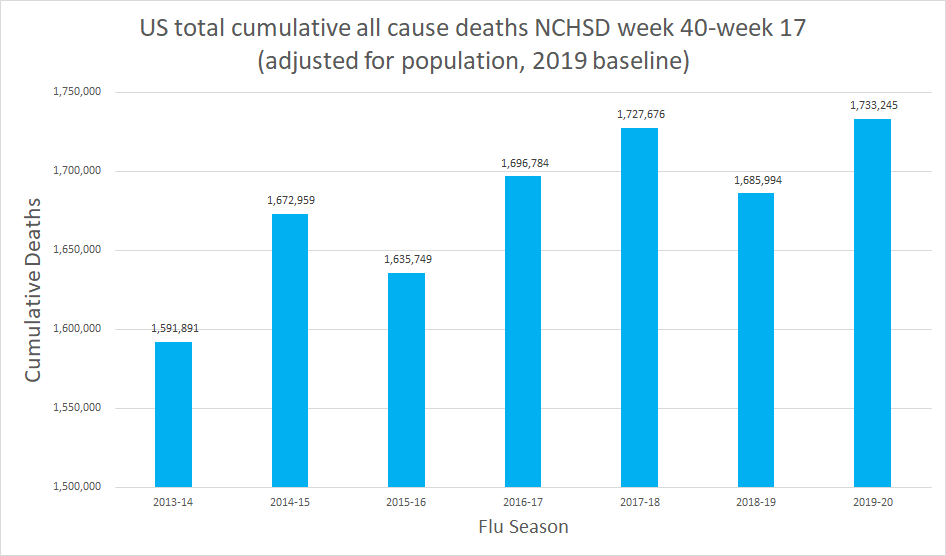
i pulled data from NCHSD through wk 17 (end apr)
i then adjusted it for US population.
here& #39;s what we get:
pop adj deaths are 0.32% higher than 2017-18
i pulled data from NCHSD through wk 17 (end apr)
i then adjusted it for US population.
here& #39;s what we get:
pop adj deaths are 0.32% higher than 2017-18
this is a striking figure. we& #39;re probably within the margin of error vs the flu 2 years ago
2017-18 was a baddish flu, but not a really bad one
and we certainly did not shut down the world over it
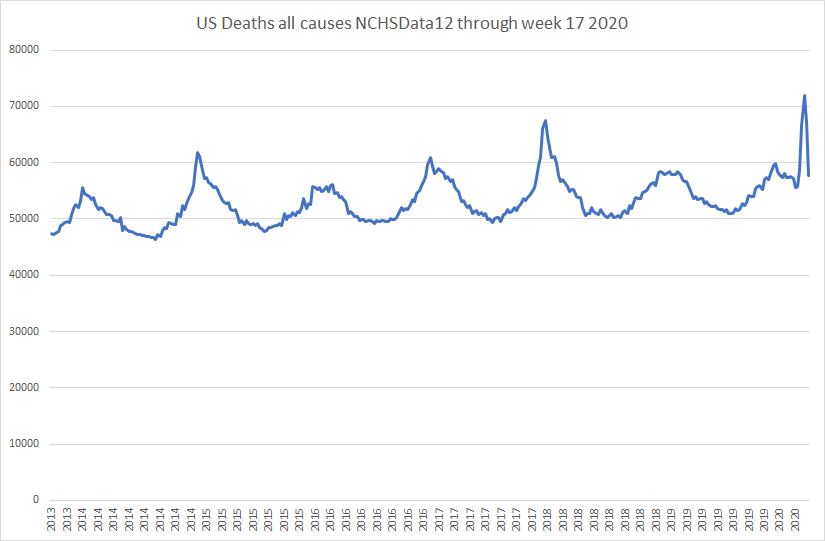
the shape of the curve is odd
it was a very mild year, then a sharp spike
2017-18 was a baddish flu, but not a really bad one
and we certainly did not shut down the world over it
the shape of the curve is odd
it was a very mild year, then a sharp spike
that first chart is basically the comparison of area under curve for a flu season in the second (which can be really difficult to eyeball), then adj for population (which chart 2 is not)
we had significantly negative cumulative excess deaths through about wk 10 of the year
we had significantly negative cumulative excess deaths through about wk 10 of the year
then it caught up in a big hurry.
this may have implications for covid IFR.
if a large number of people outlived their life expectancy, that means there was a large cohort of the vulnerable available for covid to target.
this would make IFR look higher.
this may have implications for covid IFR.
if a large number of people outlived their life expectancy, that means there was a large cohort of the vulnerable available for covid to target.
this would make IFR look higher.
had this happened in march 2018, there would have been a very small cohort. IFR might drop by 50-75%.
the start state matters. this is also why you NEED to measure deaths from week 40-39.
flu season peaks around jan 1.
H2 flu season is not an independent variable from H1.
the start state matters. this is also why you NEED to measure deaths from week 40-39.
flu season peaks around jan 1.
H2 flu season is not an independent variable from H1.
this has led to a lot of misleading takes using calendar year that makes the mild H1 of 2019-20 flu season fall into a different year than the catch up that it set up.
this can lead to misleading results.
be very critical of any study using calendar year.
this can lead to misleading results.
be very critical of any study using calendar year.
a check on this "catch up" theory is that the disease would disproportionately affect the old.
and it does.
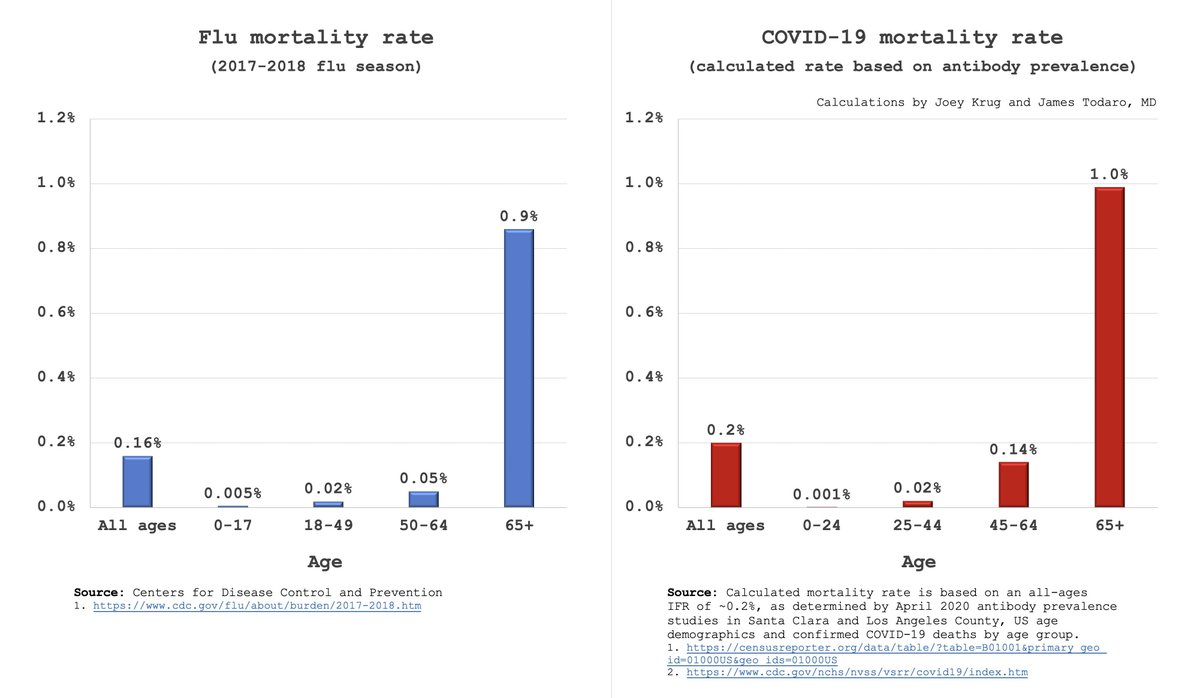
covid is no more deadly that a solid flu if you are under 45.
it& #39;s actually MUCH less deadly if you are under 24.
this seems to fit the "catchup" hypothesis.
and it does.
covid is no more deadly that a solid flu if you are under 45.
it& #39;s actually MUCH less deadly if you are under 24.
this seems to fit the "catchup" hypothesis.
we see this same effect in sweden. https://twitter.com/HaraldofW/status/1263838255176450051?s=20">https://twitter.com/HaraldofW...
and also in the US states. https://twitter.com/kerpen/status/1262783822925647872?s=20">https://twitter.com/kerpen/st...
even the CDC is now taking the IFR of covid down into the 0.26 range, and that& #39;s using 35% asymptomatic, which almost certainly too low.
the real figure is probably 50%.
that would make IFR 0.2% exactly in line with @JamesTodaroMD s estimates.
the real figure is probably 50%.
that would make IFR 0.2% exactly in line with @JamesTodaroMD s estimates.
this 0.2% compares to 0.16% for the flu of 2018-19. it means we& #39;re really not far off.
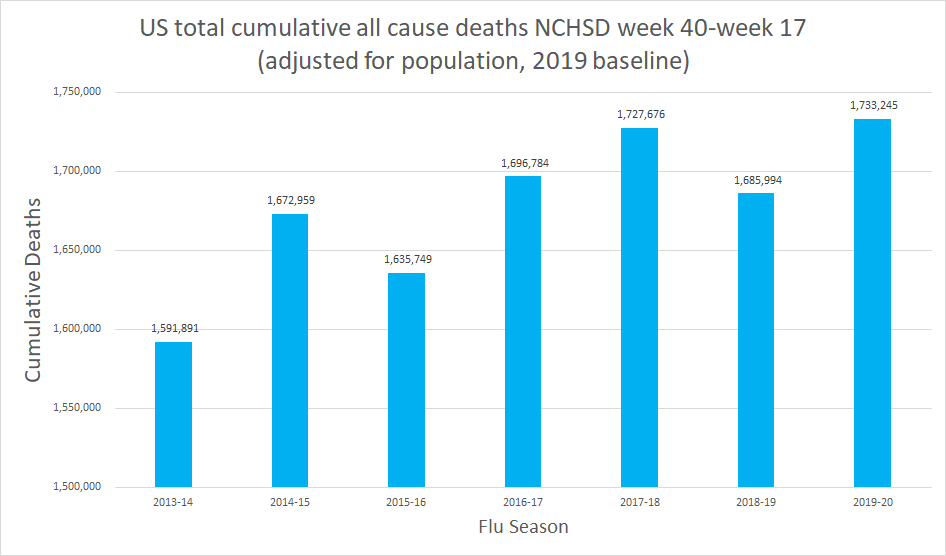
and that takes us full circle to this data where we see deaths 0.32% higher than 2017-18, a number that foots well with that difference in severity.
looks like it really was "the flu, bro"
and that takes us full circle to this data where we see deaths 0.32% higher than 2017-18, a number that foots well with that difference in severity.
looks like it really was "the flu, bro"

 Read on Twitter


