One of the things I love about my job is that I learn so many new things with every story. That was particularly true in my reporting for this story about #covid19 clusters and susperspreading events. Read it here and/or bear with me for a thread... https://www.sciencemag.org/news/2020/05/why-do-some-covid-19-patients-infect-many-others-whereas-most-don-t-spread-virus-all">https://www.sciencemag.org/news/2020...
By now, most people are probably familiar with the reproduction number R. R=3 means that on average every infected person in turn infects three others. But the emphasis here should be on “average”!
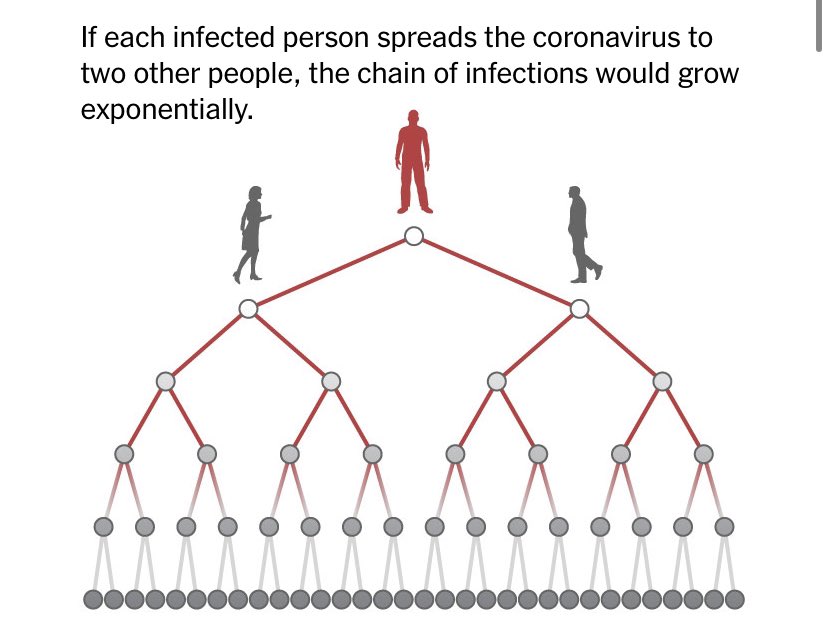
There are many illustrations out there (like this one from @nytimes illustrating R=2) that do a good job of showing how fast a disease spreads because infections grow exponentially. But they completely misrepresent what actually happens in real life.
In reality, some people infect a lot of people and others infect no-one. In fact - and this still blows my mind - in the datasets for every disease he looked at @jlloydsmith told me, most people do not spread the disease.
How uneven the distribution of spread is differs from pathogen to pathogen. Some diseases cluster more than others. And here is the important part: Coronaviruses like Sars and Mers are champions of clustering. Their spread is particulary “patchy”.
Scientists describe this with a measure called the dispersion factor k. Basically, the lower k is the more transmission comes from a small number of people. (The k of the 1918 flu pandemic has been estimated to be around 1, for example.)
In his 2005 Nature paper which keeps coming up in very conversation I have about this @jlloydsmith examined eight diseases: SARS had the lowest k: 0,16. It clusters the most. https://www.nature.com/articles/nature04153">https://www.nature.com/articles/...
Scientists don’t have a good handle yet on k for #SARSCoV2. But this paper by @AdamJKucharski estimates it could be as low as 0.1, “suggesting that 80% of secondary transmissions may have been caused by a small fraction of infectious individuals (~10%)” https://wellcomeopenresearch.org/articles/5-67 ">https://wellcomeopenresearch.org/articles/...
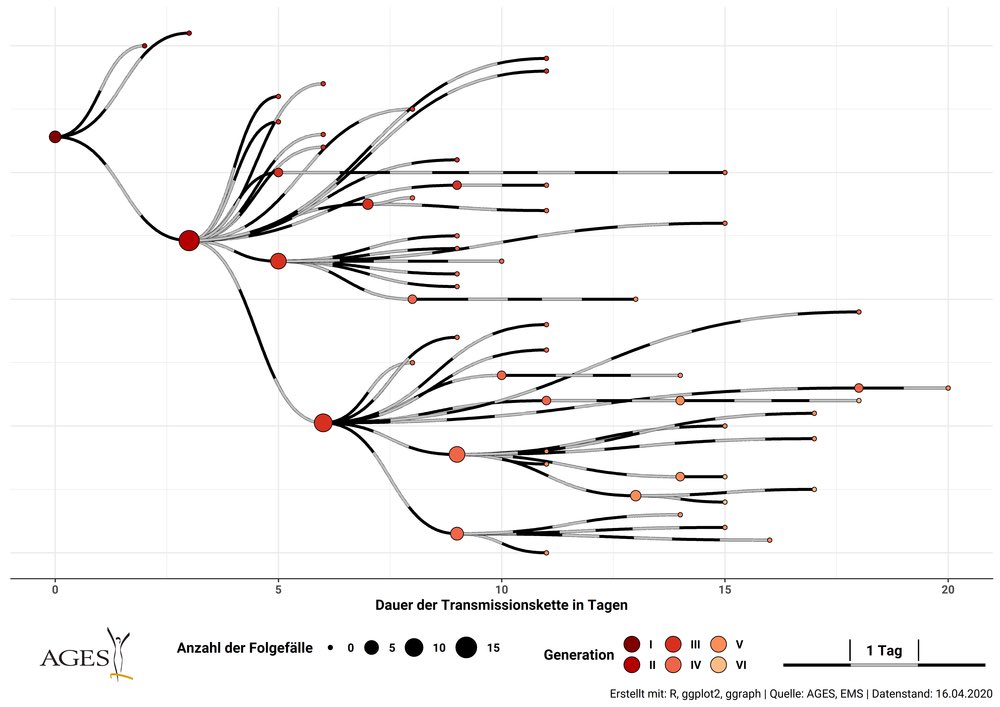
Whether it is that low or a bit higher, #covid19 clearly clusters a lot. Here is an example of what transmission of #sarscov2 actually looks like (from an investigation in Austria):
A low dispersion factor k might explain some features of this pandemic that I have struggled to understand, for instance, why the virus did not take off everywhere sooner after it emerged in China or that report of an early case in France.
If k is low, then most chains of infection die out by themselves. k=0.1 means the virus has to be introduced into a new country four times to have an even chance of establishing itself. (You can try that out for the k of SARS or MERS in this app: https://cmmid.github.io/visualisations/new-outbreak-probability)">https://cmmid.github.io/visualisa...
So basically: If the #SARSCoV2 epidemic in China was a big fire that sent sparks flying around the world, most of those sparks simply fizzled out. That probably bought some places more time.
I’ll write more about this tomorrow (late here in Berlin already), but one important point is what this means for controlling #covid19 spread. It suggests that two of the most effective parts of #PhysicalDistancing were stopping big gatherings and having people work from home.
For now, one last thought: The low k of pandemic coronaviruses may also explain a larger pattern I have struggled to understand: Why have we seen two huge, international outbreaks of coronaviruses in the last 20 years but not some smaller ones as well?
Think of humanity as just another country that a virus is introduced into. There may have been several spillovers of coronaviruses that did not lead to any wider spread because the infected people did not infect anyone else. The fire never really started.
Only when an early cluster helps the virus spread (say at a seafood market early on?) does the virus take off - and catch our attention. I put this idea to @jlloydsmith and he said: “Yes it might partly explain it.” At this point I’m happy to settle for partial explanations.

 Read on Twitter


