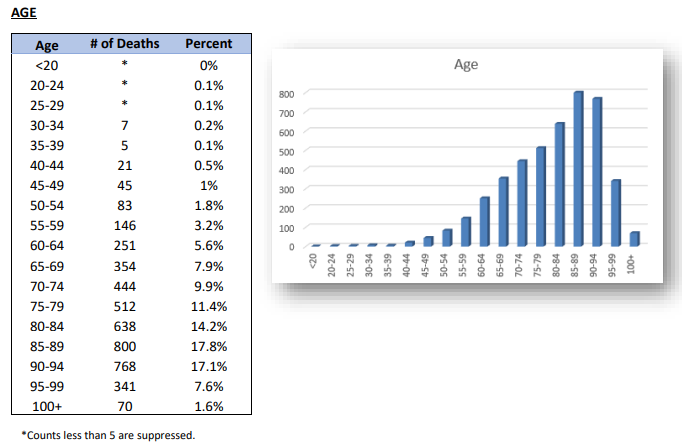
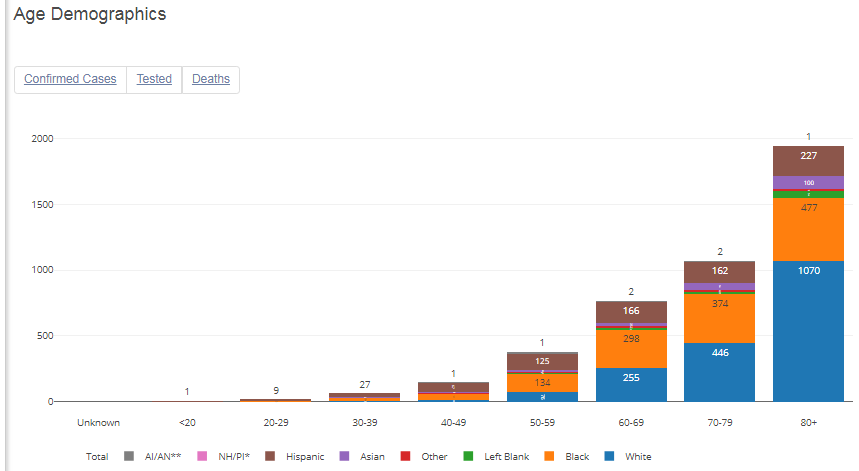
Pennsylvania has more COVID deaths over age 100 than under age 45.
More deaths over age 95 than under age 60.
More deaths over 85 than under 80.
https://www.health.pa.gov/topics/Documents/Diseases%20and%20Conditions/COVID-19%20Death%20Reports/Weekly%20Report%20of%20Deaths%20Attributed%20to%20COVID-19%20--%202020-05-17.pdf">https://www.health.pa.gov/topics/Do...
More deaths over age 95 than under age 60.
More deaths over 85 than under 80.
https://www.health.pa.gov/topics/Documents/Diseases%20and%20Conditions/COVID-19%20Death%20Reports/Weekly%20Report%20of%20Deaths%20Attributed%20to%20COVID-19%20--%202020-05-17.pdf">https://www.health.pa.gov/topics/Do...
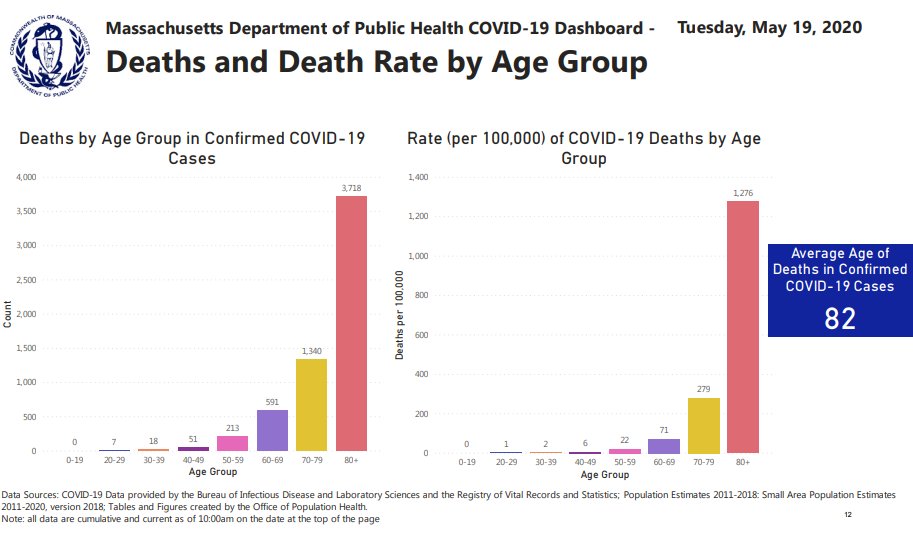
Massachusetts has 3,718 deaths age 80+ (62.6%) and just 2,220 under 80.
880 deaths under 70 (14.8%). More than four times as many deaths over 80 as under 70.
https://www.mass.gov/doc/covid-19-dashboard-may-19-2020/download">https://www.mass.gov/doc/covid...
880 deaths under 70 (14.8%). More than four times as many deaths over 80 as under 70.
https://www.mass.gov/doc/covid-19-dashboard-may-19-2020/download">https://www.mass.gov/doc/covid...
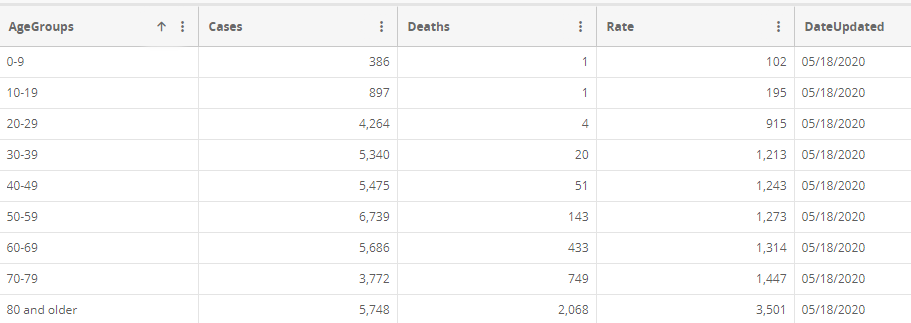
Connecticut has 2,068 COVID deaths age 80+ (59.6%), 1,447 age 79-80 (41.7%). and 653 under 70 (18.8%). More than three times as many over 80 as under 70. Just 220 (6.3%) under 60. Over nine times as many over 80 as under 60.
https://data.ct.gov/Health-and-Human-Services/COVID-19-confirmed-cases-and-deaths-by-age-group/ypz6-8qyf">https://data.ct.gov/Health-an...
https://data.ct.gov/Health-and-Human-Services/COVID-19-confirmed-cases-and-deaths-by-age-group/ypz6-8qyf">https://data.ct.gov/Health-an...
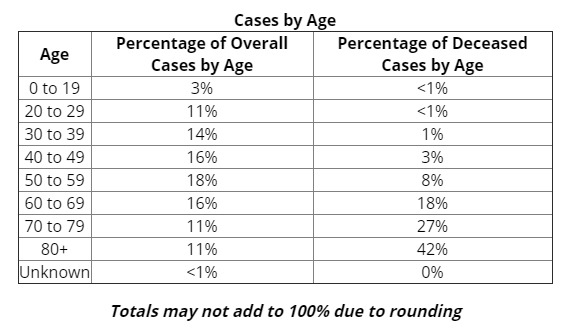
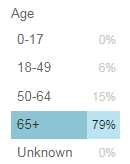
Only 22% of Michigan cases but 69% of Michigan deaths are 70+. Just 5% under 40. More than eight times as many Michigan COVID deaths over 80 as under 40.
https://www.michigan.gov/coronavirus/0,9753,7-406-98163_98173---,00.html">https://www.michigan.gov/coronavir...
https://www.michigan.gov/coronavirus/0,9753,7-406-98163_98173---,00.html">https://www.michigan.gov/coronavir...
Illinois COVID deaths age 80+ (1,960) more than three times as many as under 60 (605).
http://www.dph.illinois.gov/covid19/covid19-statistics">https://www.dph.illinois.gov/covid19/c...
http://www.dph.illinois.gov/covid19/covid19-statistics">https://www.dph.illinois.gov/covid19/c...
National CDC data only runs through May 9, but nursing home deaths have only accelerated since then.
They showed 32% of all COVID deaths nationally over age 85 and 59% over age 75. More deaths over age 85 (17,478) than under 65 (10,929).
They showed 32% of all COVID deaths nationally over age 85 and 59% over age 75. More deaths over age 85 (17,478) than under 65 (10,929).
I don& #39;t think the Democratic strategy of "save grandma by locking you in your house and sending infectious patients to her nursing home" worked.
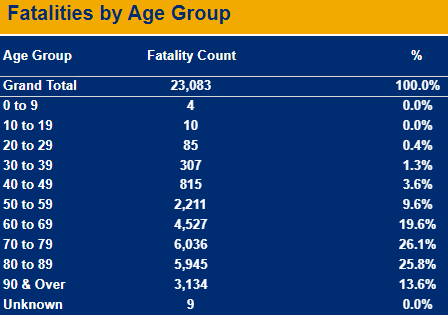
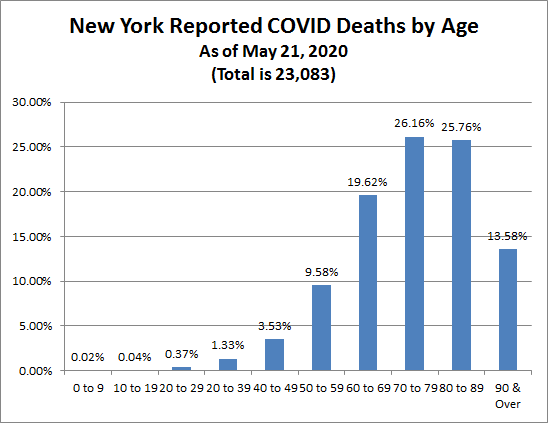
Here is the New York fatality data by age.
https://covid19tracker.health.ny.gov/views/NYS-COVID19-Tracker/NYSDOHCOVID-19Tracker-Fatalities?%3Aembed=yes&%3Atoolbar=no&%3Atabs=n">https://covid19tracker.health.ny.gov/views/NYS...
https://covid19tracker.health.ny.gov/views/NYS-COVID19-Tracker/NYSDOHCOVID-19Tracker-Fatalities?%3Aembed=yes&%3Atoolbar=no&%3Atabs=n">https://covid19tracker.health.ny.gov/views/NYS...

 Read on Twitter