$ETN
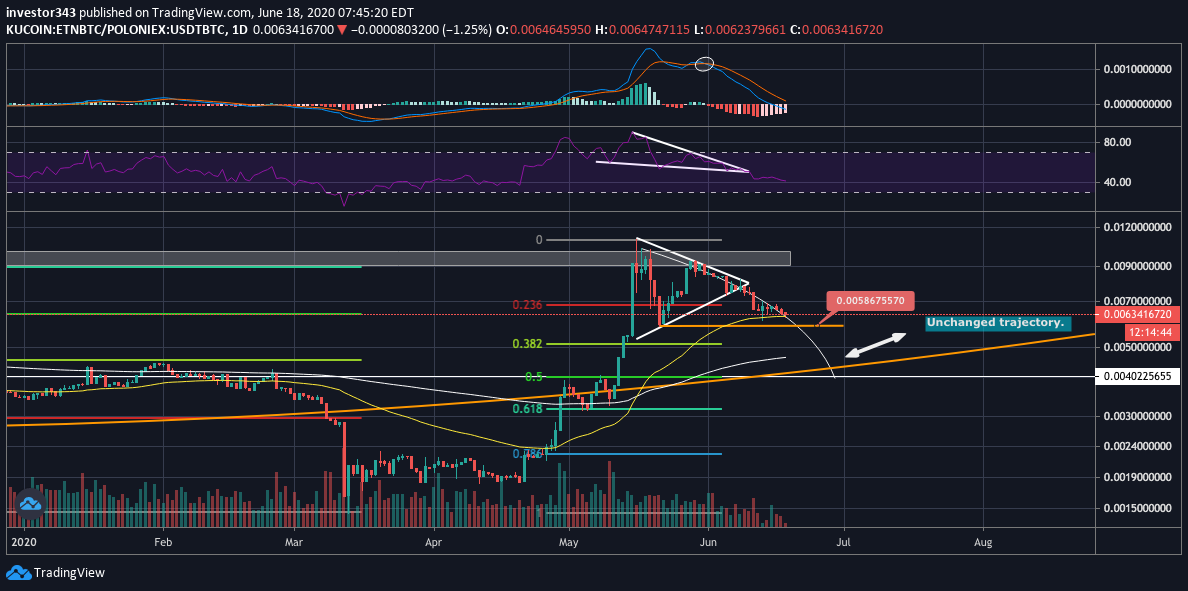
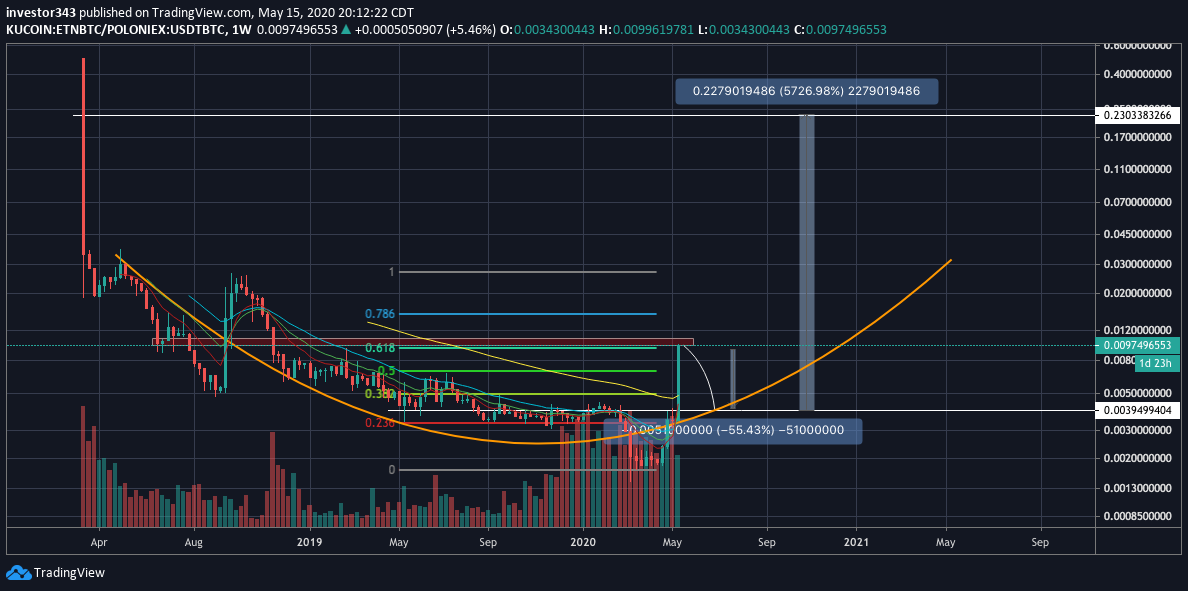
Technical Analysis on Electroneum given its explosive move.
With it having nearly a 7X rally I expect some sort of retracement soon. Daily RSI is over 90 and we at the golden ratio from local high. Target down is at $0.004. From there is a nice setup to 3 cents.
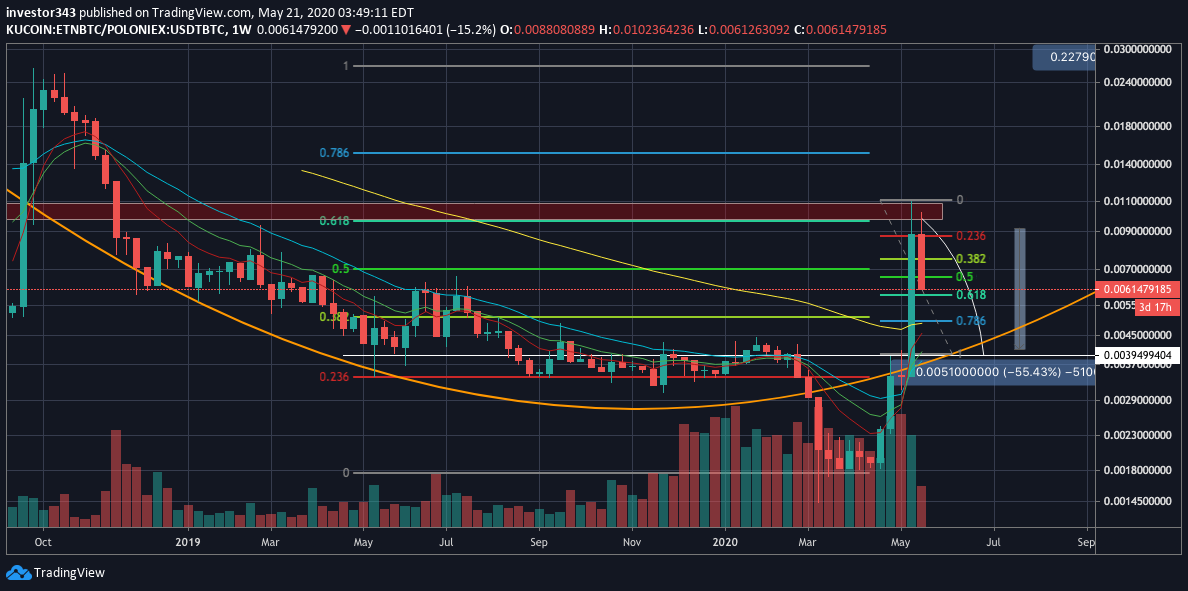
Technical Analysis on Electroneum given its explosive move.
With it having nearly a 7X rally I expect some sort of retracement soon. Daily RSI is over 90 and we at the golden ratio from local high. Target down is at $0.004. From there is a nice setup to 3 cents.
This is yet another one like DGB, signaling the return of the #altseason and next bitcoin bull run.
After this one retakes local high (possibly next year) then it& #39;s ATH is at 23 cents which is nearly a 60X gain from the down target. This would likely eventuate into 2022.
After this one retakes local high (possibly next year) then it& #39;s ATH is at 23 cents which is nearly a 60X gain from the down target. This would likely eventuate into 2022.
$ETN
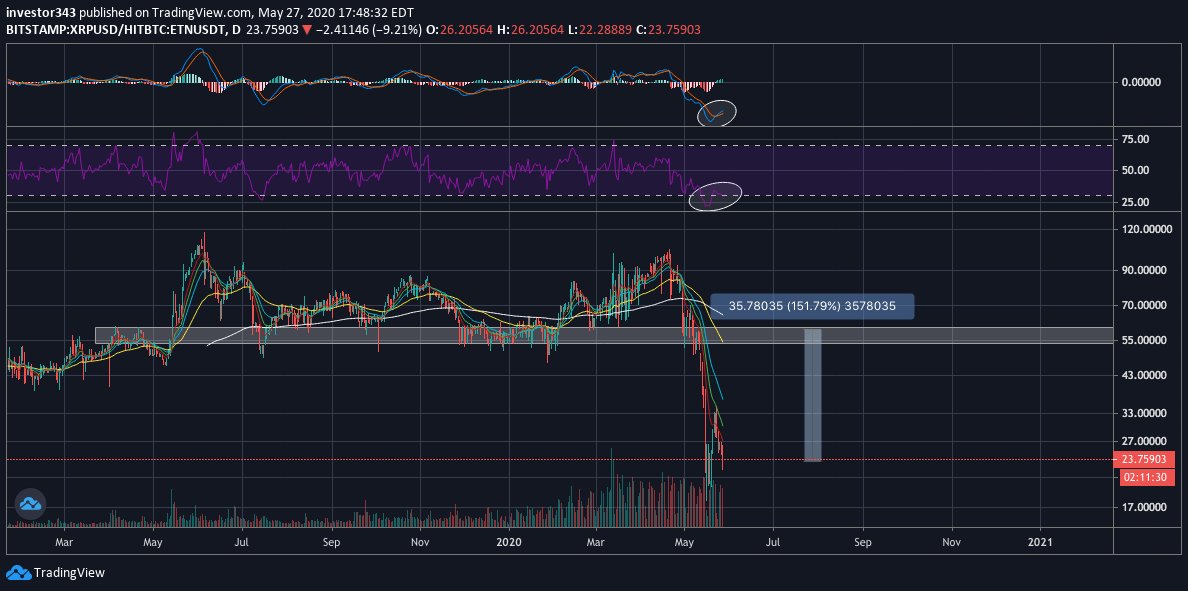
This is a trading strategy I use. Comparing one alt to another.
In TV you can use the / symbol to create this chart.
Comparing a mundane alt such as XRP to an overly bought one such as ETN, shows an extremely over sold chart. One where you could easily risk going into.
This is a trading strategy I use. Comparing one alt to another.
In TV you can use the / symbol to create this chart.
Comparing a mundane alt such as XRP to an overly bought one such as ETN, shows an extremely over sold chart. One where you could easily risk going into.
Now this doesn& #39;t mean that if this reaches equilibrium you will have over doubled your money; but instead potentially saved yourself from losing more.
Take this: if bitcoin goes down dragging ETN down 55% and XRP down 30% You& #39;d have 55% more ETN equivalent but be down 30% USD
Take this: if bitcoin goes down dragging ETN down 55% and XRP down 30% You& #39;d have 55% more ETN equivalent but be down 30% USD
This allows you to take profits on a move up while still maintaining a long term position for the next cycle and not selling out of crypto.
It also makes it easier to diversify into your top picks. Sell a portion of one that& #39;s high and buy the other low.
It also makes it easier to diversify into your top picks. Sell a portion of one that& #39;s high and buy the other low.
$ETN
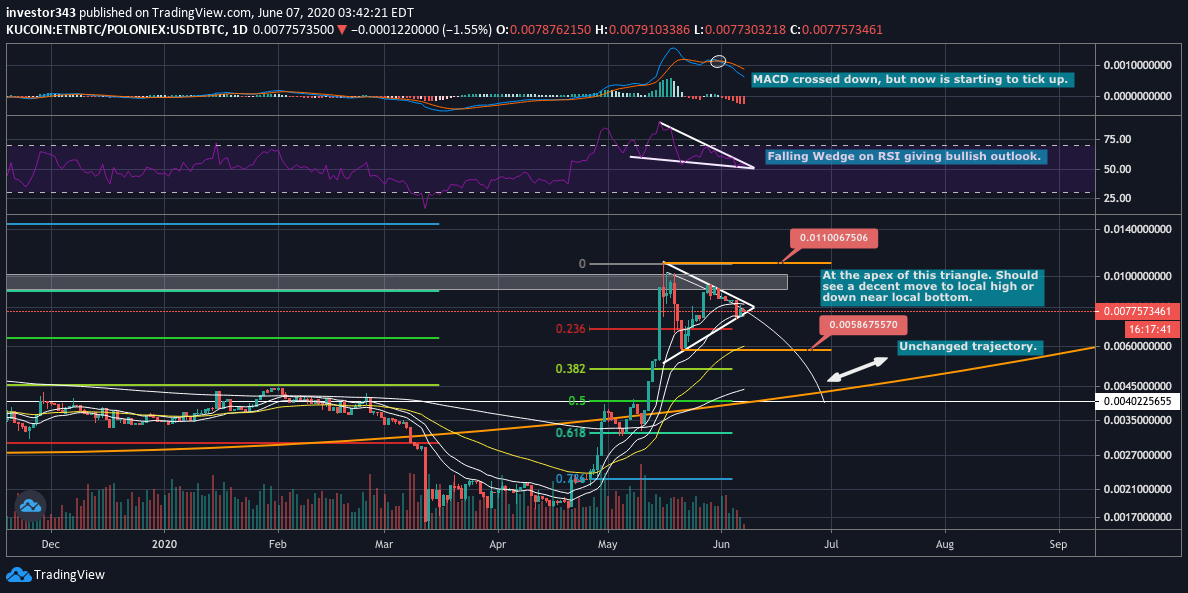
Looks like we will see a move soon https://abs.twimg.com/emoji/v2/... draggable="false" alt="👀" title="Augen" aria-label="Emoji: Augen">
Looks like we will see a move soon
$ETN
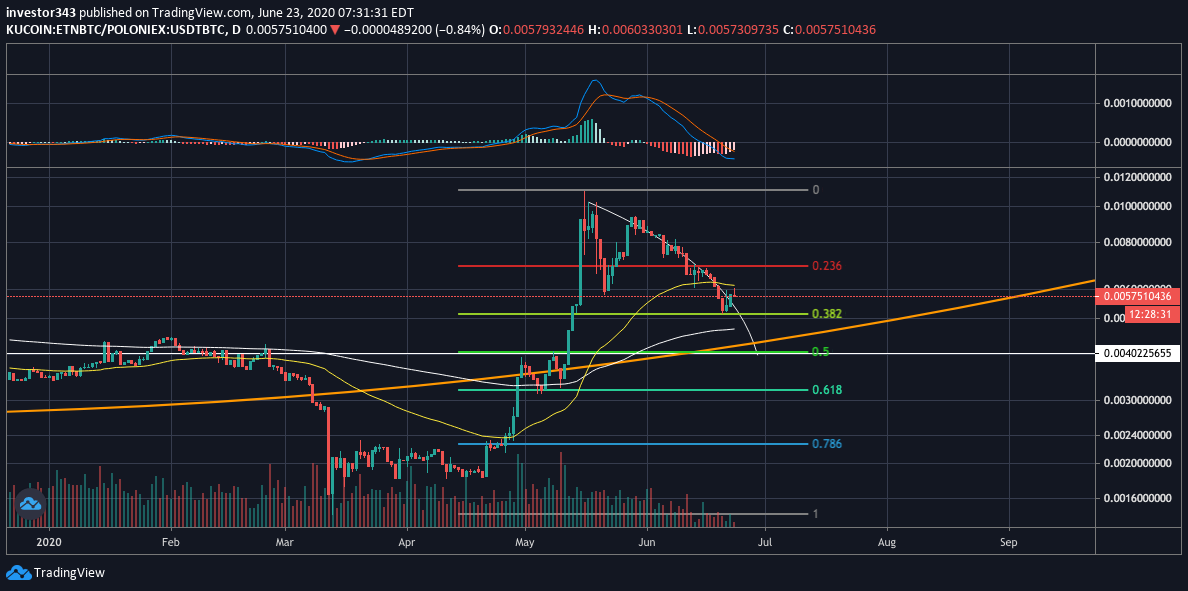
It& #39;s interesting how price has closely followed this curve drawn over a month ago. Will it continue to follow it down? We have already corrected 50% from the high and reached the first target at ~0.005.
It& #39;s interesting how price has closely followed this curve drawn over a month ago. Will it continue to follow it down? We have already corrected 50% from the high and reached the first target at ~0.005.
$ETN
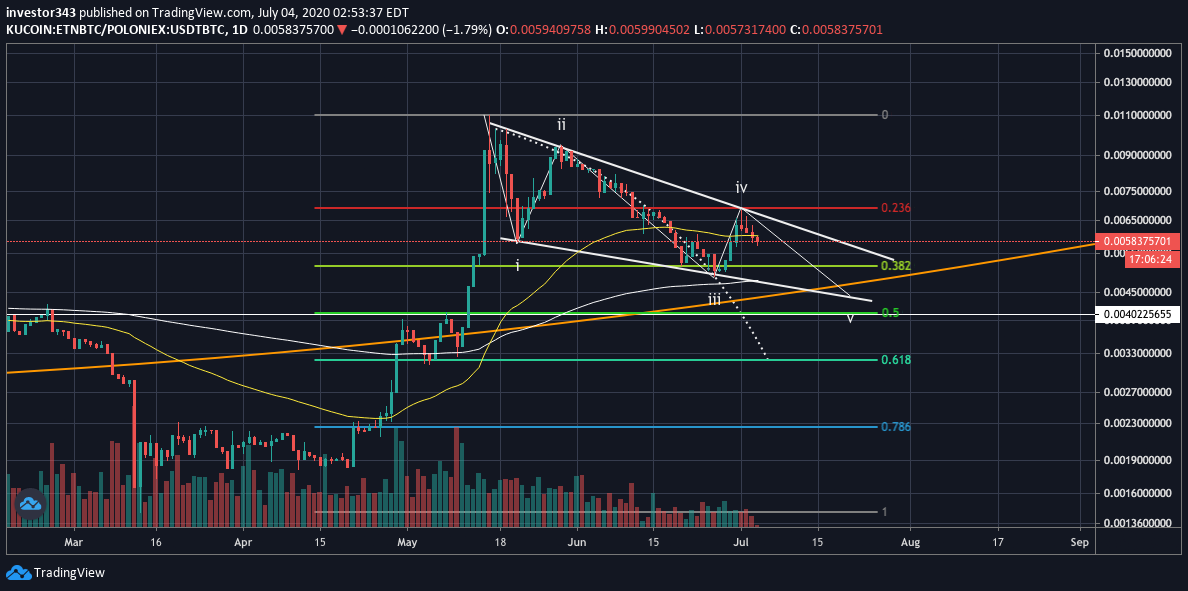
Price has diverged from Projection, as it was eventually going to do. It bounced heavily off the 0.382 and up to now established resistance at the 0.236 level. May very well see another move down to then test for a possible Flag Pattern breakout.
Price has diverged from Projection, as it was eventually going to do. It bounced heavily off the 0.382 and up to now established resistance at the 0.236 level. May very well see another move down to then test for a possible Flag Pattern breakout.
$ETN
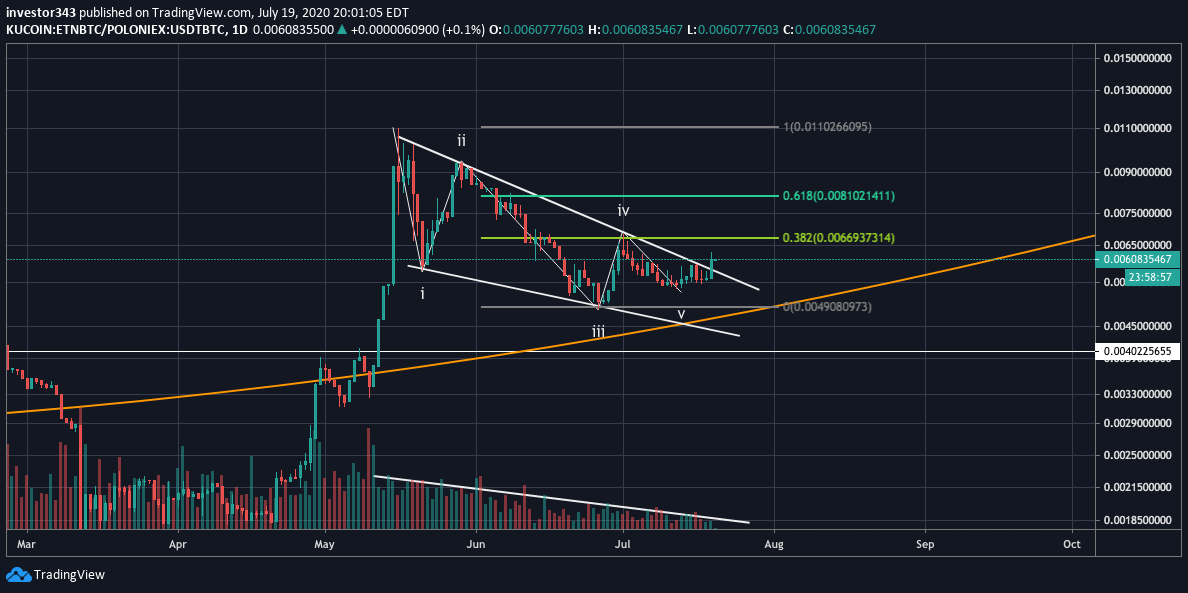
Price has broken out of the falling wedge but there is no volume to support it. Will it continue much higher?
FYI there are almost a million ways to draw EW. 5th wave could be truncate or it could simply be an ABC and start of 1 2.
Price has broken out of the falling wedge but there is no volume to support it. Will it continue much higher?
FYI there are almost a million ways to draw EW. 5th wave could be truncate or it could simply be an ABC and start of 1 2.
$ETN
Well some will say volume isn& #39;t a good indicator, in this case it predicted that down move perfectly.
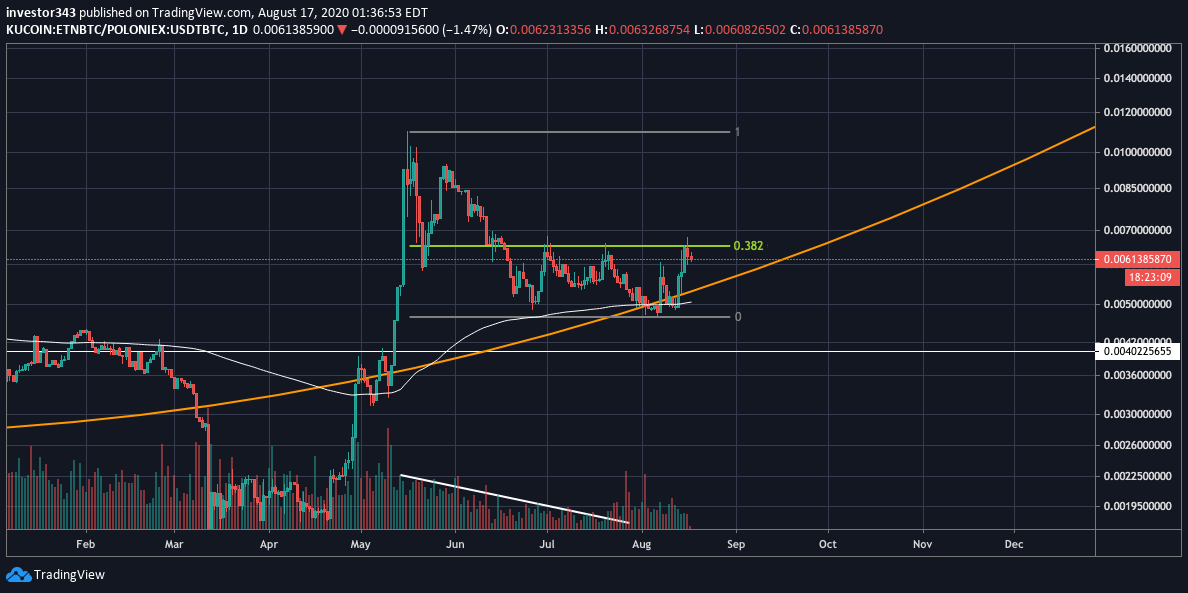
Anyways... ETN ranging with resistance at the 0.382 retracement level and support at the 200 daily ema.
Well some will say volume isn& #39;t a good indicator, in this case it predicted that down move perfectly.
Anyways... ETN ranging with resistance at the 0.382 retracement level and support at the 200 daily ema.
$ETN
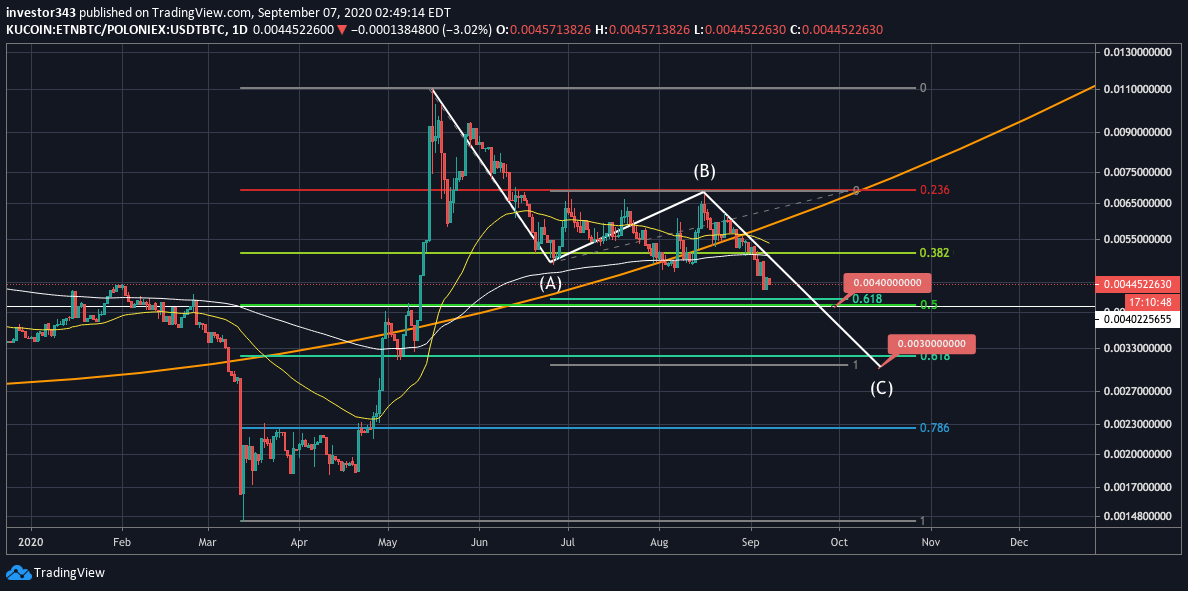
We are finally getting close to the white line (0.004) drawn on May 15th, the first post in this thread.
Though given its poor B wave correction, may see a more aggressive move down.
We are finally getting close to the white line (0.004) drawn on May 15th, the first post in this thread.
Though given its poor B wave correction, may see a more aggressive move down.

 Read on Twitter
 " title=" $ETNLooks like we will see a move soon https://abs.twimg.com/emoji/v2/... draggable="false" alt="👀" title="Augen" aria-label="Emoji: Augen">" class="img-responsive" style="max-width:100%;"/>
