(THREAD) What can we learn about the Japanese experiment with negative rates and #debt monetization? It’s an important Q because demographically the US is about 15 years behind #Japan. I’m going to share 5 charts. #interestrates
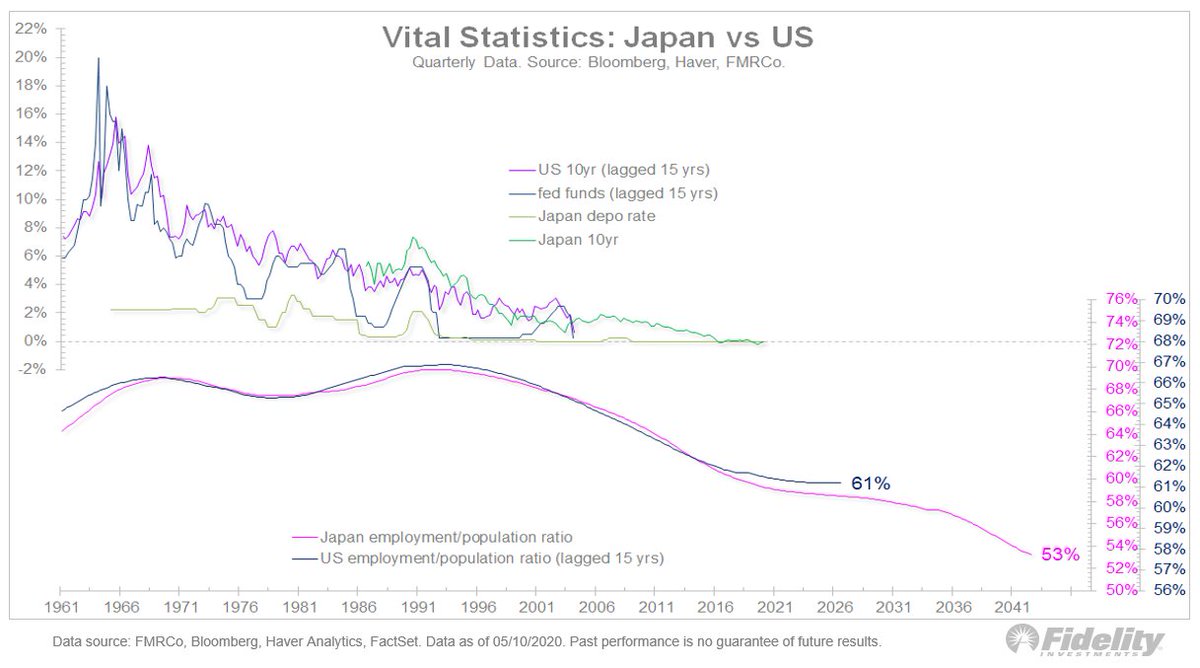
1/ The 1st chart shows US vs. Japanese interest rates up top and the US vs. Japan dependency ratio at the bottom. The dependency ratio measures the number of people below or above working age relative to the overall population. #US #data is lagged 15 years behind #Japan.
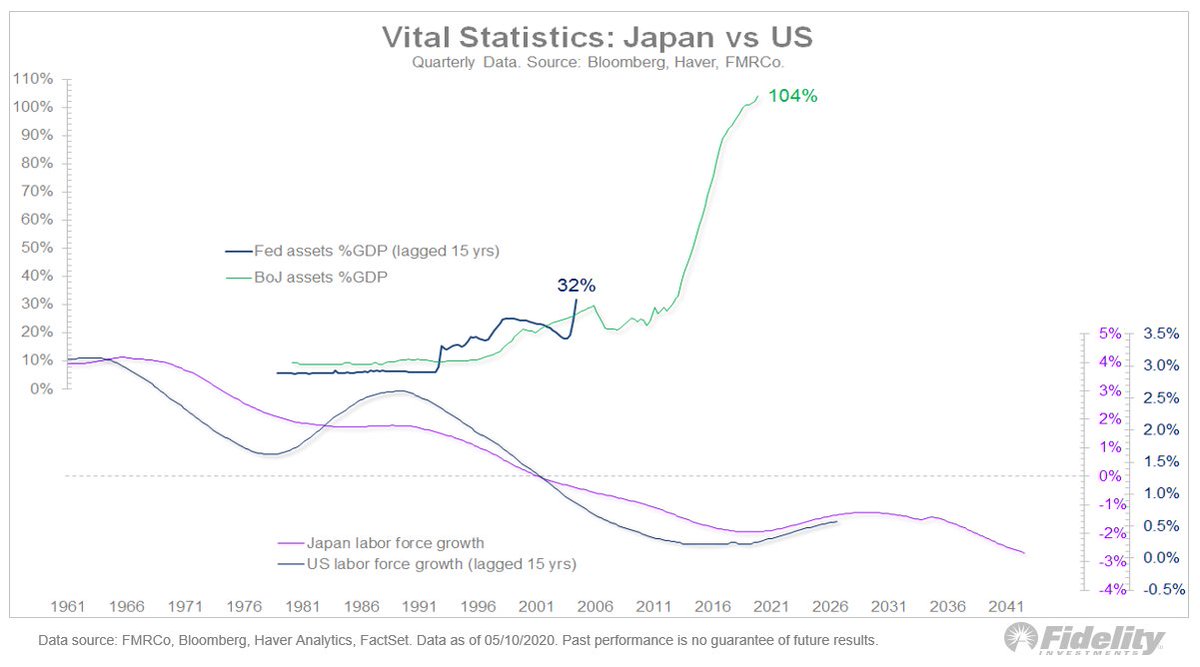
2/ This chart shows the #BOJ and #Fed balance sheets as a percent of #GDP in the top panel, and the five-year CAGR in the labor force in the bottom. See any similarities? Me too.
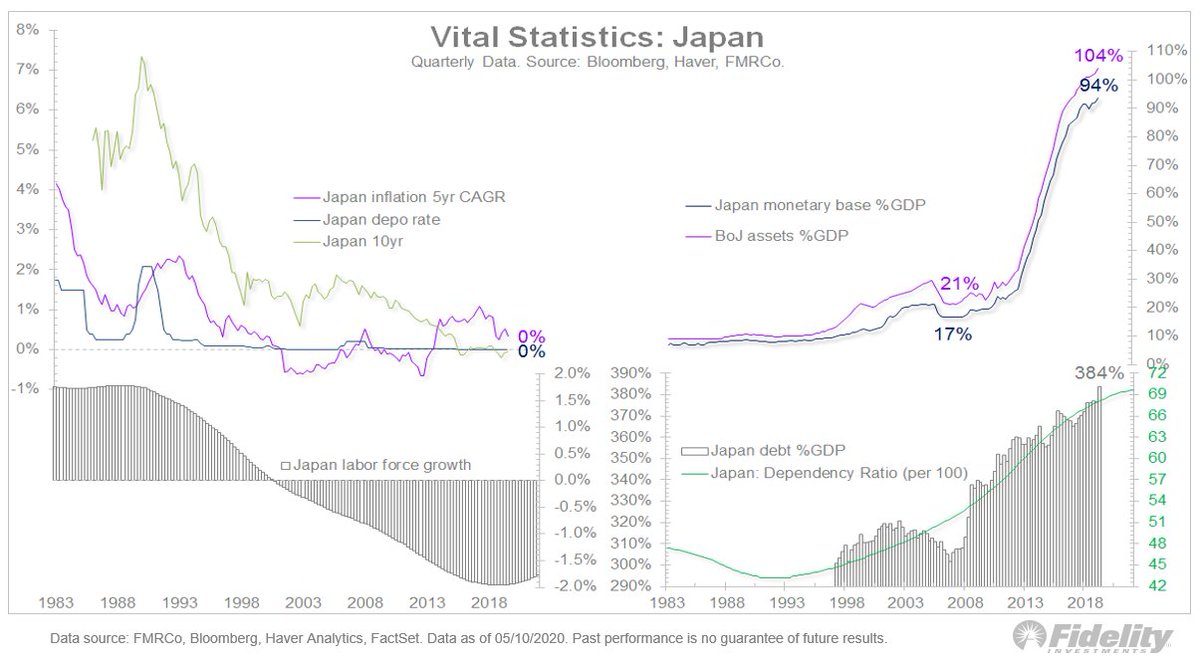
3/ Clockwise from upper left: Interest rates & #inflation, the BOJ’s balance sheet & the monetary base as a percent of #GDP, debt to GDP overlaid against the dependency ratio & the 5-year growth rate in the labor force.
4/ What strikes me about that chart is how a big increase in #BOJ money printing (to 104% of #GDP) hasn’t created any #inflation—real or financial asset inflation. The monetary base has grown from 17% of GDP to 94% and the 5-yr inflation rate is zero. Zero!
5/ That tells me the two-headed monster of debt & demographics is likely deflationary no matter how much money printing is going on.
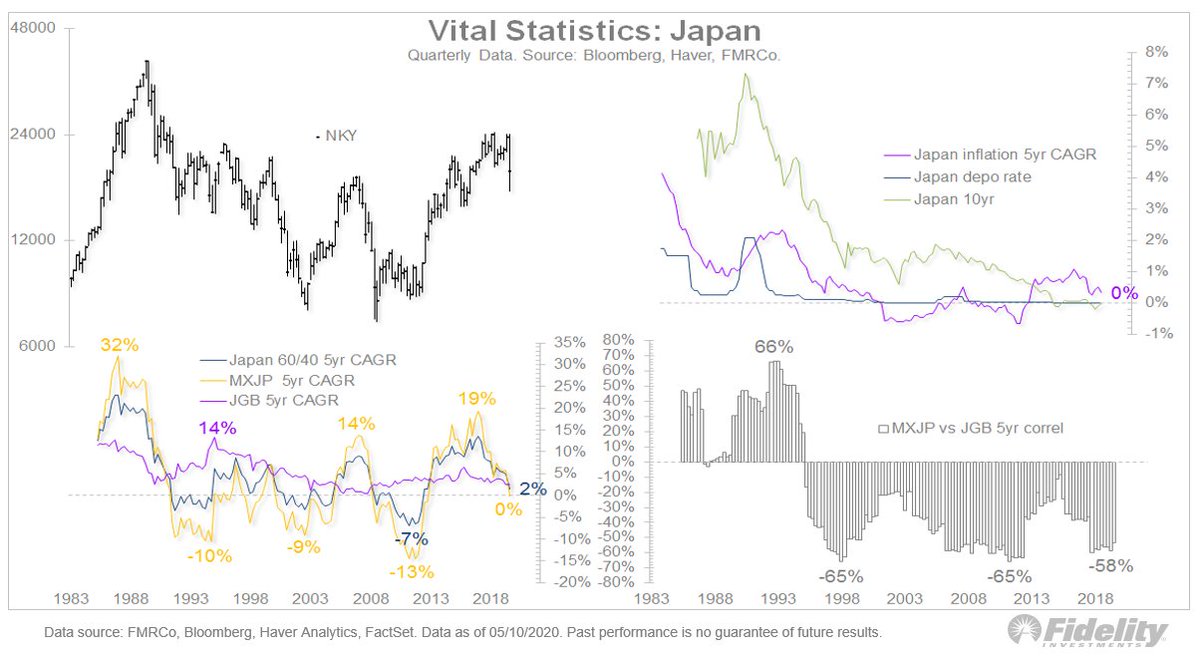
6/ This chart shows #equities vs. #bonds in Japan. Bottom right: the 5-yr. correlation between the MXJP & the Daiwa long-dated JGB index. Bottom left: the 5-yr. CAGR for equities, bonds and 60/40 of the two.
7/ It’s interesting that despite zero to negative yields, a 60/40 diversification strategy still seems to work in #Japan. Good to know in case the US follows this path.
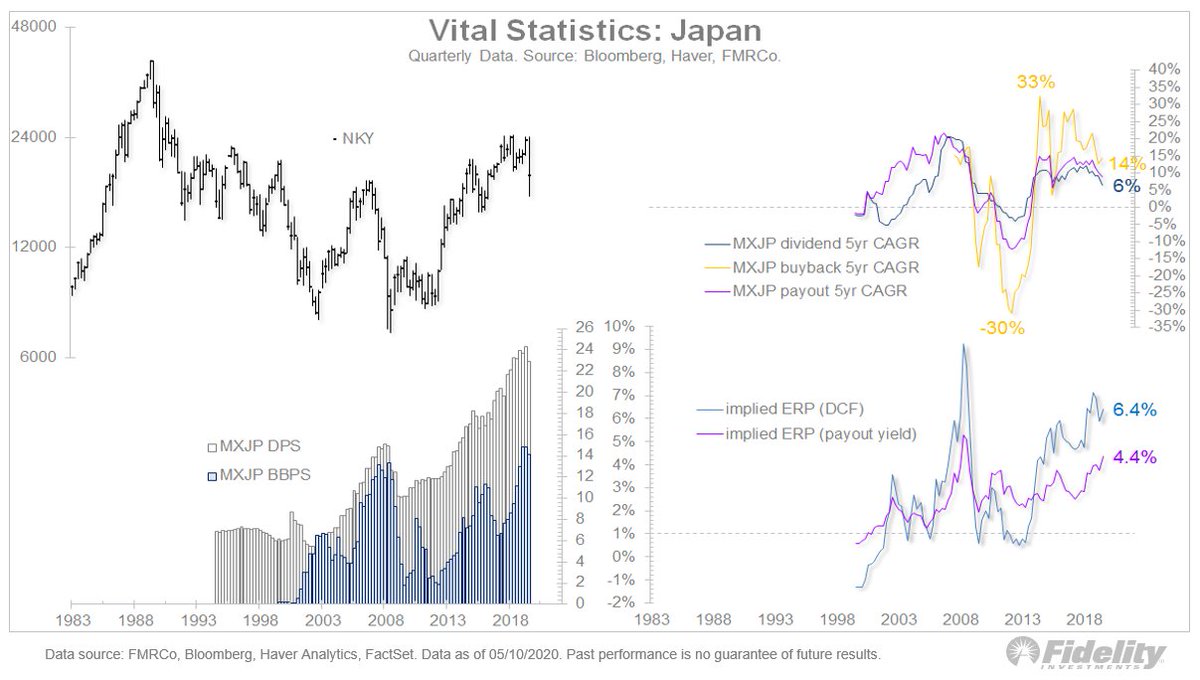
8/ My simplistic attempt to make sense of the Japanese #stockmarket. From top left: the Nikkei 225, the 5yr CAGR of dividends & buybacks for the MSCI Japan index (MXJP)…
9/ …then, the implied equity risk premium using both Aswath Damodaran’s DCF model & the spread between the payout yield and the 10yr JGB. Bottom left of that chart: the MXJP dividend-per-share and buybacks-per-share (source: Bloomberg).
10/ It shows that fewer #earnings get paid out to shareholders in Japan. The avg is about 50%, well below the 89% that the #SP500 pays out. But offsetting the lower payout ratio is a consistent growth rate in the size of dividends per share. Dividend growth is about 8-10%.
11/ Noteworthy, because if the US is heading to a regime where the labor-vs-capital pendulum starts swinging toward labor, the payout ratio for the #SPX will likely decline. This would, in turn, justify lower valuation multiples, as we’re already seeing in Japan & #Europe.
12/ Finally, it’s interesting that the implied equity risk premium in Japan is similar to the US at around 4-6% even though the realized ERP is around -2% in Japan vs. +4% in the US. Go figure!
13/FINAL If the US is going down a Japan-style modern monetary theory path, the first reaction might be to expect runaway inflation as the Fed prints money to monetize the debt and, in the process, debases the dollar. This is logical but it’s not borne out by the Japanese analog.

 Read on Twitter