
 Read on Twitter
1/n Alright, so what happened at this track yesterday that was so interesting? I& #39;ll try and summarize in this thread. https://twitter.com/dilutionproof/status/1260227117222187008">https://twitter.com/dilutionp...
2/n Just for reference, if you have no idea what this is about and want to read up, this thread might help. If you speak Dutch, the @BitcoinMagNL article in my pinned tweet does the trick as well. https://twitter.com/dilutionproof/status/1255981357118996480">https://twitter.com/dilutionp...
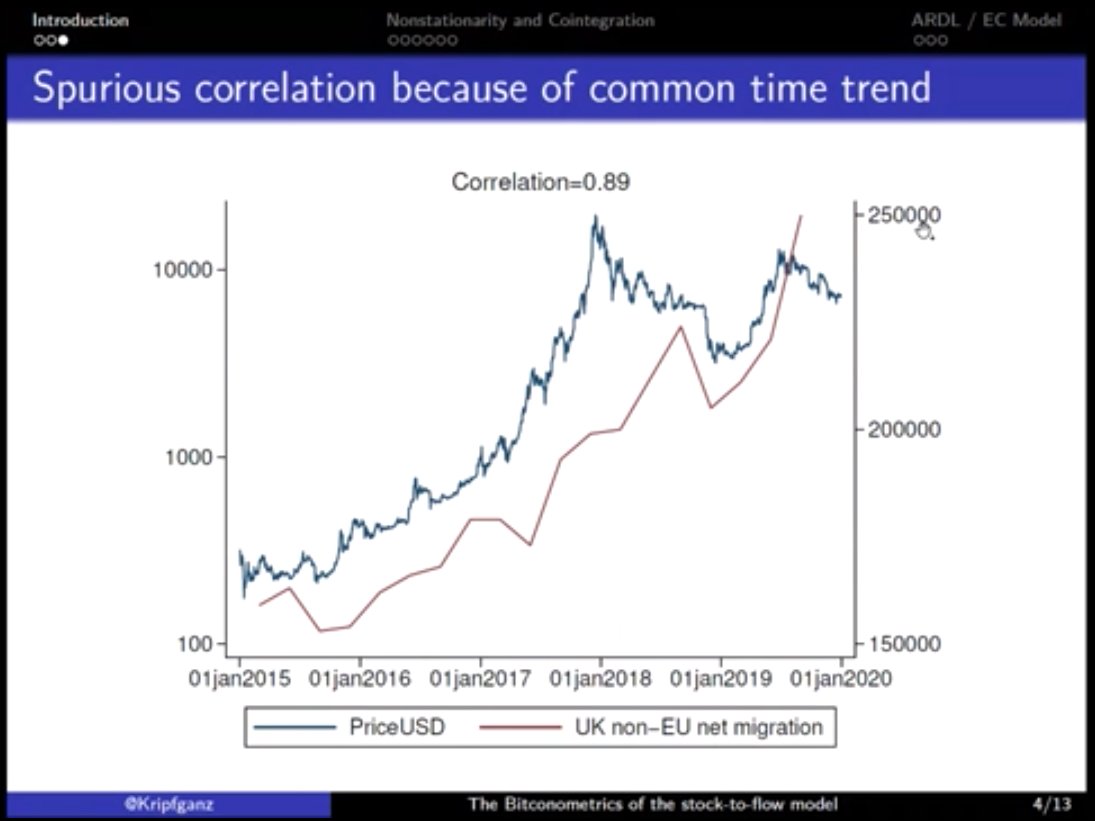
3/n After @moneymanolis gave an explanation of the fundamentals behind the #Bitcoin  https://abs.twimg.com/hashflags... draggable="false" alt=""> S2F model, @Kripfganz took the @ValueOfBitcoin stage.
One of the first things he did was give an example of a spurious regression: Bitcoin is correlated (r=.89) with UK non-EU net migration!https://abs.twimg.com/emoji/v2/... draggable="false" alt="😄" title="Smiling face with open mouth and smiling eyes" aria-label="Emoji: Smiling face with open mouth and smiling eyes">
One of the first things he did was give an example of a spurious regression: Bitcoin is correlated (r=.89) with UK non-EU net migration!
 S2F model, @Kripfganz took the @ValueOfBitcoin stage.One of the first things he did was give an example of a spurious regression: Bitcoin is correlated (r=.89) with UK non-EU net migration! https://abs.twimg.com/emoji/v2/... draggable="false" alt="😄" title="Smiling face with open mouth and smiling eyes" aria-label="Emoji: Smiling face with open mouth and smiling eyes">" title="3/n After @moneymanolis gave an explanation of the fundamentals behind the #Bitcoin https://abs.twimg.com/hashflags... draggable="false" alt=""> S2F model, @Kripfganz took the @ValueOfBitcoin stage.One of the first things he did was give an example of a spurious regression: Bitcoin is correlated (r=.89) with UK non-EU net migration! https://abs.twimg.com/emoji/v2/... draggable="false" alt="😄" title="Smiling face with open mouth and smiling eyes" aria-label="Emoji: Smiling face with open mouth and smiling eyes">" class="img-responsive" style="max-width:100%;"/>
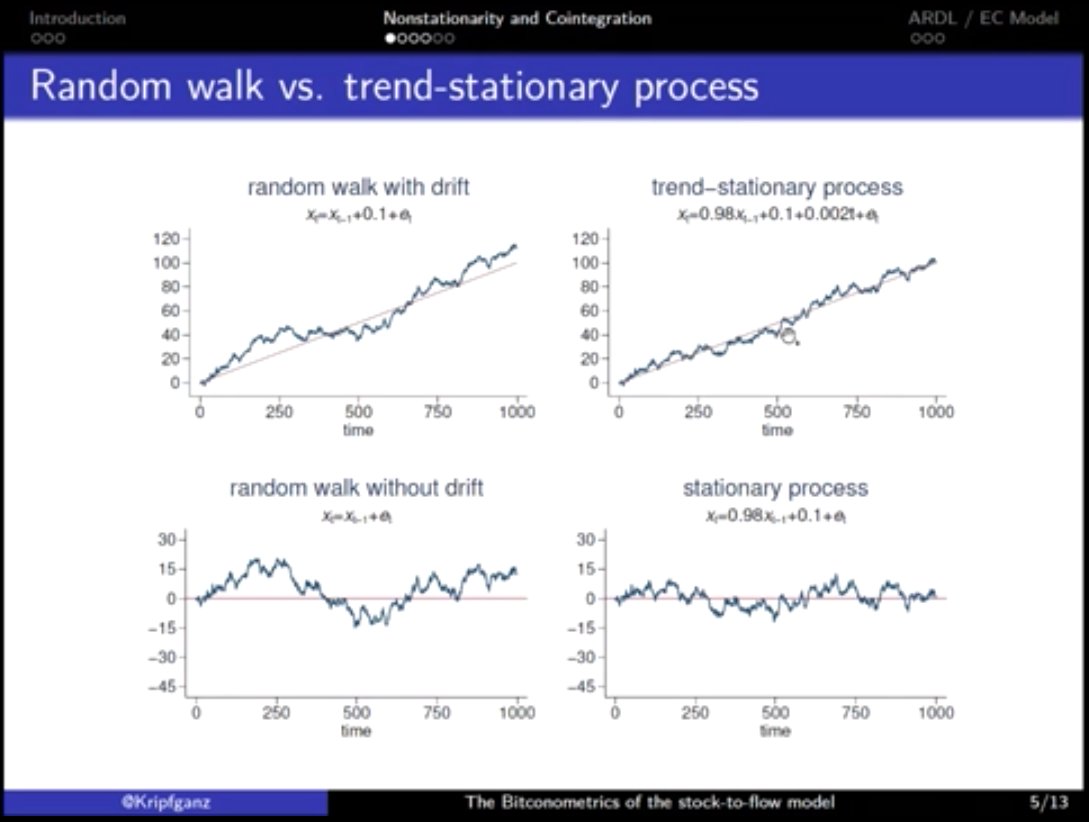
4/n Since #Bitcoin https://abs.twimg.com/hashflags... draggable="false" alt=""> price & S2F are time series, you need to look at the time series& #39; properties before doing further analysis.
@Kripfganz showed examples of time series that are not stationary (random walks) & some that are.
The key question; which of these applies to Bitcoin?
@Kripfganz showed examples of time series that are not stationary (random walks) & some that are.
The key question; which of these applies to Bitcoin?
 price & S2F are time series, you need to look at the time series& #39; properties before doing further analysis. @Kripfganz showed examples of time series that are not stationary (random walks) & some that are.The key question; which of these applies to Bitcoin?" title="4/n Since #Bitcoin https://abs.twimg.com/hashflags... draggable="false" alt=""> price & S2F are time series, you need to look at the time series& #39; properties before doing further analysis. @Kripfganz showed examples of time series that are not stationary (random walks) & some that are.The key question; which of these applies to Bitcoin?">
 price & S2F are time series, you need to look at the time series& #39; properties before doing further analysis. @Kripfganz showed examples of time series that are not stationary (random walks) & some that are.The key question; which of these applies to Bitcoin?" title="4/n Since #Bitcoin https://abs.twimg.com/hashflags... draggable="false" alt=""> price & S2F are time series, you need to look at the time series& #39; properties before doing further analysis. @Kripfganz showed examples of time series that are not stationary (random walks) & some that are.The key question; which of these applies to Bitcoin?">
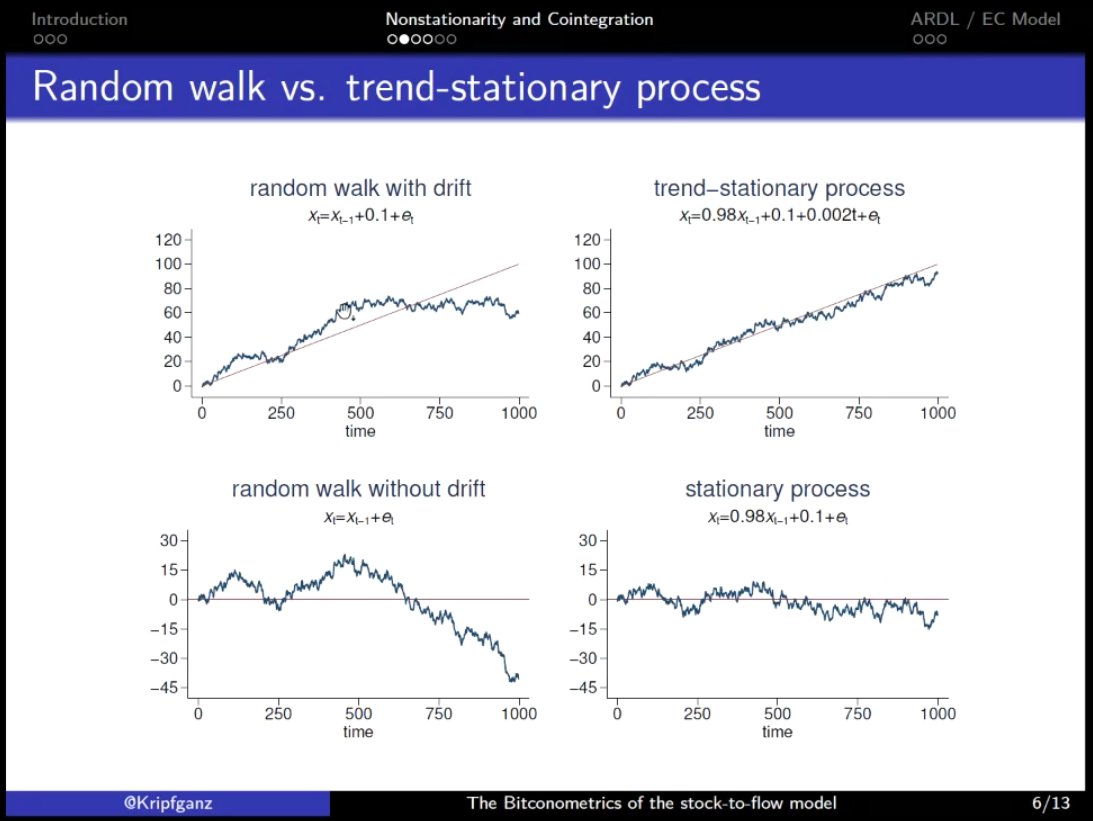
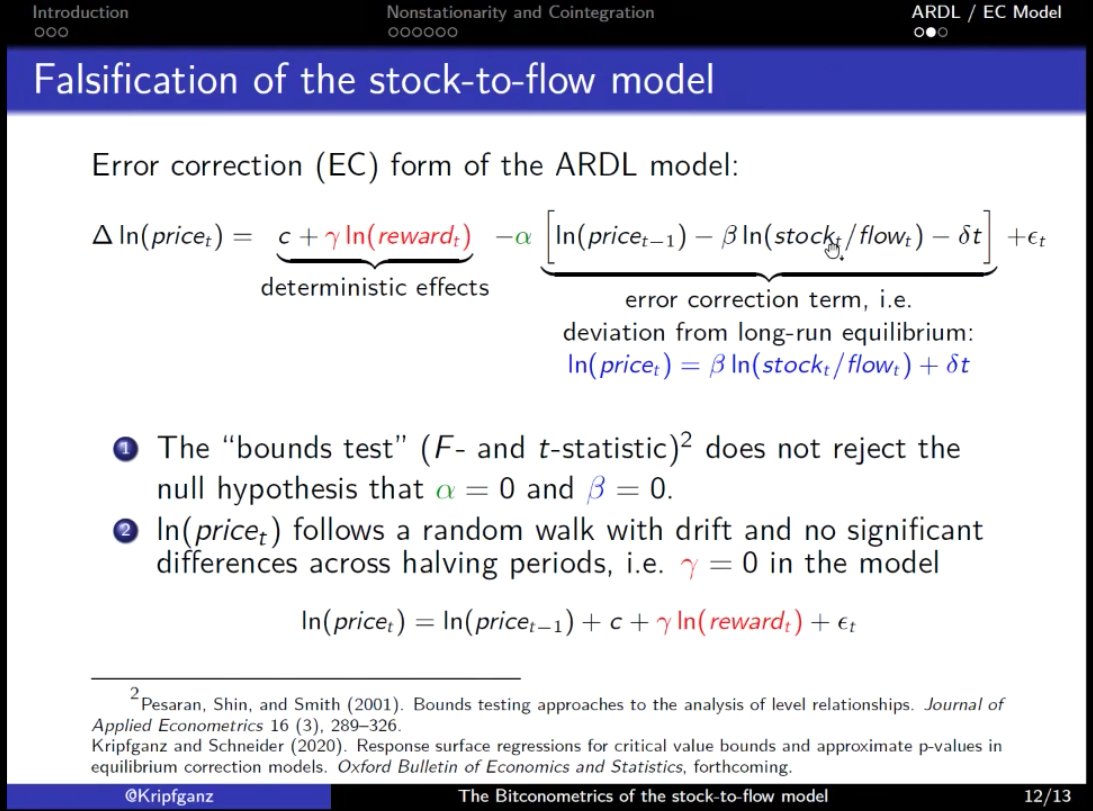
5/n Like @btconometrics did in his March 27th article, @Kripfganz used an ARDL model.
His conclusion: the (log) #Bitcoinhttps://abs.twimg.com/hashflags... draggable="false" alt=""> price follows a random walk with drift (top left figures in the previous tweet) and has no significant differences across halving periods.
His conclusion: the (log) #Bitcoin
 price follows a random walk with drift (top left figures in the previous tweet) and has no significant differences across halving periods." title="5/n Like @btconometrics did in his March 27th article, @Kripfganz used an ARDL model.His conclusion: the (log) #Bitcoin https://abs.twimg.com/hashflags... draggable="false" alt=""> price follows a random walk with drift (top left figures in the previous tweet) and has no significant differences across halving periods." class="img-responsive" style="max-width:100%;"/>
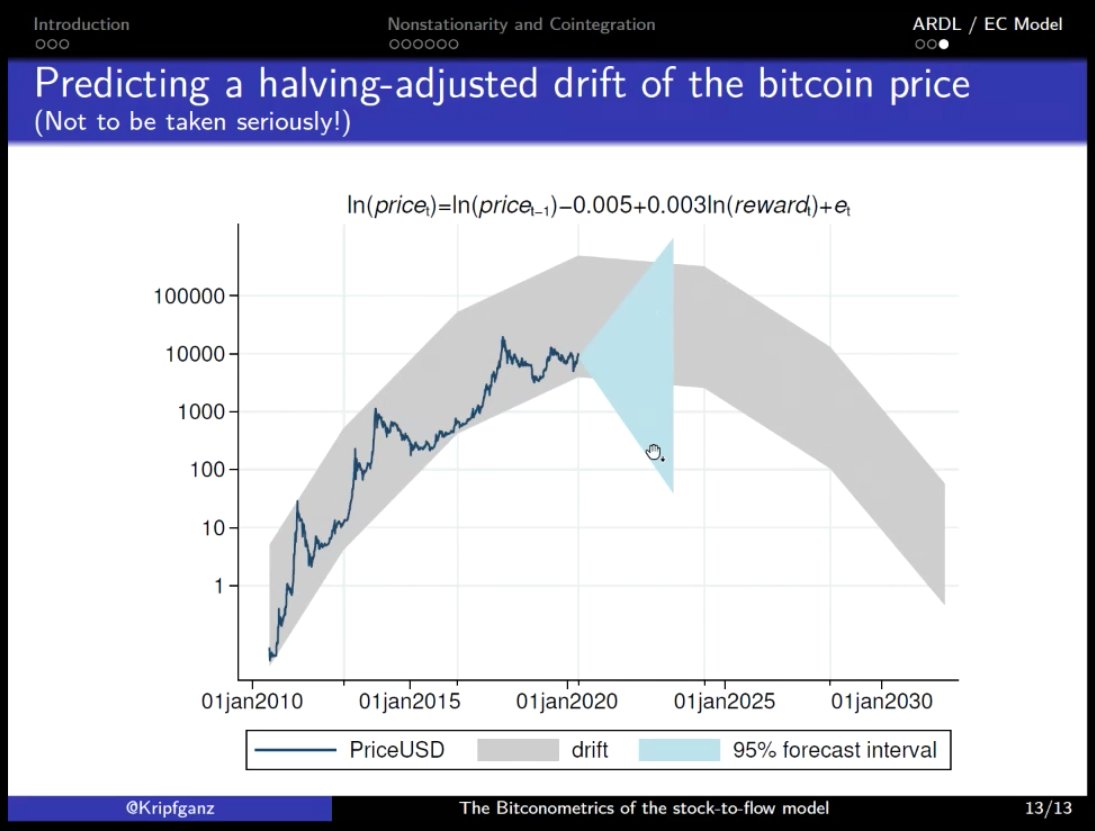
6/n These findings imply that there is no cointegration between the #Bitcoin https://abs.twimg.com/hashflags... draggable="false" alt=""> price and S2F ratio like we thought before, and that while the price drifts upwards, the time series is basically a random walk, which means it could go anywhere.
7/n To illustrate the point that the #Bitcoin https://abs.twimg.com/hashflags... draggable="false" alt=""> price can go anywhere, @Kripfganz introduced (with playful banter) what I& #39;d like to call the & #39;Grey Rainbow of Doom& #39;.
This graph puts thehttps://abs.twimg.com/emoji/v2/... draggable="false" alt="🌈" title="Rainbow" aria-label="Emoji: Rainbow">-chart by @ercwl & @rohmeo_de in a different light! https://abs.twimg.com/emoji/v2/... draggable="false" alt="😅" title="Smiling face with open mouth and cold sweat" aria-label="Emoji: Smiling face with open mouth and cold sweat">
I guess there& #39;s always a bigger fish.
This graph puts the
I guess there& #39;s always a bigger fish.
 price can go anywhere, @Kripfganz introduced (with playful banter) what I& #39;d like to call the & #39;Grey Rainbow of Doom& #39;. This graph puts the https://abs.twimg.com/emoji/v2/... draggable="false" alt="🌈" title="Rainbow" aria-label="Emoji: Rainbow">-chart by @ercwl & @rohmeo_de in a different light! https://abs.twimg.com/emoji/v2/... draggable="false" alt="😅" title="Smiling face with open mouth and cold sweat" aria-label="Emoji: Smiling face with open mouth and cold sweat">I guess there& #39;s always a bigger fish." title="7/n To illustrate the point that the #Bitcoin https://abs.twimg.com/hashflags... draggable="false" alt=""> price can go anywhere, @Kripfganz introduced (with playful banter) what I& #39;d like to call the & #39;Grey Rainbow of Doom& #39;. This graph puts the https://abs.twimg.com/emoji/v2/... draggable="false" alt="🌈" title="Rainbow" aria-label="Emoji: Rainbow">-chart by @ercwl & @rohmeo_de in a different light! https://abs.twimg.com/emoji/v2/... draggable="false" alt="😅" title="Smiling face with open mouth and cold sweat" aria-label="Emoji: Smiling face with open mouth and cold sweat">I guess there& #39;s always a bigger fish." class="img-responsive" style="max-width:100%;"/>
8/n So what does this mean for @100trillionUSD& #39;s S2F model?
@Kripfganz& #39;s findings not only imply that there is no cointegration between #Bitcoinhttps://abs.twimg.com/hashflags... draggable="false" alt=""> price & S2F ratio, but also that these time series should not be used to predict the future Bitcoin price, as it could go anywhere.
@Kripfganz& #39;s findings not only imply that there is no cointegration between #Bitcoin
9/n However, is that true? If the magic behind & #39;number go up& #39; wasn& #39;t captured in these models it could mean that there& #39;s a driver of price that could not (yet) be quantified.
If all model& #39;s are thrown in thehttps://abs.twimg.com/emoji/v2/... draggable="false" alt="🗑️" title="Wastebasket" aria-label="Emoji: Wastebasket">, there& #39;s always praxeology to fall back on. https://twitter.com/pierre_rochard/status/1260242189445214209">https://twitter.com/pierre_ro...
If all model& #39;s are thrown in the
10/n Right now it seems like the last glimmer of hope for these time series models lies with @BurgerCryptoAM, who is still chewing on @Kripfganz& #39;s results and said to be working on a new article. Although even Marcel seems to lean toward & #39;falsified& #39;. https://twitter.com/BurgerCryptoAM/status/1260304828955312129">https://twitter.com/BurgerCry...
11/n There& #39;s still @100trillionUSD& #39;s #Bitcoin https://abs.twimg.com/hashflags... draggable="false" alt=""> S2FX (cross asset) model; which is NOT a time series.
The @ValueOfBitcoin S2F-panelists seemed to agree that it is conceptually interesting, but 6 datapoints is too little. @ercwl also questioned the used gold & silver datapoints.
The @ValueOfBitcoin S2F-panelists seemed to agree that it is conceptually interesting, but 6 datapoints is too little. @ercwl also questioned the used gold & silver datapoints.
12/n @btconometrics showed that using just 6 datapoints at least introduces uncertainties in the interval of the price predictions, which becomes very wide. https://twitter.com/dilutionproof/status/1258456555034476548">https://twitter.com/dilutionp...
13/n @100trillionUSD also showed that accidentally finding 6 datapoints that align well enough to find an R-squared of 0.997 (which means that the model explains 99.7% of the variance between these datapoints) is at least very unlikely.
 is at least very unlikely.")
 is at least very unlikely.")
14/n Until the S2FX model is expanded upon by adding more assets, it looks like most of the discussions will be about & #39;are 6 datapoints enough?& #39; for now.
Could this be a case of & #39;where& #39;s smoke, there& #39;s fire& #39;?
Or, as @btconometrics put it: https://twitter.com/btconometrics/status/1259411494589960192">https://twitter.com/btconomet...
Could this be a case of & #39;where& #39;s smoke, there& #39;s fire& #39;?
Or, as @btconometrics put it: https://twitter.com/btconometrics/status/1259411494589960192">https://twitter.com/btconomet...


