Like many, I have tried to understand COVID-19, how I can stay safe, and how the state of OK can stay safe. I am going to share some mathematical modeling, the sum of which is this: ~85% of the variance in infection rates across states can be explained with 4 variables. 1/X
I recognize I& #39;m subjecting myself to the slings and arrows of Twitter. So be it. If there is a variable I& #39;ve missed--and I& #39;ve tried a lot of them--I would love ideas. I& #39;d also note that the state of OK has taken and is continuing to take this whole situation very seriously. 2/X
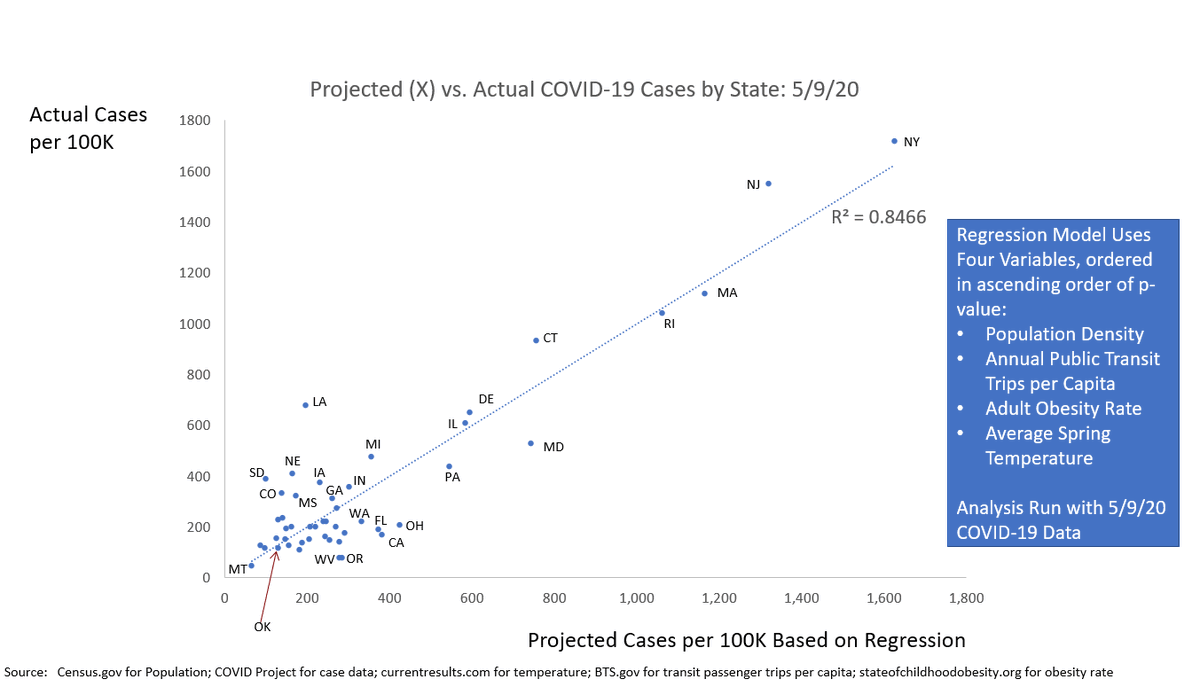
Those 4 variables: Population Density, Annual Public Transit Trips per Capita, Adult Obesity Rate (which I take to be a proxy for a state& #39;s overall health), and Average Springtime Temperature. This is what that looks like visually: 3/X
TL/DR version of the implication of this (if you can get past the fact that correlation is not causality) is to reinforce existing guidance: maintain social distancing, wash your hands, protect vulnerable populations. And get outside (but away from other people). 4/X
Further, I would say that one& #39;s own view of the current state of the COVID-19 crisis is likely informed by whether one looks at local or national news. The Northeast is always going to get more coverage in national news, and in fact, the situation is terrible in the NE. 5/X
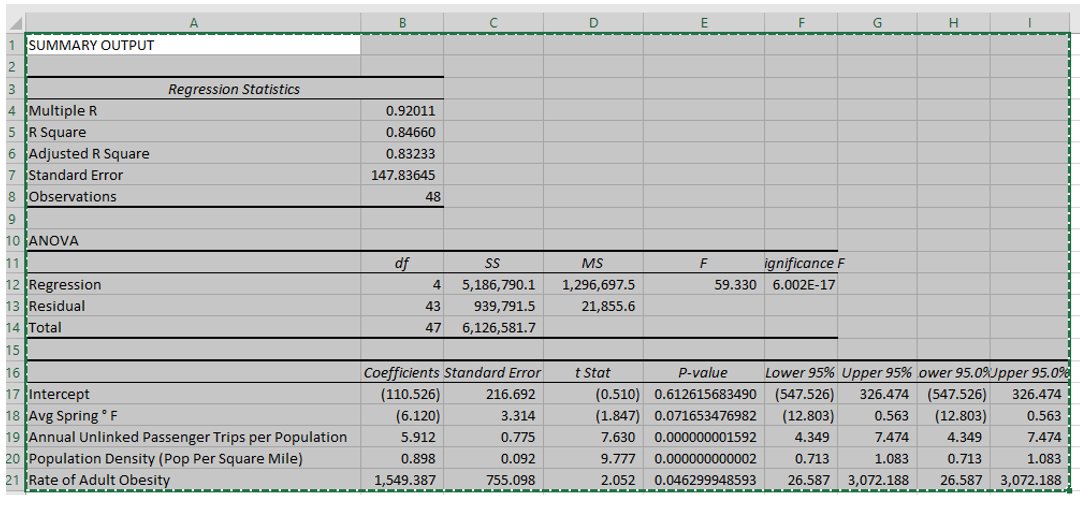
Here is what the regression output looks like. Frankly, the p-value on springtime temperature is a little too high, but I& #39;ve looked at the map quite a lot--and it appeared some sort of North-to-South adjustment was needed. 6/X
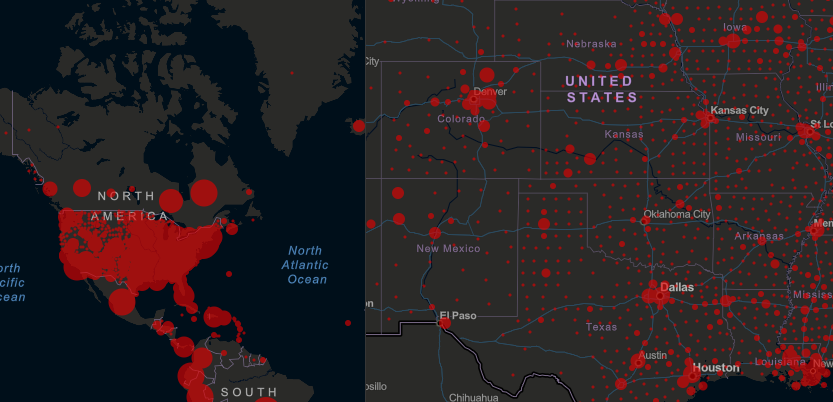
I started down this path after working for the last two months as a leader of the Governor& #39;s Solution Task Force for COVID-19. I stared at https://coronavirus.jhu.edu/map.html ">https://coronavirus.jhu.edu/map.html&... regularly. At first glance, the whole U.S. looks red, but our part of the country was not as much so. Why? 7/X
We prepared for the surge to come, acquiring PPE in a tough global market. We built out hospital capacity to prepare for the surge. We took--and our major cities& #39; mayors took--action to try to flatten the curve, and that appears to have been successful. 8/X
At the same time, we have outperformed, thus far, every major model projecting cases in Oklahoma. I believe our actions taken have helped and lives have been saved, but there were clearly other factors at play. 9/X
Population density is an obvious driver of infection, which is why social distancing is the mantra. And in fact, population density accounts for 61% of the variance across states. (I am certain this would hold at the county or city level). 10/X
New York is a clear outlier. And CA and FL were both well under the regression line based just on population. I hypothesized car ownership/usage might be a factor, then ran across work done by Jeffrey Severts of the University of Chicago. 11/X
Mr. Severts had done his own modeling, on deaths rather than cases, and found that % commuting using mass transit was an important variable. I instead used total mass transit trips, but same basic idea. 12/X
Again, correlation <> causation. I& #39;m not a scientist or epidemiologist; there are more sophisticated points those folks could make. I& #39;m just a guy immersed in COVID-19 public policy 60+ hours/week, who has been working on the state& #39;s plan and who loves solving problems 13/X
A specific note on obesity rate. I do not know of a basis to believe that obesity is causal to COVID infection. I could hypothesize something, but I think obesity rate mostly works as an X variable because it is a good general indicator of a state& #39;s health. 14/X
None of this is to make light of COVID-19, or to overly focus on the numbers. Every death from this disease is regrettable. The numbers do help us with understanding. 15/X
The numbers also do not negate the importance of action and being smart. Oklahoma has had fewer infections per capita than a number of other states with similar characteristics. If we start going crazy now, things can go haywire. 16/X
Oklahoma, like all states, has had some concentrations of infections, particularly in nursing homes and in a pork processing plant. Those are both instances where our state& #39;s normal population density does not hold, and in LTC facilities, where there are vulnerable people 17/X
I& #39;d also note that while our infection rate is relatively low, people are suffering from COVID-19, and our economy has been battered due to the actions that have been taken to protect our population. Oklahoma is hurting, and we have hard work ahead. 18/X
Final thoughts: as much as I love big cities, I am going to avoid big-city living for a while. Crowded situations (subways, concerts, ballgames, dense sidewalks, elevators), situations where I have to touch surfaces others touch--not in my near future. 19/X
Keep your social distance, stay home when possible, wear a mask in public, wash your hands, protect our vulnerable citizens, get some fresh air when the weather& #39;s good. That& #39;s what we& #39;ve been saying for a while, and that& #39;s still what the model tells me. 20/20
@threadreaderapp unroll

 Read on Twitter


