Alright alright alright folks we& #39;ve got some COVID data!
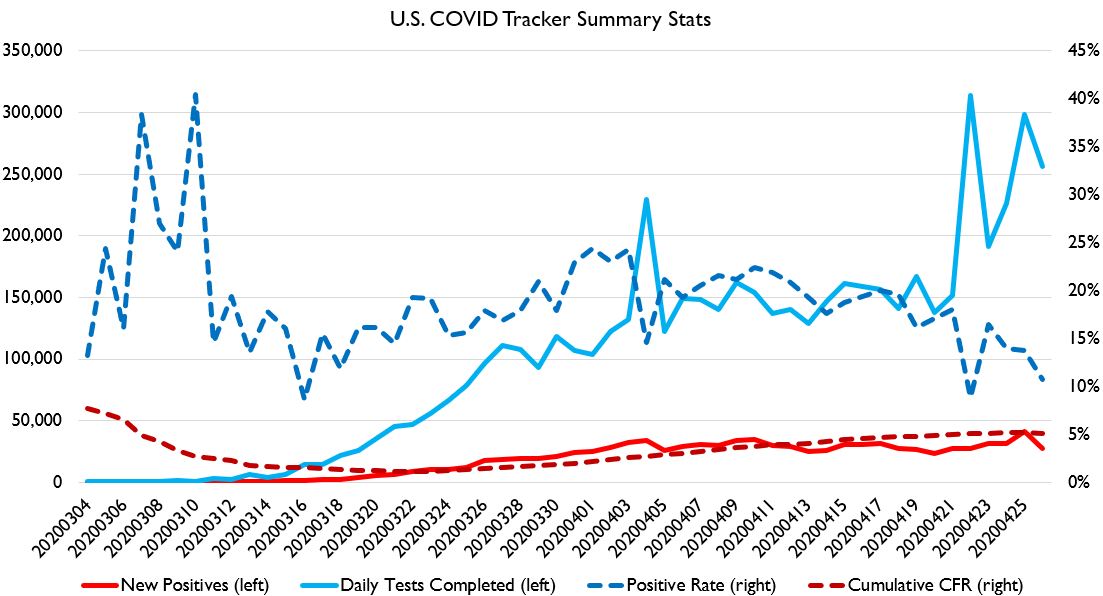
Testing scale jumped WAY up over the weekend, while the positive rate continued to fall, which is great news! The CFR also flatlined and fell slightly!
Wooooo!
Testing scale jumped WAY up over the weekend, while the positive rate continued to fall, which is great news! The CFR also flatlined and fell slightly!
Wooooo!
Just in terms of the crude data, this is one of the best new data releases we& #39;ve had. All the indicators moved in the right direction.
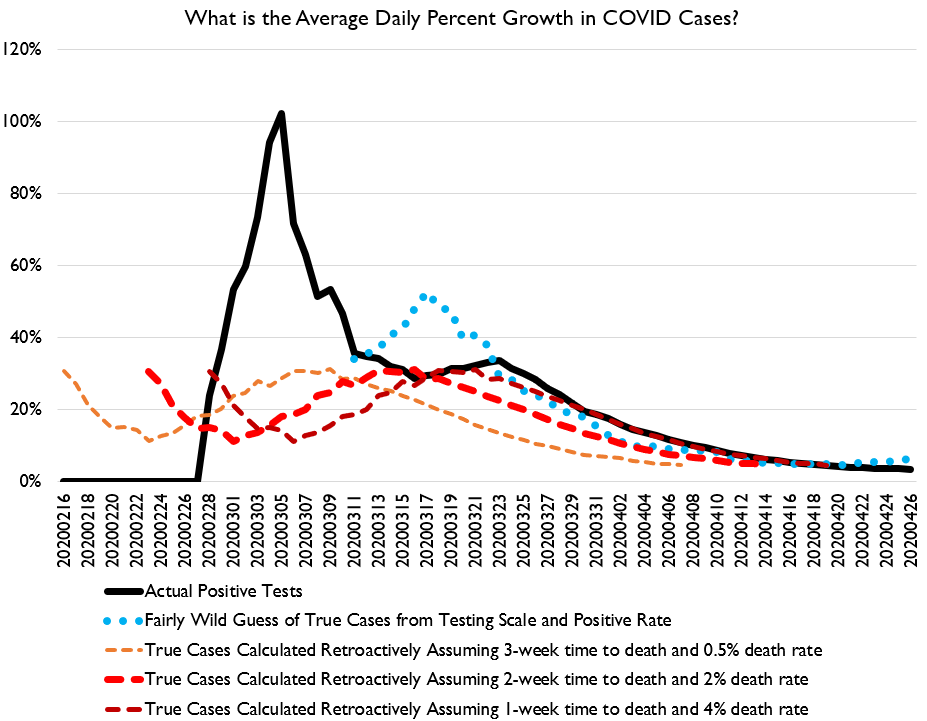
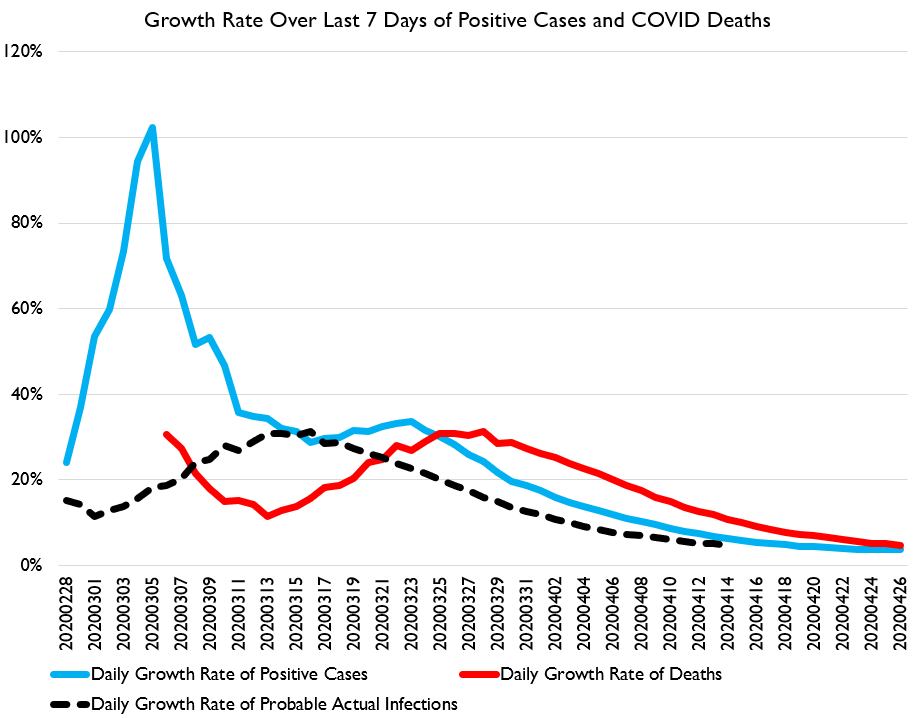
When we convert this into our spread rates, we also get some pretty good indicators! It looks a lot like that curve really is getting pushed down!
However, a note of caution: we& #39;ve had a long period now where the estimated lag-weekly pace of infection spread declined by an average of 6% per day.
That it& #39;s stable at 6% is more consistent with an asymptote than a true "hammer it to zero."
That it& #39;s stable at 6% is more consistent with an asymptote than a true "hammer it to zero."
The worry with an asymptote is that it might continue to spread at a low rate in some communities and come roaring back next winter, which is the scariest of all contingencies.
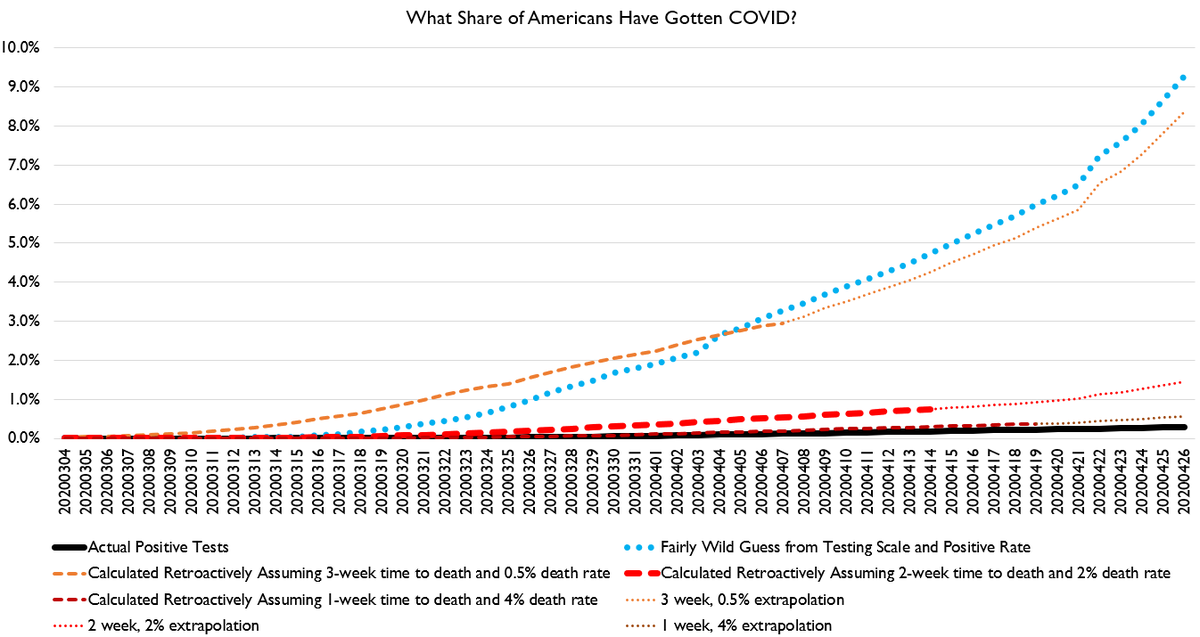
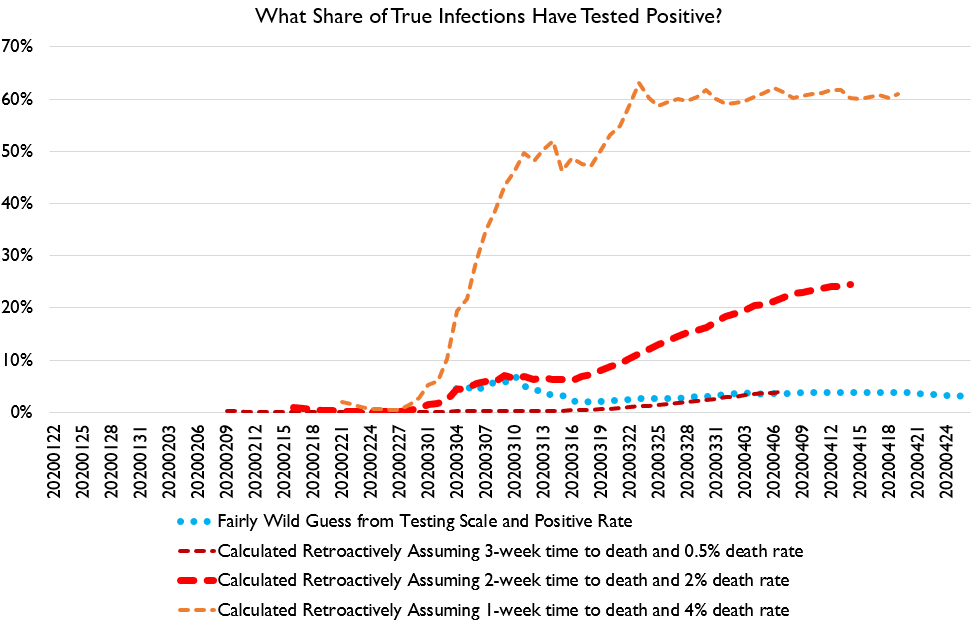
So how many Americans have been infected?
Well, out "3 weeks and 0.5% IFR" line has crossed UNDER our "Fermi estimate from testing" line. Which suggests that wild guess was pretty wild indeed. Probably still under 8% of Americans have gotten COVID, but >1.5%.
Well, out "3 weeks and 0.5% IFR" line has crossed UNDER our "Fermi estimate from testing" line. Which suggests that wild guess was pretty wild indeed. Probably still under 8% of Americans have gotten COVID, but >1.5%.
What this implies is that even with recently ramped up testing, we are testing no more than 20% of true positives, and probably <10%. Which means we need *at least* 5 times as much testing. Probably 10x as much, for test-and-trace to work without central quarantine.
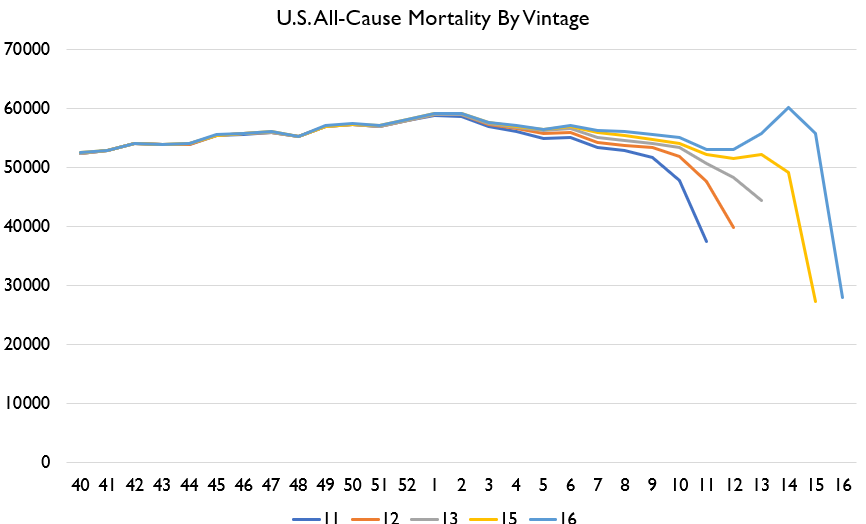
Over the weekend, we got new FluView mortality data.
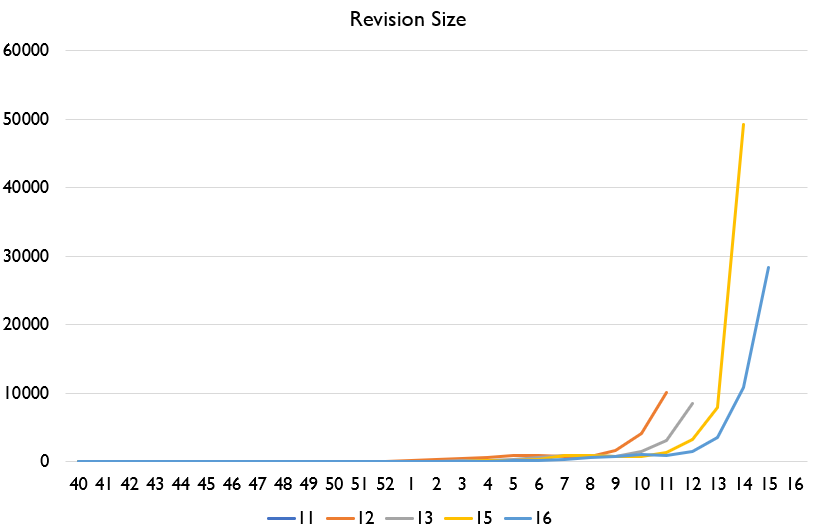
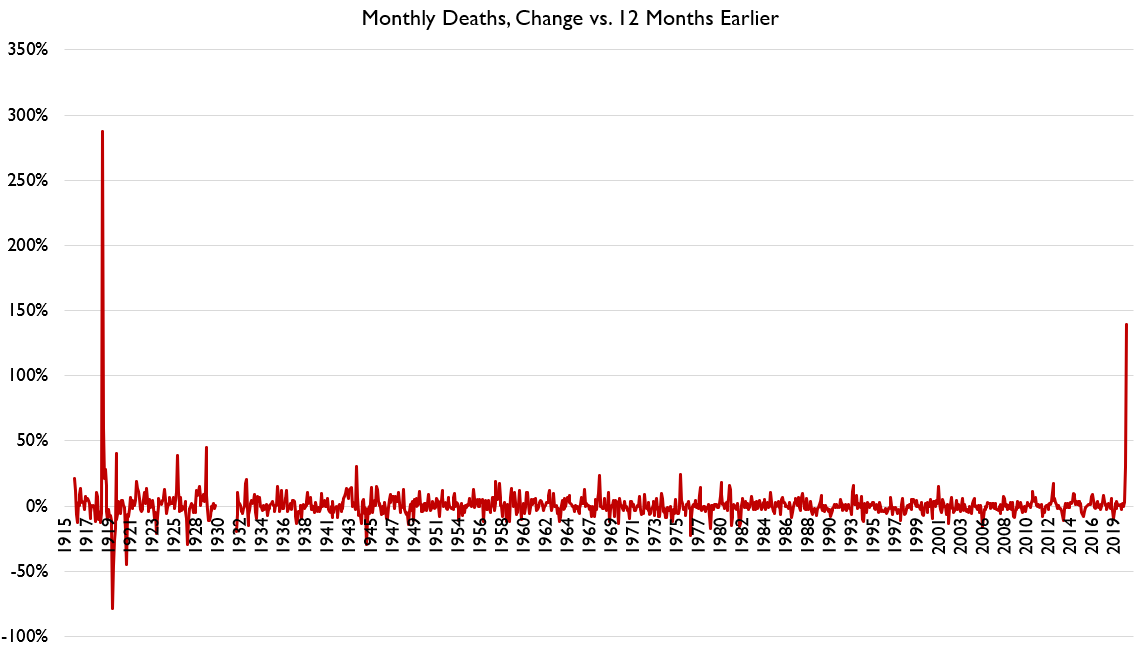
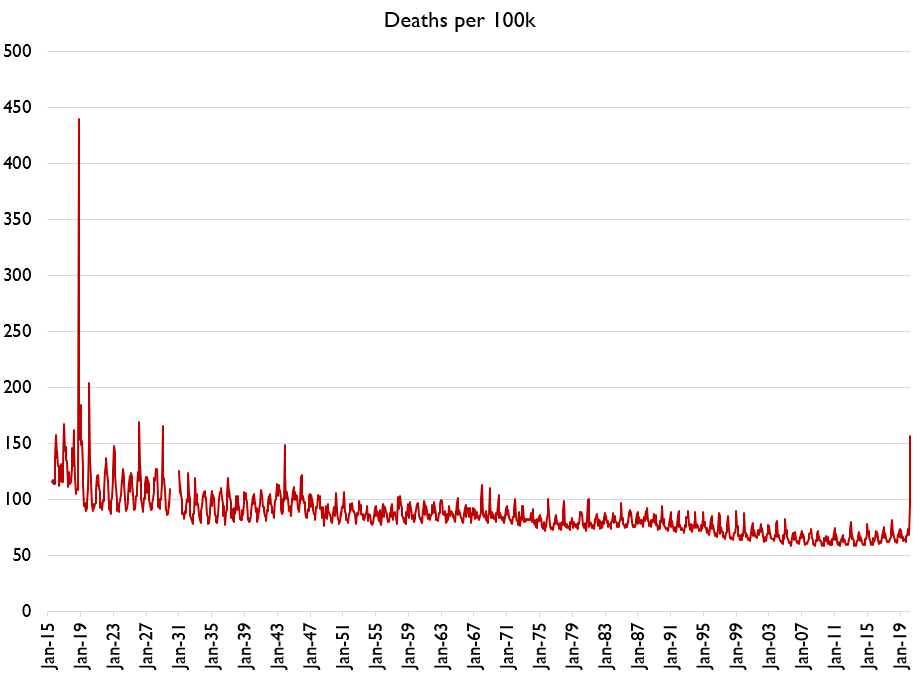
US weekly all-cause mortality has officially moved above its 2019/20 winter peak. We are now at a two-peak mortality pattern, and you can be sure that peak will move higher as we get revisions. It& #39;s mostly driven by P&I deaths
US weekly all-cause mortality has officially moved above its 2019/20 winter peak. We are now at a two-peak mortality pattern, and you can be sure that peak will move higher as we get revisions. It& #39;s mostly driven by P&I deaths
Over the last week, I came to the conclusion that NY& #39;s "confirmed COVID deaths" were a good proxy for excess deaths.
But this week& #39;s revisions have disabused me of that notion. Through last completed week we& #39;re at ~20k excess deaths, and just ~14k confirmed.
But this week& #39;s revisions have disabused me of that notion. Through last completed week we& #39;re at ~20k excess deaths, and just ~14k confirmed.
So it may be good to include "suspected" in your mental model of what excess deaths are gonna end up being. Alas, COVID Tracker doesn& #39;t report those, so I don& #39;t have& #39;em in a useful format.
Thanks to NY& #39;s latest revisions, my NY model has gotten considerably worse than the last revision.
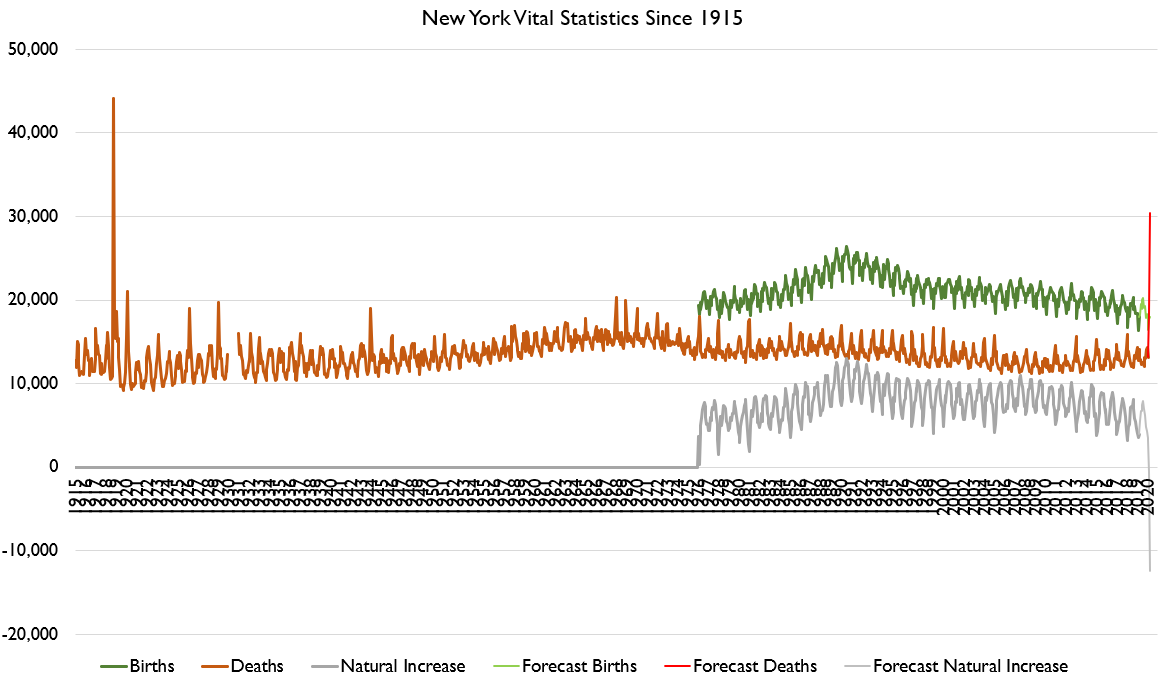
What does that look like in the long run?
Well.... it& #39;s really bad. NY is truly experiencing an epochal event.
Well.... it& #39;s really bad. NY is truly experiencing an epochal event.
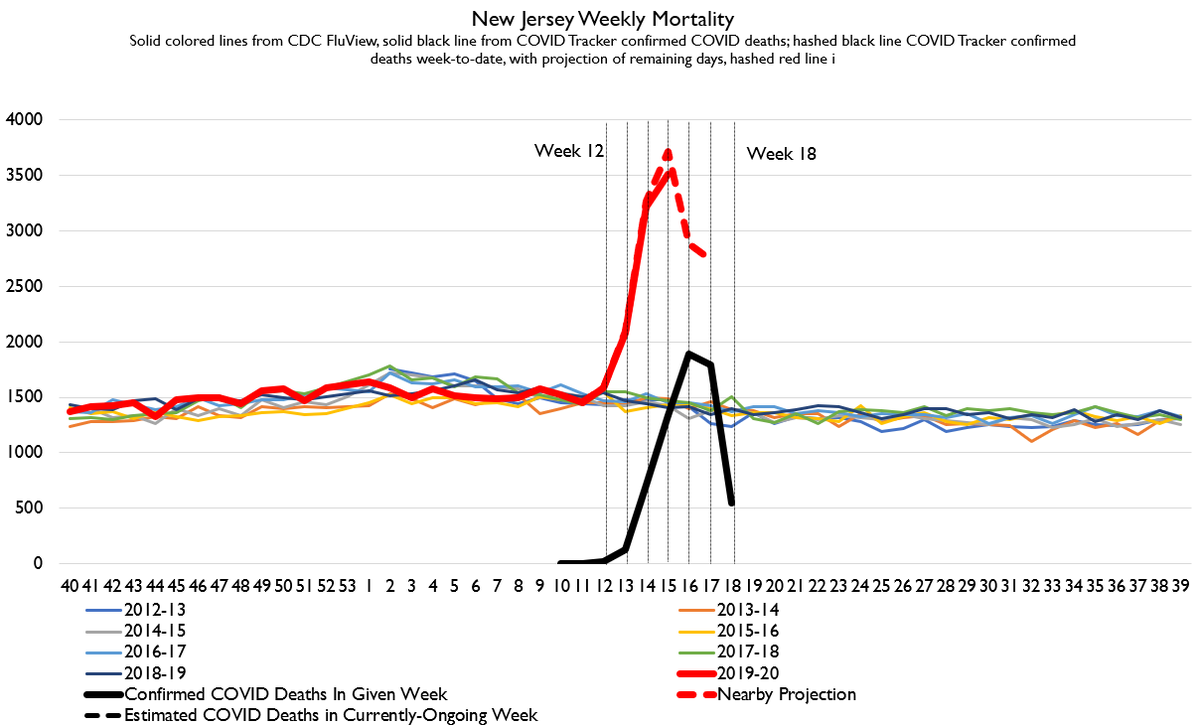
Here& #39;s New Jersey. Also looking very bad.
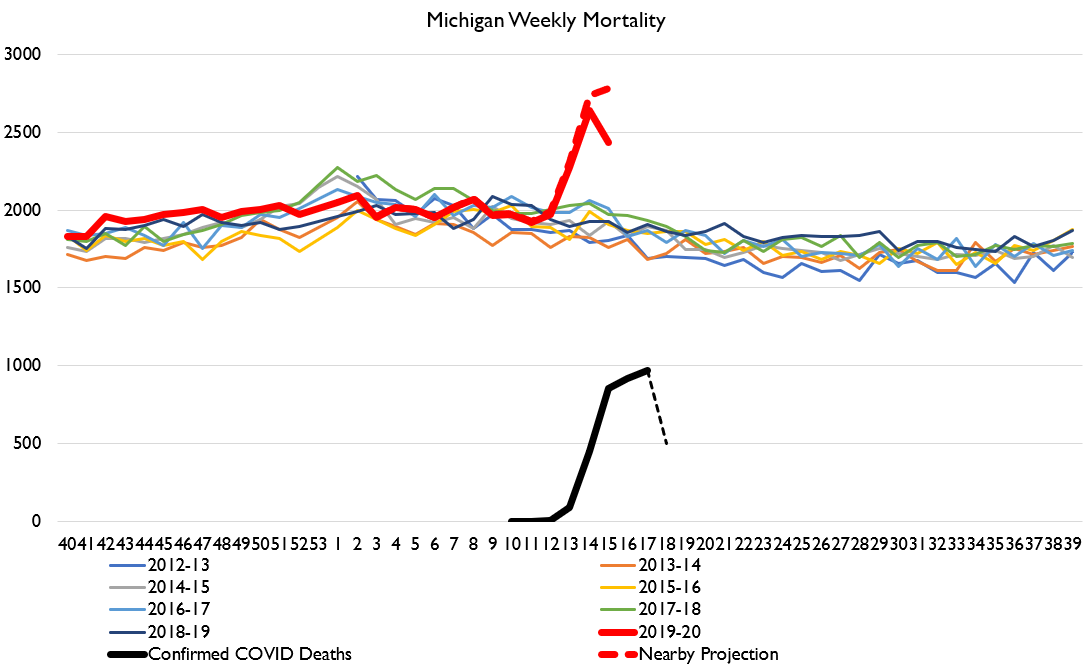
We& #39;ve also got decently good Michigan data now. It& #39;s not as bad as NY/NJ of course, but.... not good! That& #39;s a very large spike! Also looks like COVID deaths are indeed a decent approximation of excess deaths, not "would have happened anyways."
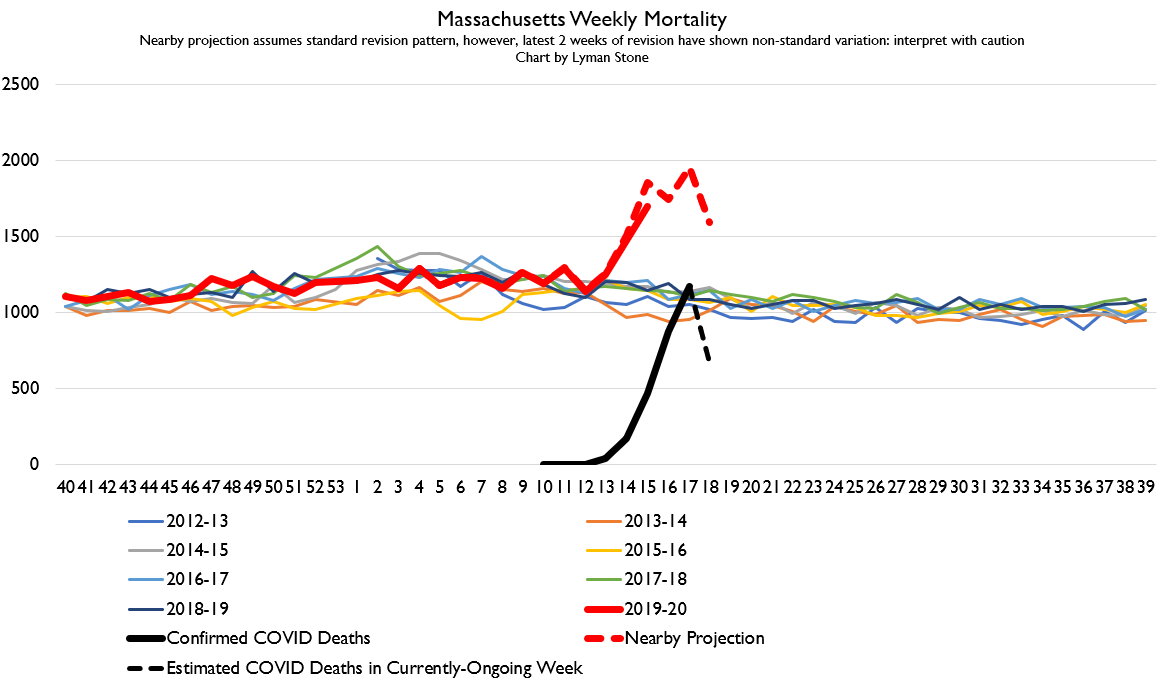
Here& #39;s Massachusetts. A week ago MA all-cause data looked pretty much fine. Revisions really did a number on it. Wonder how many other states are gonna be like that.
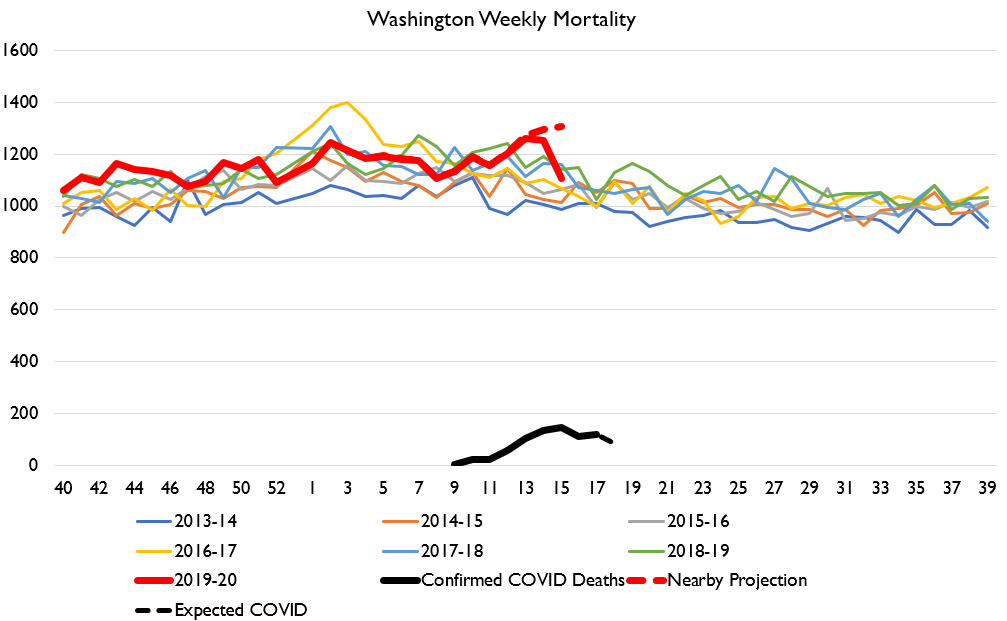
An interesting one is Washington. One of the earliest outbreaks. Not a huge death spike.... but no sign of a rapid fall-off in deaths either.
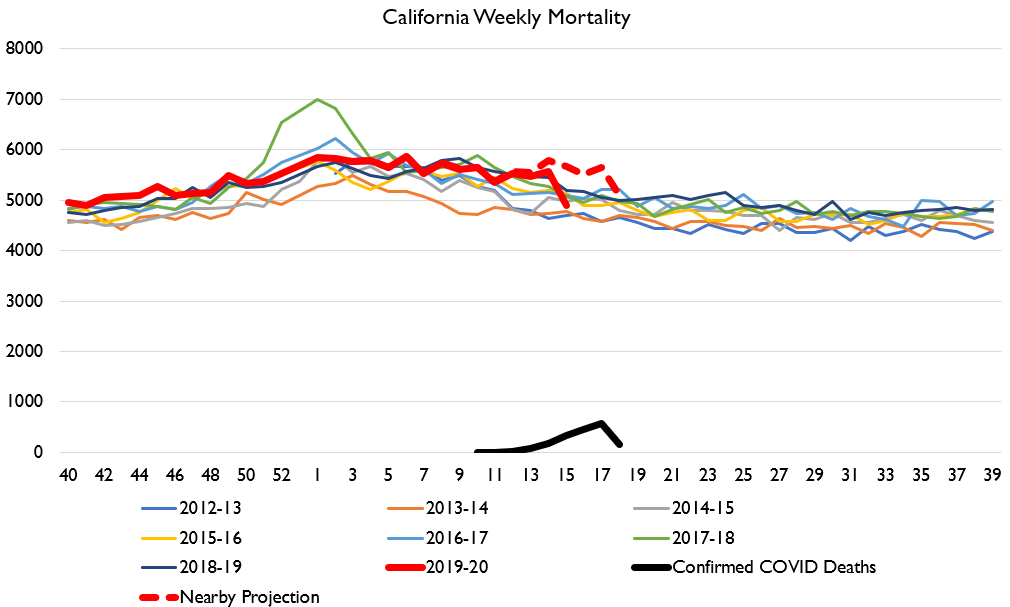
California has relatively poor-quality data reporting.... but once we account for usual revision patterns it does look like even lightly-hit California is gonna end up having a COVID-bump.
Most states don& #39;t have even nearly enough data to get at this stuff. But we are getting more and more states that are getting there.
As more states have enough data to tell us anything meaningful, a couple conclusions are arising:
1. Excess deaths probably equal or exceed confirmed COVID deaths
2. The "rapid decline" assumption on the back end is probably incorrect
3. There& #39;s HUUUUUGE regional variation
1. Excess deaths probably equal or exceed confirmed COVID deaths
2. The "rapid decline" assumption on the back end is probably incorrect
3. There& #39;s HUUUUUGE regional variation
In some states, the death spike will be a once-in-a-century-event. In other states, there won& #39;t be a spike at all. Most of this difference is not due to policy differences, but dumb luck: who got a couple superspreaders before the March 11 beginning of widespread social response.
I know that there& #39;s lots of people being like, "we have lots of policy heterogeneity" but tbh we don& #39;t. Almost all states initiated policies in the same narrow window of time, they mostly initiated the same policies.
Moreover, in almost every case, the thing policies were aimed at achieving, social distancing, had already been fully achieved before policies were in place.
The only major cases of heterogenous policymaking we have in the US are the Bay Area and Washington State....
The only major cases of heterogenous policymaking we have in the US are the Bay Area and Washington State....
But it also seems like those places also *just weren& #39;t hit as hard*. Their early responses were not actually *that* aggressive.
I would not say this is necessarily obvious.
However, I do wonder how much of California& #39;s experience in particular may relate to a genetic difference. I am keeping my eye on this line of research, as it could also explain China& #39;s experience. https://twitter.com/VictorishB123/status/1254613137262690305">https://twitter.com/Victorish...
However, I do wonder how much of California& #39;s experience in particular may relate to a genetic difference. I am keeping my eye on this line of research, as it could also explain China& #39;s experience. https://twitter.com/VictorishB123/status/1254613137262690305">https://twitter.com/Victorish...

 Read on Twitter