Premier League Set Pieces - Analysis
Short thread about dead ball situations, with the help of data and numbers by me; pictures and clips by @Zoltanknows
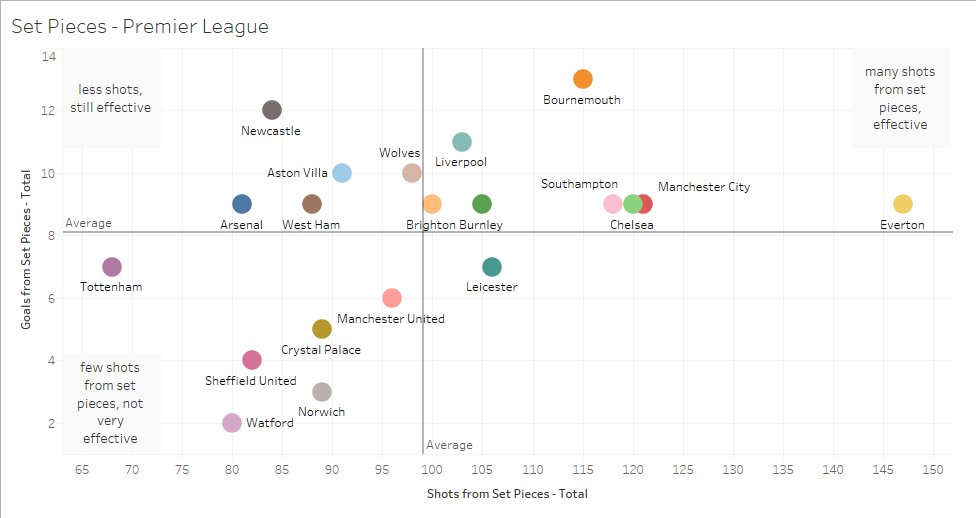
The first chart concerns the total amount of shots and goals each team attempted/scored following a set-piece.
Short thread about dead ball situations, with the help of data and numbers by me; pictures and clips by @Zoltanknows
The first chart concerns the total amount of shots and goals each team attempted/scored following a set-piece.
After taking a look at the first chart, we can already determine a few extremes:
Everton created 30 more shots from SP than any other team in the league
Bournemouth, Newcastle, and Liverpool scored the most goals
Spurs scored around the average despite having the fewest shots
Everton created 30 more shots from SP than any other team in the league
Bournemouth, Newcastle, and Liverpool scored the most goals
Spurs scored around the average despite having the fewest shots
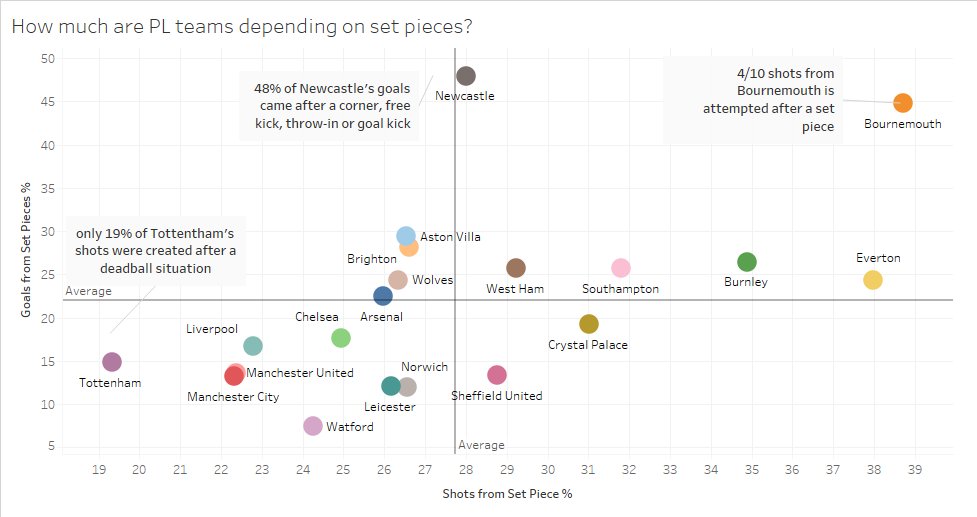
The second chart focuses on ratios rather than on pure numbers and shows how much the teams are depending on SP situations.
The first two teams popping up are again Newcastle and the Cherrys - with 45%+ of their goals coming from SP - they are head and shoulders above the rest.
The first two teams popping up are again Newcastle and the Cherrys - with 45%+ of their goals coming from SP - they are head and shoulders above the rest.
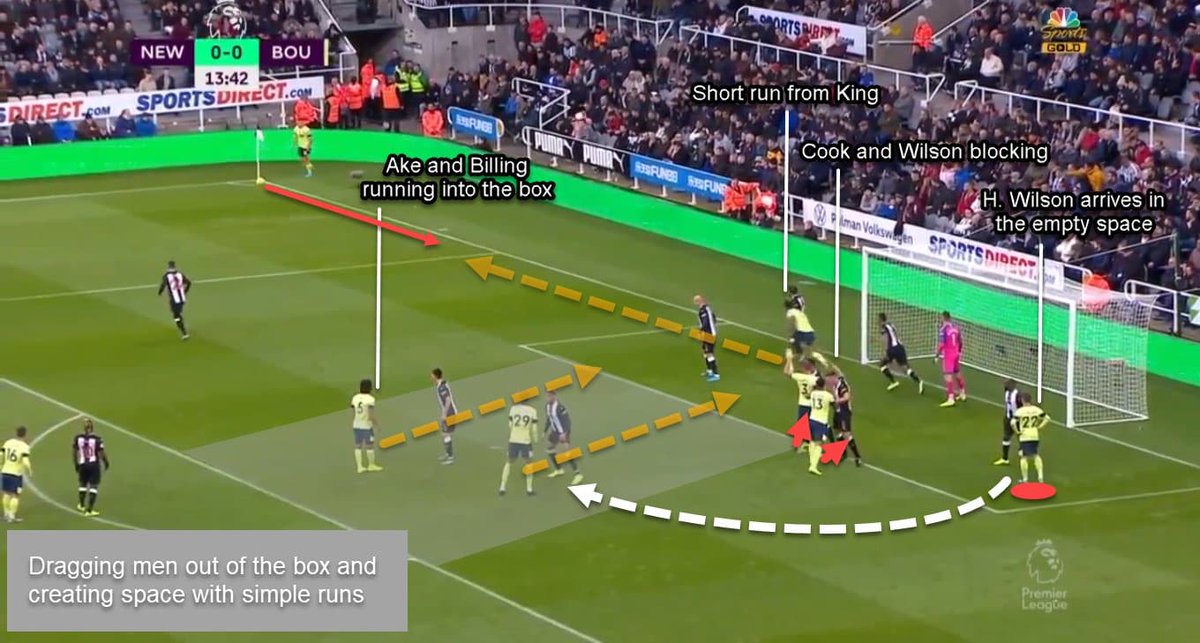
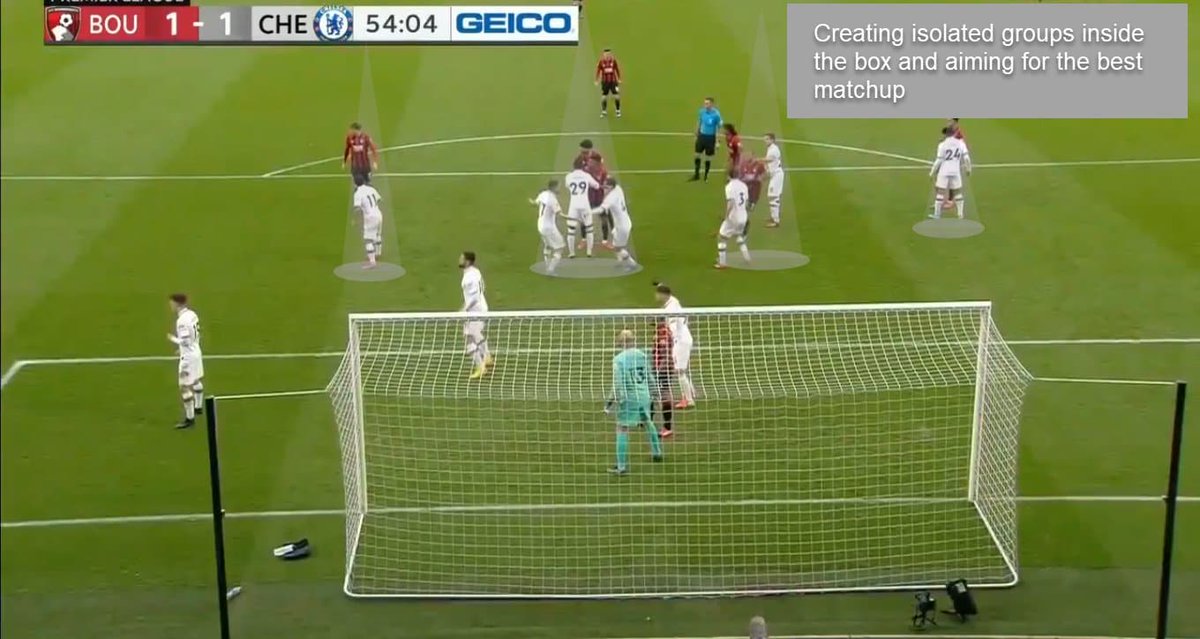
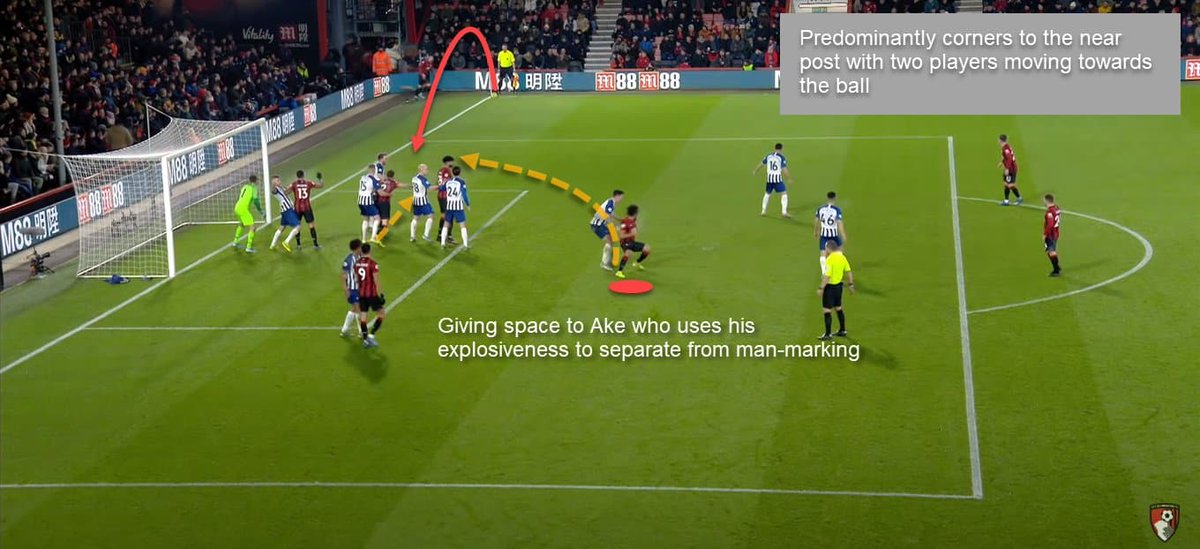
In the second part of the thread we wanted to focus on the corner kick routines of Bournemouth and what makes them dangerous inside the penalty area. The team ranks higher in created chances than the pure numbers would suggest.
Here’s why:
Here’s why:
Newcastle vs Bournemouth – Harry Wilson
Bournemouth vs Chelsea – Jefferson Lerma
Bournemouth vs Brighton - Pascal Gross (Own Goal)

 Read on Twitter