RSI Simplified https://abs.twimg.com/emoji/v2/... draggable="false" alt="📒" title="Ledger" aria-label="Emoji: Ledger">
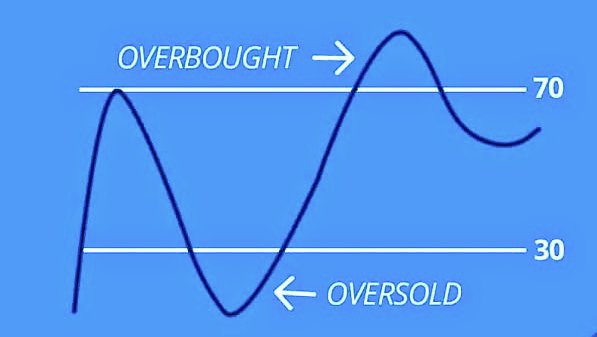
 https://abs.twimg.com/emoji/v2/... draggable="false" alt="🔵" title="Blue circle" aria-label="Emoji: Blue circle">Its one of the leading indicator which measures the strength of any move in price
 https://abs.twimg.com/emoji/v2/... draggable="false" alt="🔵" title="Blue circle" aria-label="Emoji: Blue circle">Its an oscillator which moves between two extremes (0—100)
 https://abs.twimg.com/emoji/v2/... draggable="false" alt="🔵" title="Blue circle" aria-label="Emoji: Blue circle">Reading above 70 indicates overbought while below 30 indicates oversold sentiments
1/n
#StockMarket #Technicals
1/n
#StockMarket #Technicals
RSI Simplified https://abs.twimg.com/emoji/v2/... draggable="false" alt="📒" title="Ledger" aria-label="Emoji: Ledger">
How to trade with #RSI
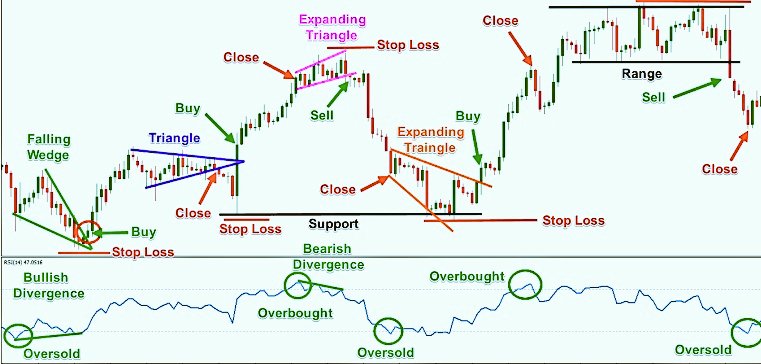
 https://abs.twimg.com/emoji/v2/... draggable="false" alt="🔵" title="Blue circle" aria-label="Emoji: Blue circle">50—70 is as zone where trades buy the #stocks by considering other factors (BO, Divergences)
 https://abs.twimg.com/emoji/v2/... draggable="false" alt="🔵" title="Blue circle" aria-label="Emoji: Blue circle">Below 40 is weakness zone where some traders do selling
 https://abs.twimg.com/emoji/v2/... draggable="false" alt="🔵" title="Blue circle" aria-label="Emoji: Blue circle">40-50 is an indecision zone where most of the traders avoid trading & wait for BO
How to trade with #RSI
RSI Simplified https://abs.twimg.com/emoji/v2/... draggable="false" alt="📒" title="Ledger" aria-label="Emoji: Ledger">
Trading Divergences https://abs.twimg.com/emoji/v2/... draggable="false" alt="📈" title="Chart with upwards trend" aria-label="Emoji: Chart with upwards trend">
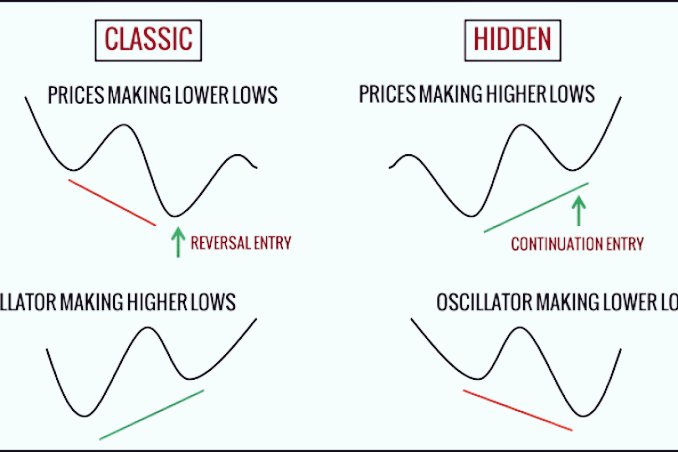
 https://abs.twimg.com/emoji/v2/... draggable="false" alt="🔵" title="Blue circle" aria-label="Emoji: Blue circle">There are 2 type of divergences occurs b/w RSI&Price (Bullish & Bearish)
 https://abs.twimg.com/emoji/v2/... draggable="false" alt="🔵" title="Blue circle" aria-label="Emoji: Blue circle">In Bullish Divergence RSI makes HH-HL while price doesn& #39;t do it
 https://abs.twimg.com/emoji/v2/... draggable="false" alt="🔵" title="Blue circle" aria-label="Emoji: Blue circle">In Bearish Divergence RDI makes LH-LL while price doesn& #39;t do it
3/n
#StockMarket #Technicals
Trading Divergences
3/n
#StockMarket #Technicals
RSI Simplified https://abs.twimg.com/emoji/v2/... draggable="false" alt="📒" title="Ledger" aria-label="Emoji: Ledger">
Trading Checklist for RSI
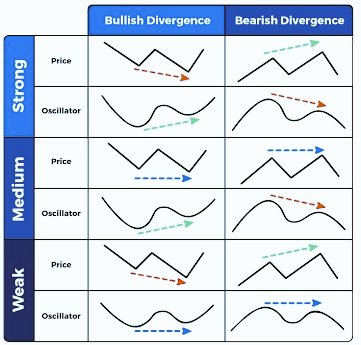
 https://abs.twimg.com/emoji/v2/... draggable="false" alt="🔵" title="Blue circle" aria-label="Emoji: Blue circle"> Buy on bullish or positive divergences
 https://abs.twimg.com/emoji/v2/... draggable="false" alt="🔵" title="Blue circle" aria-label="Emoji: Blue circle"> Sell on Bearish or negative divergences
 https://abs.twimg.com/emoji/v2/... draggable="false" alt="🔵" title="Blue circle" aria-label="Emoji: Blue circle"> Wait if divergence is very low in nature
 https://abs.twimg.com/emoji/v2/... draggable="false" alt="🔵" title="Blue circle" aria-label="Emoji: Blue circle"> Remember more the divergence better the success rate of trade
4/n
#StockMarket #Technicals
Trading Checklist for RSI
4/n
#StockMarket #Technicals
RSI Simplified https://abs.twimg.com/emoji/v2/... draggable="false" alt="📒" title="Ledger" aria-label="Emoji: Ledger">
 https://abs.twimg.com/emoji/v2/... draggable="false" alt="📈" title="Chart with upwards trend" aria-label="Emoji: Chart with upwards trend">Case Study
 https://abs.twimg.com/emoji/v2/... draggable="false" alt="💡" title="Electric light bulb" aria-label="Emoji: Electric light bulb">
 https://abs.twimg.com/emoji/v2/... draggable="false" alt="🔵" title="Blue circle" aria-label="Emoji: Blue circle">We can see RSI bearish or negative divergence in the pic
 https://abs.twimg.com/emoji/v2/... draggable="false" alt="🔵" title="Blue circle" aria-label="Emoji: Blue circle">RSI cont. making LL-LH pattern while price is making HH-HL pattern (Selling or Profit Booking zone)
 https://abs.twimg.com/emoji/v2/... draggable="false" alt="🔵" title="Blue circle" aria-label="Emoji: Blue circle">It is often considered as fake move as well in ST charts
End of Thread
Thanks https://abs.twimg.com/emoji/v2/... draggable="false" alt="🙏" title="Folded hands" aria-label="Emoji: Folded hands">
End of Thread
Thanks

 Read on Twitter
 https://abs.twimg.com/emoji/v2/... draggable="false" alt="🔵" title="Blue circle" aria-label="Emoji: Blue circle">Its one of the leading indicator which measures the strength of any move in pricehttps://abs.twimg.com/emoji/v2/... draggable="false" alt="🔵" title="Blue circle" aria-label="Emoji: Blue circle">Its an oscillator which moves between two extremes (0—100) https://abs.twimg.com/emoji/v2/... draggable="false" alt="🔵" title="Blue circle" aria-label="Emoji: Blue circle">Reading above 70 indicates overbought while below 30 indicates oversold sentiments1/n #StockMarket #Technicals" title="RSI Simplifiedhttps://abs.twimg.com/emoji/v2/... draggable="false" alt="📒" title="Ledger" aria-label="Emoji: Ledger">https://abs.twimg.com/emoji/v2/... draggable="false" alt="🔵" title="Blue circle" aria-label="Emoji: Blue circle">Its one of the leading indicator which measures the strength of any move in pricehttps://abs.twimg.com/emoji/v2/... draggable="false" alt="🔵" title="Blue circle" aria-label="Emoji: Blue circle">Its an oscillator which moves between two extremes (0—100) https://abs.twimg.com/emoji/v2/... draggable="false" alt="🔵" title="Blue circle" aria-label="Emoji: Blue circle">Reading above 70 indicates overbought while below 30 indicates oversold sentiments1/n #StockMarket #Technicals" class="img-responsive" style="max-width:100%;"/>
 How to trade with #RSIhttps://abs.twimg.com/emoji/v2/... draggable="false" alt="🔵" title="Blue circle" aria-label="Emoji: Blue circle">50—70 is as zone where trades buy the #stocks by considering other factors (BO, Divergences)https://abs.twimg.com/emoji/v2/... draggable="false" alt="🔵" title="Blue circle" aria-label="Emoji: Blue circle">Below 40 is weakness zone where some traders do sellinghttps://abs.twimg.com/emoji/v2/... draggable="false" alt="🔵" title="Blue circle" aria-label="Emoji: Blue circle">40-50 is an indecision zone where most of the traders avoid trading & wait for BO" title="RSI Simplifiedhttps://abs.twimg.com/emoji/v2/... draggable="false" alt="📒" title="Ledger" aria-label="Emoji: Ledger">How to trade with #RSIhttps://abs.twimg.com/emoji/v2/... draggable="false" alt="🔵" title="Blue circle" aria-label="Emoji: Blue circle">50—70 is as zone where trades buy the #stocks by considering other factors (BO, Divergences)https://abs.twimg.com/emoji/v2/... draggable="false" alt="🔵" title="Blue circle" aria-label="Emoji: Blue circle">Below 40 is weakness zone where some traders do sellinghttps://abs.twimg.com/emoji/v2/... draggable="false" alt="🔵" title="Blue circle" aria-label="Emoji: Blue circle">40-50 is an indecision zone where most of the traders avoid trading & wait for BO" class="img-responsive" style="max-width:100%;"/>
 Trading Divergenceshttps://abs.twimg.com/emoji/v2/... draggable="false" alt="📈" title="Chart with upwards trend" aria-label="Emoji: Chart with upwards trend">https://abs.twimg.com/emoji/v2/... draggable="false" alt="🔵" title="Blue circle" aria-label="Emoji: Blue circle">There are 2 type of divergences occurs b/w RSI&Price (Bullish & Bearish) https://abs.twimg.com/emoji/v2/... draggable="false" alt="🔵" title="Blue circle" aria-label="Emoji: Blue circle">In Bullish Divergence RSI makes HH-HL while price doesn& #39;t do it https://abs.twimg.com/emoji/v2/... draggable="false" alt="🔵" title="Blue circle" aria-label="Emoji: Blue circle">In Bearish Divergence RDI makes LH-LL while price doesn& #39;t do it3/n #StockMarket #Technicals" title="RSI Simplifiedhttps://abs.twimg.com/emoji/v2/... draggable="false" alt="📒" title="Ledger" aria-label="Emoji: Ledger">Trading Divergenceshttps://abs.twimg.com/emoji/v2/... draggable="false" alt="📈" title="Chart with upwards trend" aria-label="Emoji: Chart with upwards trend">https://abs.twimg.com/emoji/v2/... draggable="false" alt="🔵" title="Blue circle" aria-label="Emoji: Blue circle">There are 2 type of divergences occurs b/w RSI&Price (Bullish & Bearish) https://abs.twimg.com/emoji/v2/... draggable="false" alt="🔵" title="Blue circle" aria-label="Emoji: Blue circle">In Bullish Divergence RSI makes HH-HL while price doesn& #39;t do it https://abs.twimg.com/emoji/v2/... draggable="false" alt="🔵" title="Blue circle" aria-label="Emoji: Blue circle">In Bearish Divergence RDI makes LH-LL while price doesn& #39;t do it3/n #StockMarket #Technicals" class="img-responsive" style="max-width:100%;"/>
 Trading Checklist for RSIhttps://abs.twimg.com/emoji/v2/... draggable="false" alt="🔵" title="Blue circle" aria-label="Emoji: Blue circle"> Buy on bullish or positive divergenceshttps://abs.twimg.com/emoji/v2/... draggable="false" alt="🔵" title="Blue circle" aria-label="Emoji: Blue circle"> Sell on Bearish or negative divergenceshttps://abs.twimg.com/emoji/v2/... draggable="false" alt="🔵" title="Blue circle" aria-label="Emoji: Blue circle"> Wait if divergence is very low in naturehttps://abs.twimg.com/emoji/v2/... draggable="false" alt="🔵" title="Blue circle" aria-label="Emoji: Blue circle"> Remember more the divergence better the success rate of trade4/n #StockMarket #Technicals" title="RSI Simplifiedhttps://abs.twimg.com/emoji/v2/... draggable="false" alt="📒" title="Ledger" aria-label="Emoji: Ledger">Trading Checklist for RSIhttps://abs.twimg.com/emoji/v2/... draggable="false" alt="🔵" title="Blue circle" aria-label="Emoji: Blue circle"> Buy on bullish or positive divergenceshttps://abs.twimg.com/emoji/v2/... draggable="false" alt="🔵" title="Blue circle" aria-label="Emoji: Blue circle"> Sell on Bearish or negative divergenceshttps://abs.twimg.com/emoji/v2/... draggable="false" alt="🔵" title="Blue circle" aria-label="Emoji: Blue circle"> Wait if divergence is very low in naturehttps://abs.twimg.com/emoji/v2/... draggable="false" alt="🔵" title="Blue circle" aria-label="Emoji: Blue circle"> Remember more the divergence better the success rate of trade4/n #StockMarket #Technicals" class="img-responsive" style="max-width:100%;"/>
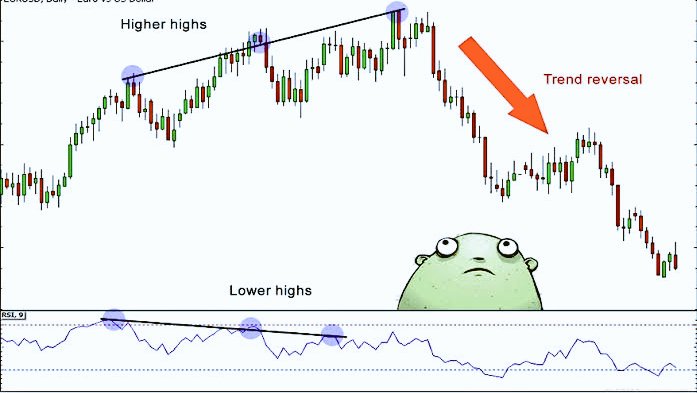 https://abs.twimg.com/emoji/v2/... draggable="false" alt="📈" title="Chart with upwards trend" aria-label="Emoji: Chart with upwards trend">Case Studyhttps://abs.twimg.com/emoji/v2/... draggable="false" alt="💡" title="Electric light bulb" aria-label="Emoji: Electric light bulb">https://abs.twimg.com/emoji/v2/... draggable="false" alt="🔵" title="Blue circle" aria-label="Emoji: Blue circle">We can see RSI bearish or negative divergence in the pichttps://abs.twimg.com/emoji/v2/... draggable="false" alt="🔵" title="Blue circle" aria-label="Emoji: Blue circle">RSI cont. making LL-LH pattern while price is making HH-HL pattern (Selling or Profit Booking zone) https://abs.twimg.com/emoji/v2/... draggable="false" alt="🔵" title="Blue circle" aria-label="Emoji: Blue circle">It is often considered as fake move as well in ST chartsEnd of ThreadThankshttps://abs.twimg.com/emoji/v2/... draggable="false" alt="🙏" title="Folded hands" aria-label="Emoji: Folded hands">" title="RSI Simplifiedhttps://abs.twimg.com/emoji/v2/... draggable="false" alt="📒" title="Ledger" aria-label="Emoji: Ledger">https://abs.twimg.com/emoji/v2/... draggable="false" alt="📈" title="Chart with upwards trend" aria-label="Emoji: Chart with upwards trend">Case Studyhttps://abs.twimg.com/emoji/v2/... draggable="false" alt="💡" title="Electric light bulb" aria-label="Emoji: Electric light bulb">https://abs.twimg.com/emoji/v2/... draggable="false" alt="🔵" title="Blue circle" aria-label="Emoji: Blue circle">We can see RSI bearish or negative divergence in the pichttps://abs.twimg.com/emoji/v2/... draggable="false" alt="🔵" title="Blue circle" aria-label="Emoji: Blue circle">RSI cont. making LL-LH pattern while price is making HH-HL pattern (Selling or Profit Booking zone) https://abs.twimg.com/emoji/v2/... draggable="false" alt="🔵" title="Blue circle" aria-label="Emoji: Blue circle">It is often considered as fake move as well in ST chartsEnd of ThreadThankshttps://abs.twimg.com/emoji/v2/... draggable="false" alt="🙏" title="Folded hands" aria-label="Emoji: Folded hands">" class="img-responsive" style="max-width:100%;"/>


