
 Read on Twitter
(1/) Take a look at my latest post on #Covid_19. https://medium.com/@donnellymjd/using-covid-19-case-data-alone-will-fool-you-c64116b71fc1
https://medium.com/@donnelly... href="https://twitter.com/kevin">@kevin Systrom& #39;s http://rt.live"> http://rt.live is a great effort to estimate the reproduction value of the current epidemic, but it makes a key mistake by relying on case data alone.
 @kevin Systrom& #39;s http://rt.live is a great effort to estimate the reproduction value of the current epidemic, but it makes a key mistake by relying on case data alone." title="(1/) Take a look at my latest post on #Covid_19. https://medium.com/@donnelly... href="https://twitter.com/kevin">@kevin Systrom& #39;s http://rt.live is a great effort to estimate the reproduction value of the current epidemic, but it makes a key mistake by relying on case data alone." class="img-responsive" style="max-width:100%;"/>
(2/) The model published on http://rt.live"> http://rt.live suggests that the lockdown in NY has stopped working. That is almost certainly not true. Why? This model uses unadjusted positive test data alone to draw its estimates.
 The model published on http://rt.live suggests that the lockdown in NY has stopped working. That is almost certainly not true. Why? This model uses unadjusted positive test data alone to draw its estimates.")
(3/) If you look just at the positive test data like in this chart from @Gothamist, things look like they& #39;re getting worse in New York. BUT this is not the full picture...
 If you look just at the positive test data like in this chart from @Gothamist, things look like they& #39;re getting worse in New York. BUT this is not the full picture...")
(4/) At the same time that positive tests are rising in NY, so are the total number of tests conducted every day.
 At the same time that positive tests are rising in NY, so are the total number of tests conducted every day.")
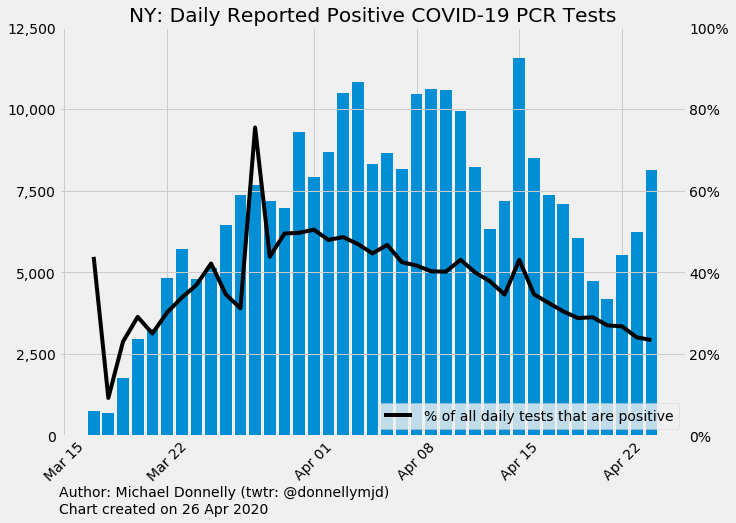
(5/) To help understand what this means, we can look at the number of positive test results for every test given.
As you can see, this rate has been going down steadily over April, consistent with the view that the ongoing lockdown is working to slow the virus.
 To help understand what this means, we can look at the number of positive test results for every test given. As you can see, this rate has been going down steadily over April, consistent with the view that the ongoing lockdown is working to slow the virus.")
As you can see, this rate has been going down steadily over April, consistent with the view that the ongoing lockdown is working to slow the virus.
(6/) Even this approach using positive tests/total tests is inconclusive. Declines can be caused by testing more healthy people and increases can be caused by reduced testing...
(7/) Randomized population testing is the gold standard that we should be pursuing. We don& #39;t have that yet in the US. So, in the meantime, we should be careful to use existing data carefully to avoid making bad decisions.
(8/) In a future article, I will address another way to estimate the reproduction factor with several advantages over this approach.
Additionally, this other method identifies the basic reproduction factor in NY as much higher than http://rt.live"> http://rt.live & #39;s estimate.
Additionally, this other method identifies the basic reproduction factor in NY as much higher than http://rt.live"> http://rt.live & #39;s estimate.


