Ever wondered how paleoclimate research arrives at˚C estimates for eras millions of years ago? I did. And here& #39;s the answer. In 16 minutes. Very efficient, me likes. https://www.youtube.com/watch?v=v0dgJ4JMNrE
Related">https://www.youtube.com/watch... to a set standard is: amount of heavy isotopes ( https://abs.twimg.com/emoji/v2/... draggable="false" alt="⚛️" title="Atom symbol" aria-label="Emoji: Atom symbol">w/ more neutrons) in molecules.
Related">https://www.youtube.com/watch... to a set standard is: amount of heavy isotopes (
I& #39;ll add more tweets as I figure out the answer to my original question that set me on this quest:
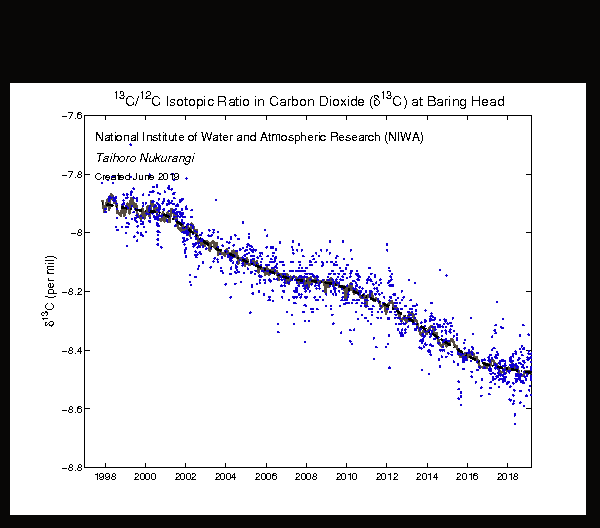
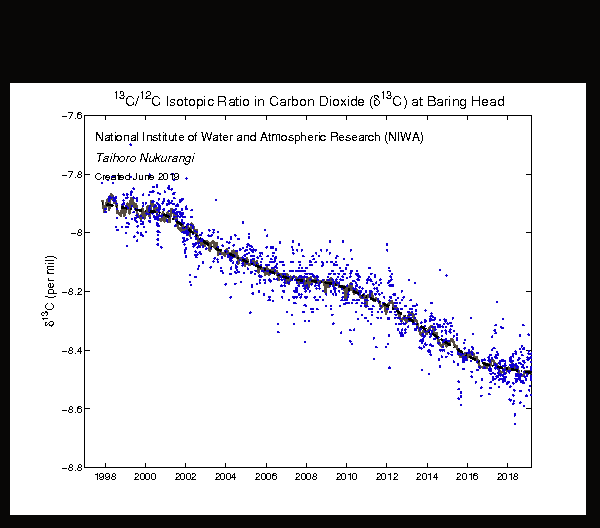
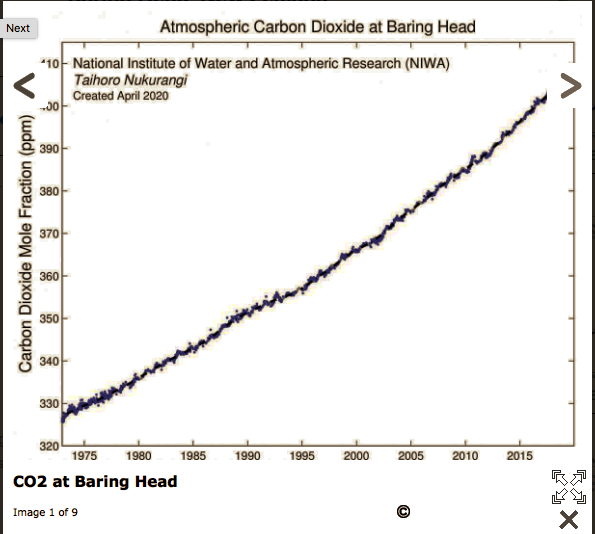
. @niwa_nz monitors δ13CO2 ratio to 12CO2, heavy vs light isotope https://niwa.co.nz/atmosphere/our-data/trace-gas-plots/carbon-dioxide#">https://niwa.co.nz/atmospher... It decreases, but lately, the rate of decrease has slowed https://abs.twimg.com/emoji/v2/... draggable="false" alt="🧐" title="Face with monocle" aria-label="Emoji: Face with monocle">And that& #39;s my quest for today
 https://abs.twimg.com/emoji/v2/... draggable="false" alt="🖖" title="Raised hand with part between middle and ring fingers" aria-label="Emoji: Raised hand with part between middle and ring fingers">
. @niwa_nz monitors δ13CO2 ratio to 12CO2, heavy vs light isotope https://niwa.co.nz/atmosphere/our-data/trace-gas-plots/carbon-dioxide#">https://niwa.co.nz/atmospher... It decreases, but lately, the rate of decrease has slowed
A bit of the first confusion over the graph and text by NIWA has lifted. ATM, I interpret the graph as depicting a decreasing number of 13CO2 in the atmosphere, atmo, compared to 12CO2.
But it might be the exact opposite https://abs.twimg.com/emoji/v2/... draggable="false" alt="🤷♀️" title="Woman shrugging" aria-label="Emoji: Woman shrugging">As the video says: ++˚C = ++heavy isotopes in the atmo.
But it might be the exact opposite
Whether the decreasing curve means --13CO2 or ++13CO2, I& #39;ll find out. But the slowdown has happened before. Between 2007 and 2011. Tho, it& #39;s got nothing to do with CO2 rise.
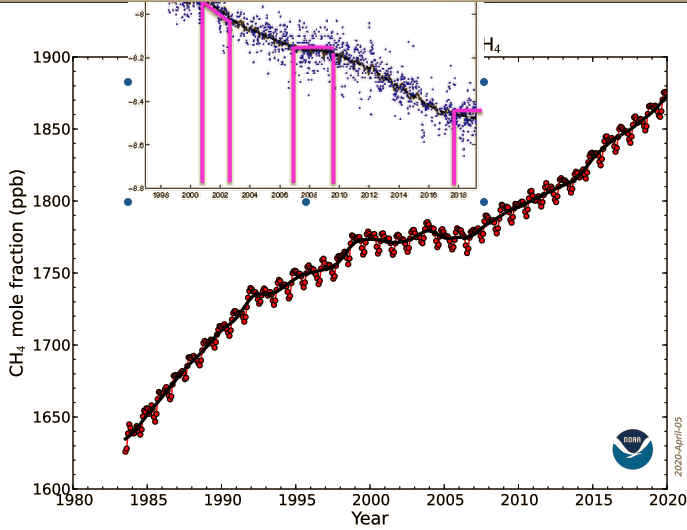
That timespan of 5 years corresponds to the CH4 curve flattening for 7 years until 2007. A late reaction?
That timespan of 5 years corresponds to the CH4 curve flattening for 7 years until 2007. A late reaction?
Plants don& #39;t use much 13CO2. Some use -26‰ 13CO2, some -12‰.
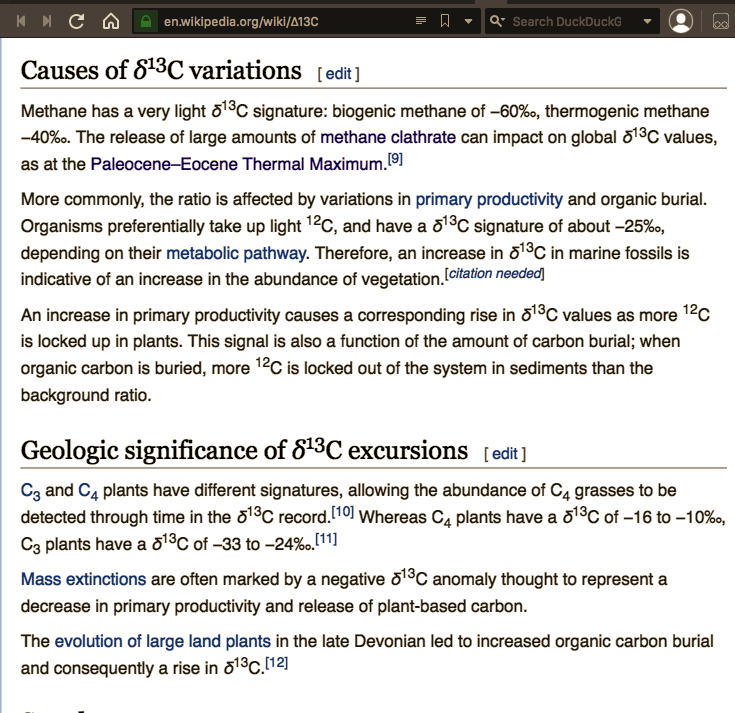
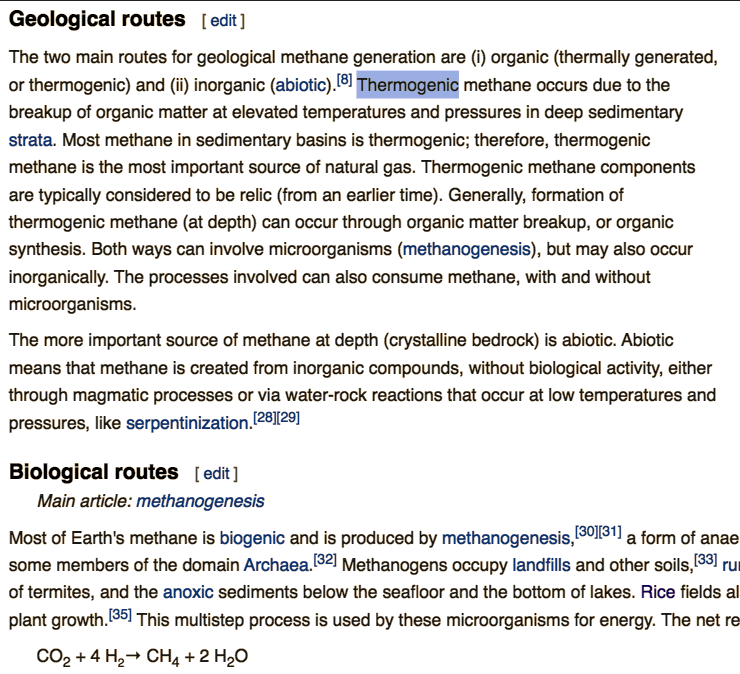
Another factor is CH4. Which contains very little 13C: biogenic -60‰ and thermogenic -40‰. Thermo. is fossil gas; while bio. is cow burps or what comes up from landfills or rice fields.
 https://abs.twimg.com/emoji/v2/... draggable="false" alt="➡️" title="Rightwards arrow" aria-label="Emoji: Rightwards arrow">--13CO2 w/ more ff-gas
 https://abs.twimg.com/emoji/v2/... draggable="false" alt="🔥" title="Fire" aria-label="Emoji: Fire">?
Another factor is CH4. Which contains very little 13C: biogenic -60‰ and thermogenic -40‰. Thermo. is fossil gas; while bio. is cow burps or what comes up from landfills or rice fields.
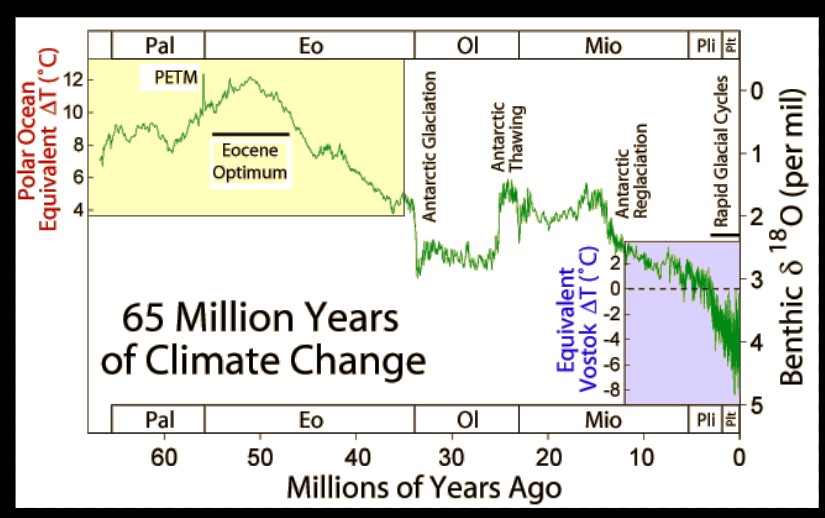
As I progress in my quest (I hope), I turn to the Paleocene–Eocene Thermal Maximum, PETM: a sudden 5-8˚C rise, lasting 200k yrs 55mio yrs ago, with a corresponding spike in δ13C found in proxies(probes).
I take it as 1 reason why IPCC invented RCP8.5, the high emissions scenario
I take it as 1 reason why IPCC invented RCP8.5, the high emissions scenario
Off-topic: I like RCP8.5. It& #39;s an extreme and extremes trigger our curiosity https://abs.twimg.com/emoji/v2/... draggable="false" alt="🤷♀️" title="Woman shrugging" aria-label="Emoji: Woman shrugging">Like the extreme flattening of 13CO2 triggered mine. W/o it, I& #39;d not have gone on today& #39;s quest.
A similar trigger might& #39;ve caused scientists to look @ climate refugees in RCP8.5 https://twitter.com/anlomedad/status/1219198171076857857">https://twitter.com/anlomedad...
A similar trigger might& #39;ve caused scientists to look @ climate refugees in RCP8.5 https://twitter.com/anlomedad/status/1219198171076857857">https://twitter.com/anlomedad...
Anyway. I take the heated debate around RCP8.5 as a sign for hubris in those opposing it. They& #39;re wantonly blind to its various benefits, eg relating paleoclimate research to contemporary impact research and the trigger / the psychology of research.
Or they drive a hidden agenda.
Or they drive a hidden agenda.
Back on topic https://twitter.com/anlomedad/status/1254300800064598017">https://twitter.com/anlomedad... IMO, the downward trend does mean: less 13CO2 or more 12CO2. Or both.
Why then was/is the curve flattening? What drives the trend? Seems counter intuitive in a warming climate bc warmer oceans release the heavier 13CO2 with increasing ease.
Why then was/is the curve flattening? What drives the trend? Seems counter intuitive in a warming climate bc warmer oceans release the heavier 13CO2 with increasing ease.
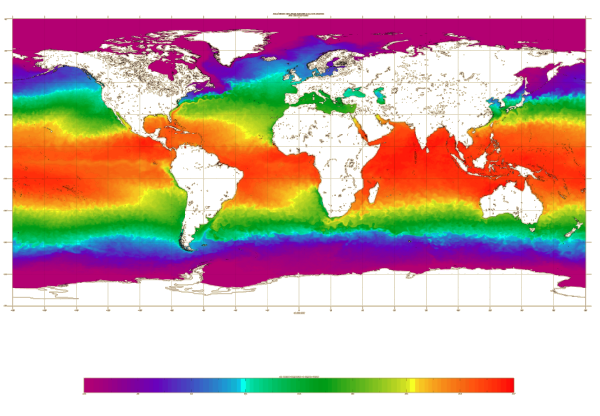
Are oceans warming? Yes, with regional differences. The pic shows ˚C on April 25 https://www.ospo.noaa.gov/Products/ocean/sst/contour/
the">https://www.ospo.noaa.gov/Products/... ˚C scale is -2 to 31.7˚C.
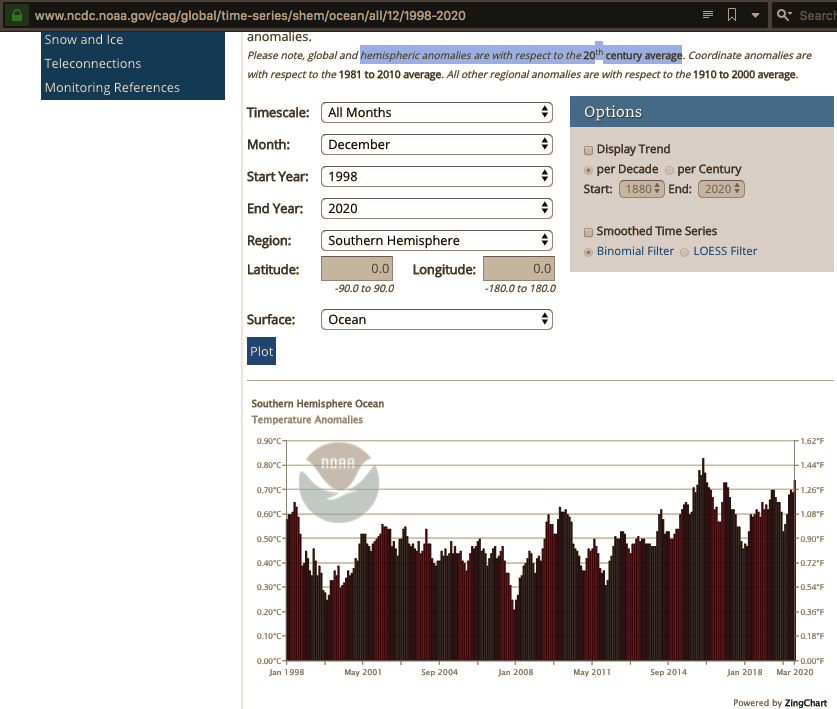
At https://www.ncdc.noaa.gov/cag/global/time-series/nhem/ocean/all/12/1998-2020">https://www.ncdc.noaa.gov/cag/globa... we see hemispheric monthly sea surface ˚C anomalies from 1998-2020 which can be related to the 13CO2 plot from NIWA
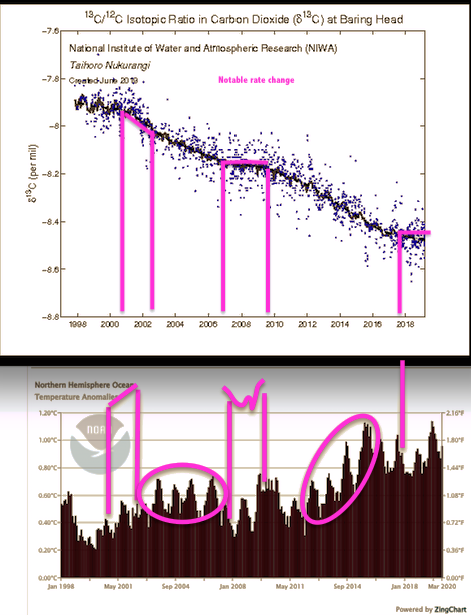
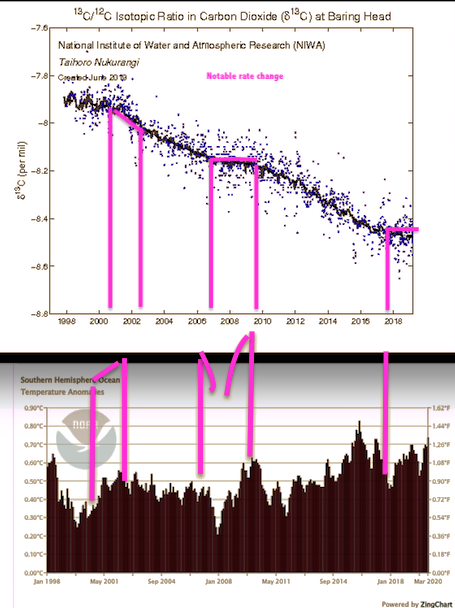
Tried to correlate the 3 notable 13CO2 phases with hemispheric temp anomalies. What do you say? Is the rate change conclusive with sea surface temperature changes? I don& #39;t see it. At least not considering rate of decrease and the profoundly differing temperature rises as circled
If the NIWA plot marks the beginning of each year and not mid-year (hope so), then the ENSO months don& #39;t correspond conclusively with 13CO2, either. Btw, clips with El Nino, El Nina months, and a clip of the total time series from 2003-2010 in this thread https://twitter.com/anlomedad/status/1254509352226107392">https://twitter.com/anlomedad...
I see dips in˚C that don& #39;t show in the 13CO2 plot. So if the 13CO2 plateau from Oct 2017 -June 2019(ff?) is not all due to sea surface temperature, what other reasons can I think of?
1) + 13CO2 = eg volcanic or clathrate
2) + 13CO2 = eg ff CH4
3) - 12CO2 via plant more uptake
1) + 13CO2 = eg volcanic or clathrate
2) + 13CO2 = eg ff CH4
3) - 12CO2 via plant more uptake
2) + 13CO2 =eg fossil CH4.
If fossil CH4 were the source, it wd be thermogenic CH4 released ~ 12 years earlier, and by 2017, when the plateau sets in, be transformed into 13CO2 and water. Ie emitted <= 2005. The other 13CO2 plateau at 2007-09 got emitted ~ 1997. Does it fit? Nope
If fossil CH4 were the source, it wd be thermogenic CH4 released ~ 12 years earlier, and by 2017, when the plateau sets in, be transformed into 13CO2 and water. Ie emitted <= 2005. The other 13CO2 plateau at 2007-09 got emitted ~ 1997. Does it fit? Nope
(Sorry for the graphs. It& #39;s not MS Paint, I swear https://abs.twimg.com/emoji/v2/... draggable="false" alt="😁" title="Grinning face with smiling eyes" aria-label="Emoji: Grinning face with smiling eyes">)
Superficially, it looks like a fit. But a slowdown of the 13CO2 decrease rate needs a steep rise in ff CH4 ~ 12 yrs prior. I can& #39;t see that.
And would tiny amounts of ppbillion versus ppmillion make a dent? I guess not.
Hm.
Superficially, it looks like a fit. But a slowdown of the 13CO2 decrease rate needs a steep rise in ff CH4 ~ 12 yrs prior. I can& #39;t see that.
And would tiny amounts of ppbillion versus ppmillion make a dent? I guess not.
Hm.
The eruption of Pinatubo 1991 could have released heavy CH4. NOAA& #39;s CH4 data show 1990-91 are a little higher with the occasional CH4 increase of 1.5 ppb/month. But it& #39;s a short stint in an otherwise rather even growth of ~ <= 1ppb /month.
ff CH4 is out https://abs.twimg.com/emoji/v2/... draggable="false" alt="🤷♀️" title="Woman shrugging" aria-label="Emoji: Woman shrugging">Now to option 1) and 3).
ff CH4 is out

 Read on Twitter
 And that& #39;s my quest for todayhttps://abs.twimg.com/emoji/v2/... draggable="false" alt="🖖" title="Raised hand with part between middle and ring fingers" aria-label="Emoji: Raised hand with part between middle and ring fingers">" title="I& #39;ll add more tweets as I figure out the answer to my original question that set me on this quest:. @niwa_nz monitors δ13CO2 ratio to 12CO2, heavy vs light isotope https://niwa.co.nz/atmospher... It decreases, but lately, the rate of decrease has slowedhttps://abs.twimg.com/emoji/v2/... draggable="false" alt="🧐" title="Face with monocle" aria-label="Emoji: Face with monocle">And that& #39;s my quest for todayhttps://abs.twimg.com/emoji/v2/... draggable="false" alt="🖖" title="Raised hand with part between middle and ring fingers" aria-label="Emoji: Raised hand with part between middle and ring fingers">">
 And that& #39;s my quest for todayhttps://abs.twimg.com/emoji/v2/... draggable="false" alt="🖖" title="Raised hand with part between middle and ring fingers" aria-label="Emoji: Raised hand with part between middle and ring fingers">" title="I& #39;ll add more tweets as I figure out the answer to my original question that set me on this quest:. @niwa_nz monitors δ13CO2 ratio to 12CO2, heavy vs light isotope https://niwa.co.nz/atmospher... It decreases, but lately, the rate of decrease has slowedhttps://abs.twimg.com/emoji/v2/... draggable="false" alt="🧐" title="Face with monocle" aria-label="Emoji: Face with monocle">And that& #39;s my quest for todayhttps://abs.twimg.com/emoji/v2/... draggable="false" alt="🖖" title="Raised hand with part between middle and ring fingers" aria-label="Emoji: Raised hand with part between middle and ring fingers">">
 As the video says: ++˚C = ++heavy isotopes in the atmo." title="A bit of the first confusion over the graph and text by NIWA has lifted. ATM, I interpret the graph as depicting a decreasing number of 13CO2 in the atmosphere, atmo, compared to 12CO2. But it might be the exact oppositehttps://abs.twimg.com/emoji/v2/... draggable="false" alt="🤷♀️" title="Woman shrugging" aria-label="Emoji: Woman shrugging">As the video says: ++˚C = ++heavy isotopes in the atmo.">
 As the video says: ++˚C = ++heavy isotopes in the atmo." title="A bit of the first confusion over the graph and text by NIWA has lifted. ATM, I interpret the graph as depicting a decreasing number of 13CO2 in the atmosphere, atmo, compared to 12CO2. But it might be the exact oppositehttps://abs.twimg.com/emoji/v2/... draggable="false" alt="🤷♀️" title="Woman shrugging" aria-label="Emoji: Woman shrugging">As the video says: ++˚C = ++heavy isotopes in the atmo.">

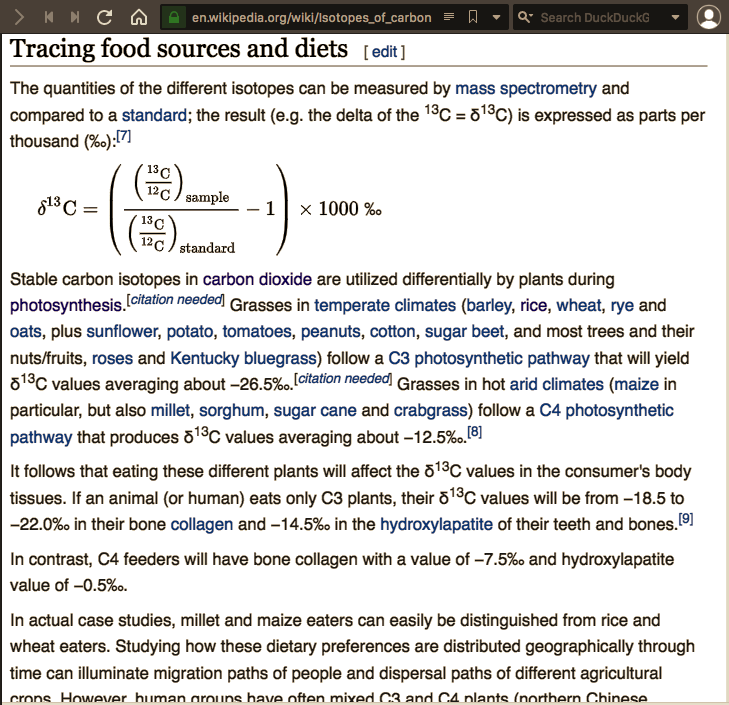 --13CO2 w/ more ff-gashttps://abs.twimg.com/emoji/v2/... draggable="false" alt="🔥" title="Fire" aria-label="Emoji: Fire">?" title="Plants don& #39;t use much 13CO2. Some use -26‰ 13CO2, some -12‰.Another factor is CH4. Which contains very little 13C: biogenic -60‰ and thermogenic -40‰. Thermo. is fossil gas; while bio. is cow burps or what comes up from landfills or rice fields.https://abs.twimg.com/emoji/v2/... draggable="false" alt="➡️" title="Rightwards arrow" aria-label="Emoji: Rightwards arrow">--13CO2 w/ more ff-gashttps://abs.twimg.com/emoji/v2/... draggable="false" alt="🔥" title="Fire" aria-label="Emoji: Fire">?">
 --13CO2 w/ more ff-gashttps://abs.twimg.com/emoji/v2/... draggable="false" alt="🔥" title="Fire" aria-label="Emoji: Fire">?" title="Plants don& #39;t use much 13CO2. Some use -26‰ 13CO2, some -12‰.Another factor is CH4. Which contains very little 13C: biogenic -60‰ and thermogenic -40‰. Thermo. is fossil gas; while bio. is cow burps or what comes up from landfills or rice fields.https://abs.twimg.com/emoji/v2/... draggable="false" alt="➡️" title="Rightwards arrow" aria-label="Emoji: Rightwards arrow">--13CO2 w/ more ff-gashttps://abs.twimg.com/emoji/v2/... draggable="false" alt="🔥" title="Fire" aria-label="Emoji: Fire">?">
 --13CO2 w/ more ff-gashttps://abs.twimg.com/emoji/v2/... draggable="false" alt="🔥" title="Fire" aria-label="Emoji: Fire">?" title="Plants don& #39;t use much 13CO2. Some use -26‰ 13CO2, some -12‰.Another factor is CH4. Which contains very little 13C: biogenic -60‰ and thermogenic -40‰. Thermo. is fossil gas; while bio. is cow burps or what comes up from landfills or rice fields.https://abs.twimg.com/emoji/v2/... draggable="false" alt="➡️" title="Rightwards arrow" aria-label="Emoji: Rightwards arrow">--13CO2 w/ more ff-gashttps://abs.twimg.com/emoji/v2/... draggable="false" alt="🔥" title="Fire" aria-label="Emoji: Fire">?">

 Like the extreme flattening of 13CO2 triggered mine. W/o it, I& #39;d not have gone on today& #39;s quest.A similar trigger might& #39;ve caused scientists to look @ climate refugees in RCP8.5 https://twitter.com/anlomedad..." title="Off-topic: I like RCP8.5. It& #39;s an extreme and extremes trigger our curiosityhttps://abs.twimg.com/emoji/v2/... draggable="false" alt="🤷♀️" title="Woman shrugging" aria-label="Emoji: Woman shrugging">Like the extreme flattening of 13CO2 triggered mine. W/o it, I& #39;d not have gone on today& #39;s quest.A similar trigger might& #39;ve caused scientists to look @ climate refugees in RCP8.5 https://twitter.com/anlomedad..." class="img-responsive" style="max-width:100%;"/>
