Thread: Your indicator can tell you about health and sentiment of any index or sector. Nifty trend analysis.
It would not be an exaggeration to say that moving averages is a widely used indicator in technical analysis. Let me use that to explain a concept. Let’s define trend based on moving average. If the price is above the moving average, the trend is bullish and vice-versa.
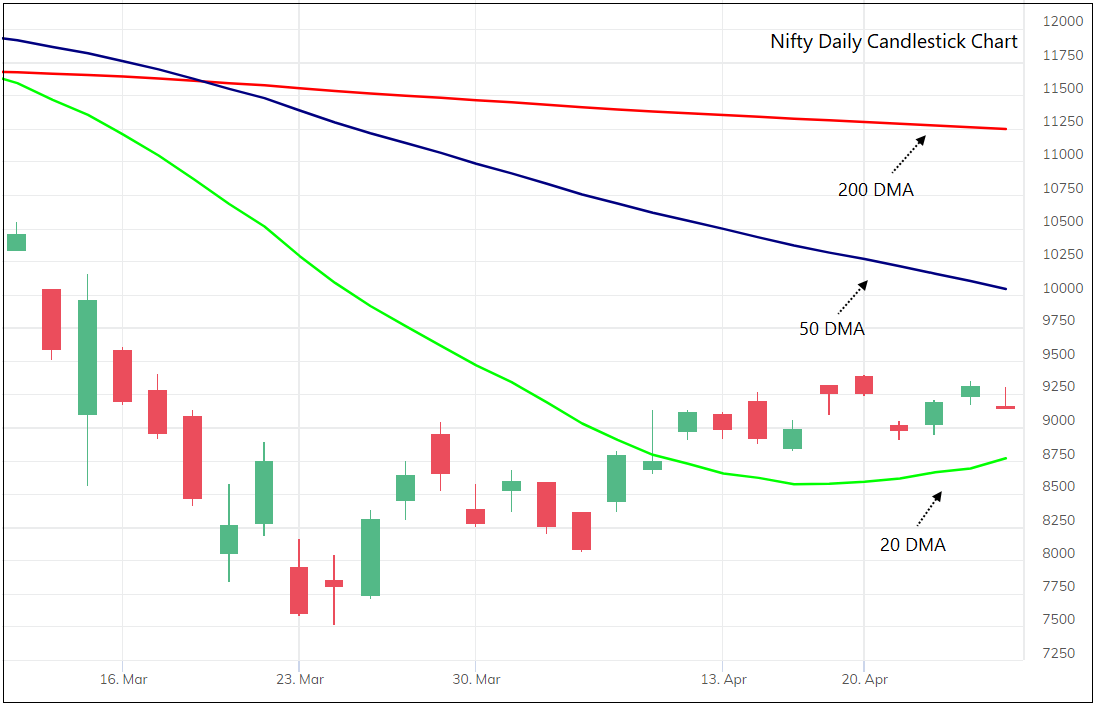
Here is the daily candlestick chart of Nifty 50 index.
Price is trading below 200-DMA – long-term trend is down.
Price is trading below 50-DMA - medium-term trend is down.
Price is trading above 20-DMA – short-term trend is up.
Price is trading below 200-DMA – long-term trend is down.
Price is trading below 50-DMA - medium-term trend is down.
Price is trading above 20-DMA – short-term trend is up.
It is apparent from the above chart that the trend of Nifty index is bearish from long-term perspective and bullish in the short-term as the price is above the 20-DMA.
But Nifty 50 index consists of 50 stocks. Is this happening because of few heavyweight stocks?
But Nifty 50 index consists of 50 stocks. Is this happening because of few heavyweight stocks?
We can calculate the number of stocks out of this universe that are trading above say the 200-day moving average.
If 25 stocks from the Nifty 50 are trading above 200-DMA, then the reading would be 50%.
If 25 stocks from the Nifty 50 are trading above 200-DMA, then the reading would be 50%.
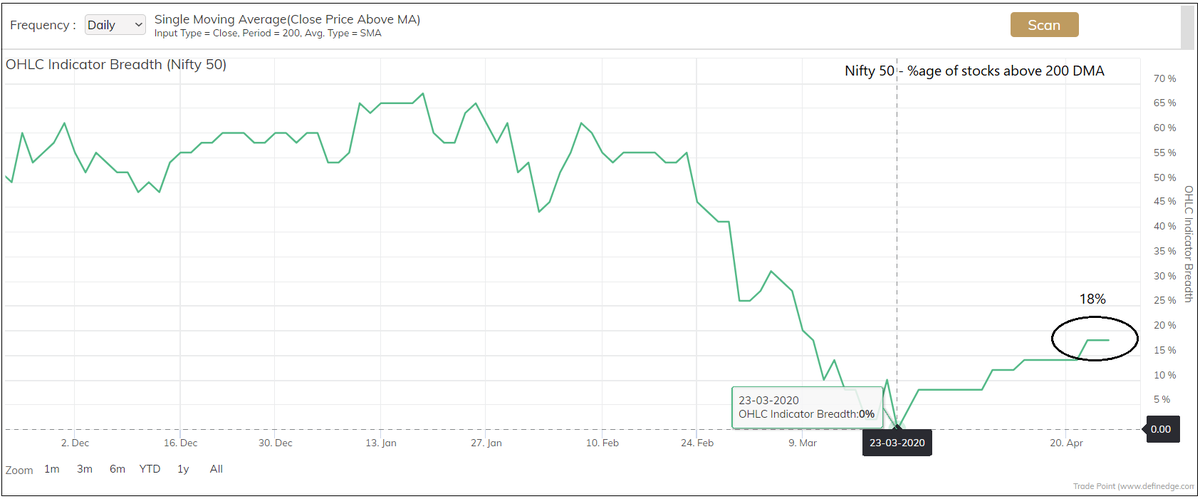
Have a look at the chart below. It captures the number of stocks from the Nifty 50 universe where the price is trading above the 200-day moving average.
The current reading is 18% which indicates that 82% of the Nifty 50 stocks are trading below their 200 DMA. This indicator was at 0% last month. In earlier instances of market crash, this indicator dropped below 5% in 2008 and 2012.
Let& #39;s look at a bigger universe - Nifty 500
Let& #39;s look at a bigger universe - Nifty 500
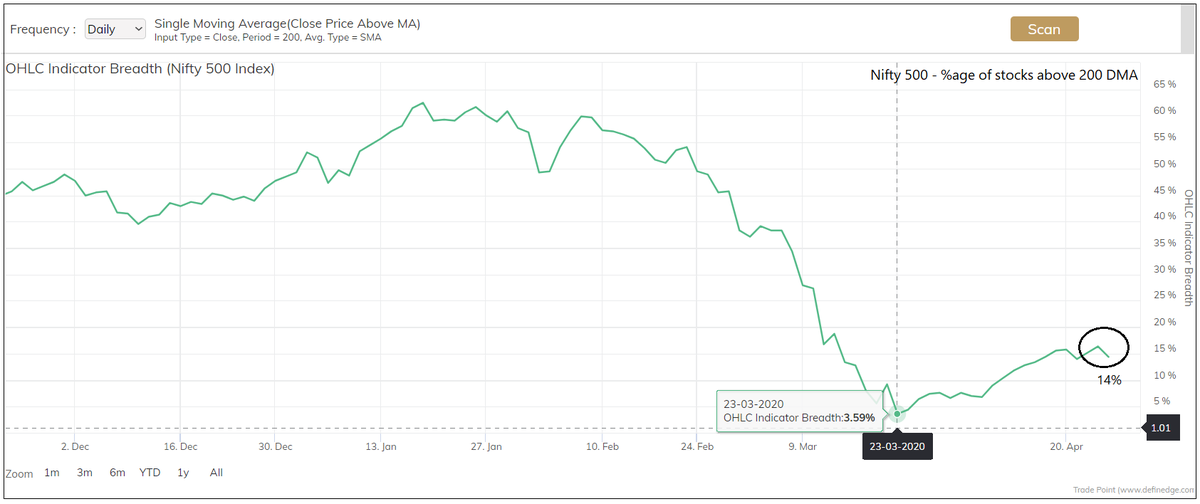
Below is a chart of Nifty 500.
It shows that only 20% of the stocks are trading above 200-DMA. Hence, long-term trend is bearish for a majority of stocks from the Nifty 500 universe.
It shows that only 20% of the stocks are trading above 200-DMA. Hence, long-term trend is bearish for a majority of stocks from the Nifty 500 universe.
So, what does this mean?
1 – Long-term trend is down across the stocks
2 – It could be around oversold levels
Let us dissect this this data further to gather more intelligence by looking at the picture across various indices and stocks.
1 – Long-term trend is down across the stocks
2 – It could be around oversold levels
Let us dissect this this data further to gather more intelligence by looking at the picture across various indices and stocks.
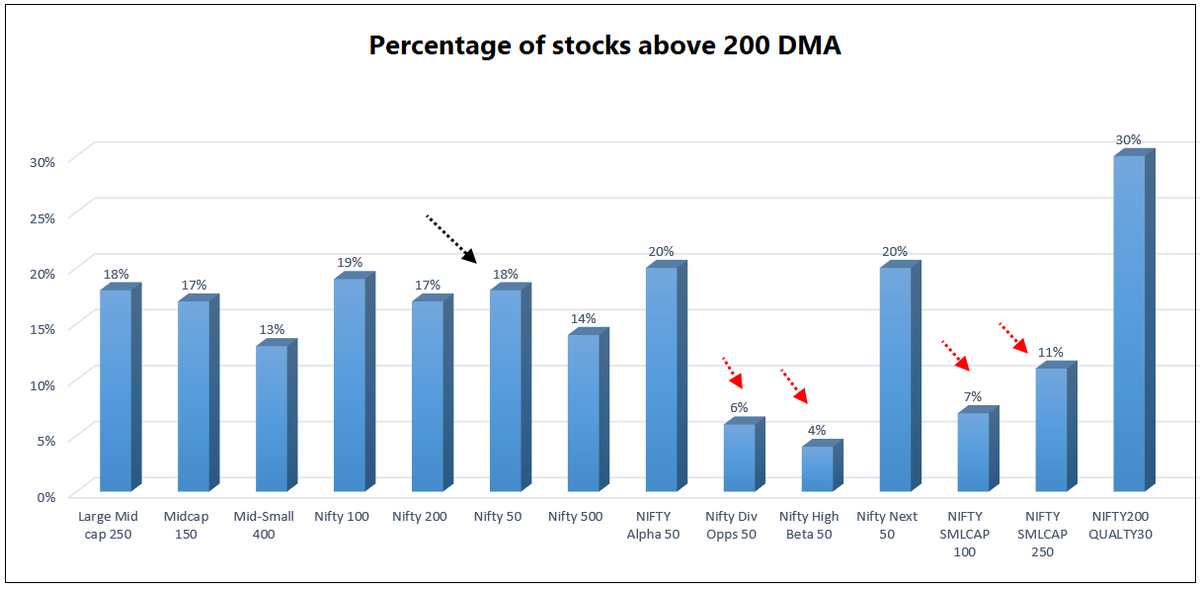
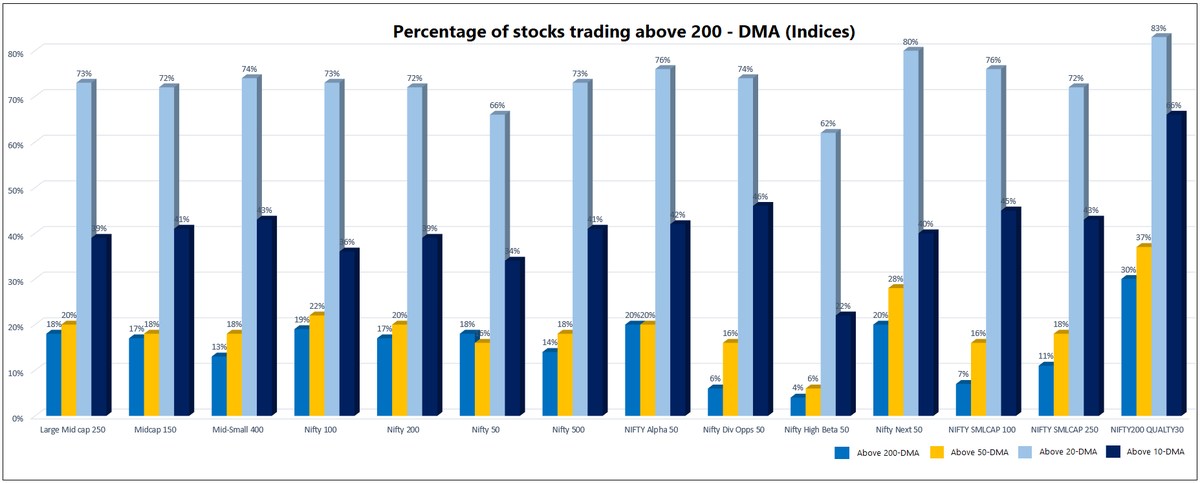
Below chart below captures the percentage of stocks trading above the 200-DMA among the various Nifty indices. Some indices are underperforming Nifty even when it bounced off the recent lows.
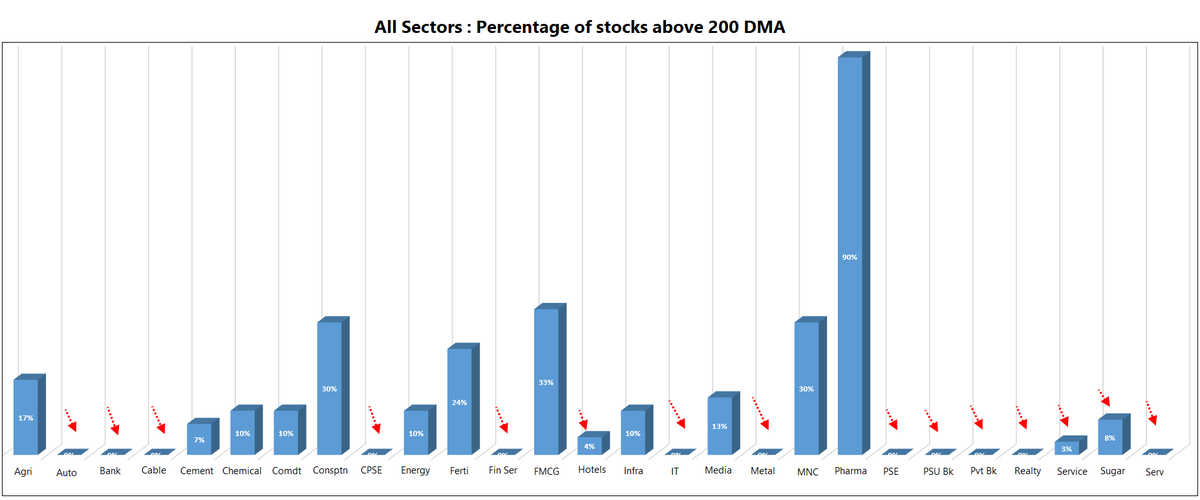
Let us also analyse the picture across different sectors.
In many sectors, all stocks are trading below their long-term average which is captured by a reading of 0%. On the other hand, stocks from sectors such as Pharma, FMCG and Consumption are relatively bullish.
In many sectors, all stocks are trading below their long-term average which is captured by a reading of 0%. On the other hand, stocks from sectors such as Pharma, FMCG and Consumption are relatively bullish.
We can do a similar study using the short-term & medium-term moving average. That will give us a better idea about the performance of indices & sectors during the recent rally. Below chart shows %age of stocks in different indices trading above 200-DMA, 50-DMA, 20-DMA and 10-DMA.
This study is popularly known as the breadth indicator. We are calculating the percentage of stocks trading above a given moving average. This reflects the health or sentiment of the market or the sector concerned. It shows us what is happening across the stocks of an index.
The breadth is considered bullish if more numbers of stocks in a particular group are trading above a moving average. Mean reversion strategies can be applied when breadth indicators of multiple time-frames (short-term, long-term) are at extreme levels.
When the broad market falls and the breadth of all stocks are falling, there is a possibility that a particular group or sector might showing strength – can we call it relative strength?
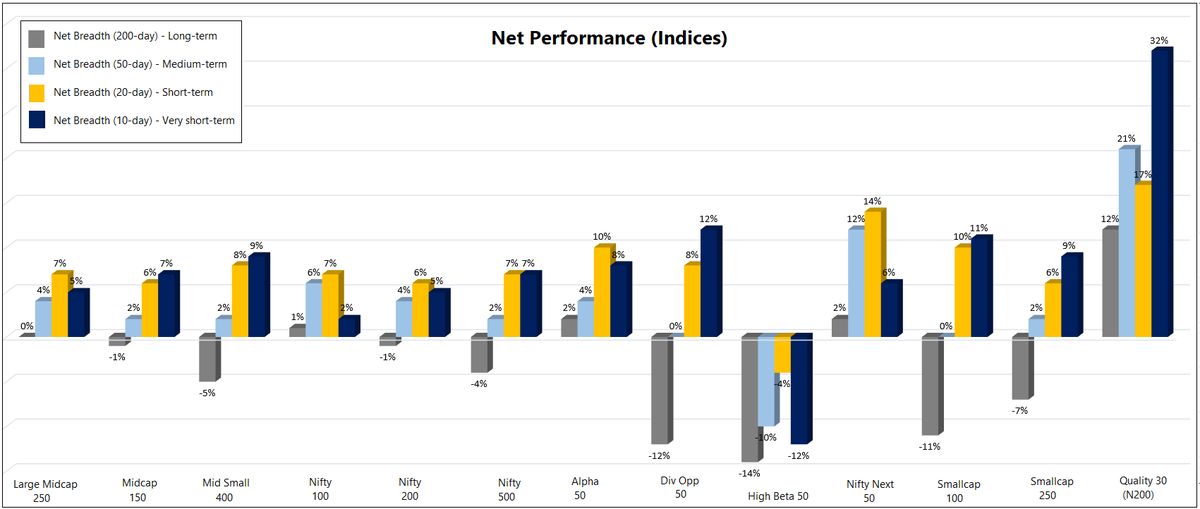
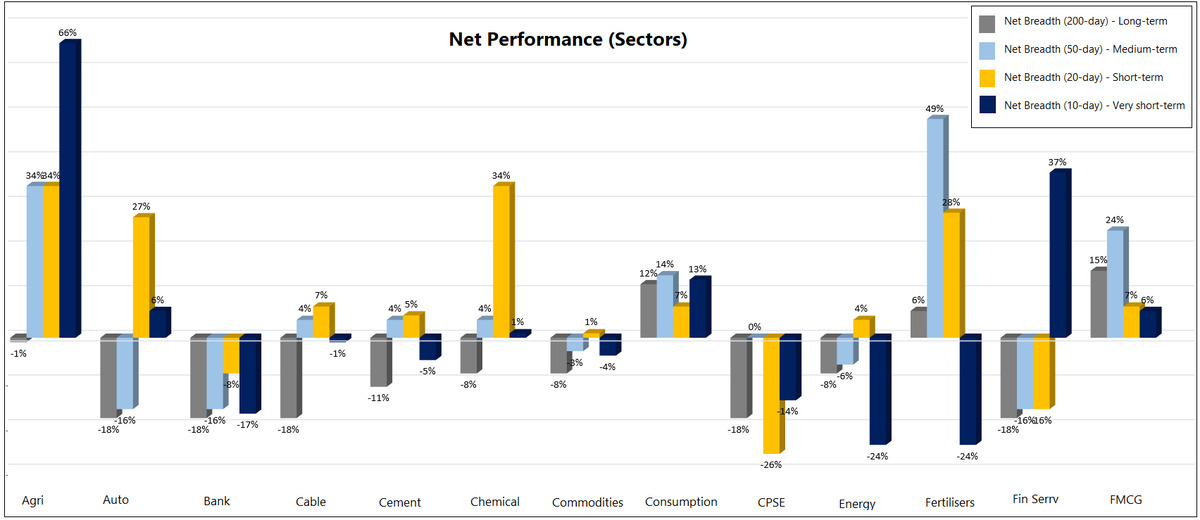
Net breadth = Breadth reading of sector – Breadth reading of Nifty
For example, if 30% stocks are bullish in a sector & 20% are bullish in Nifty, the net breadth is 10%.
If reading is positive, it suggests outperformance and vice-versa.
For example, if 30% stocks are bullish in a sector & 20% are bullish in Nifty, the net breadth is 10%.
If reading is positive, it suggests outperformance and vice-versa.
Below is Net breadth chart of long-term, medium-term, short-term and very short-term of major indices.
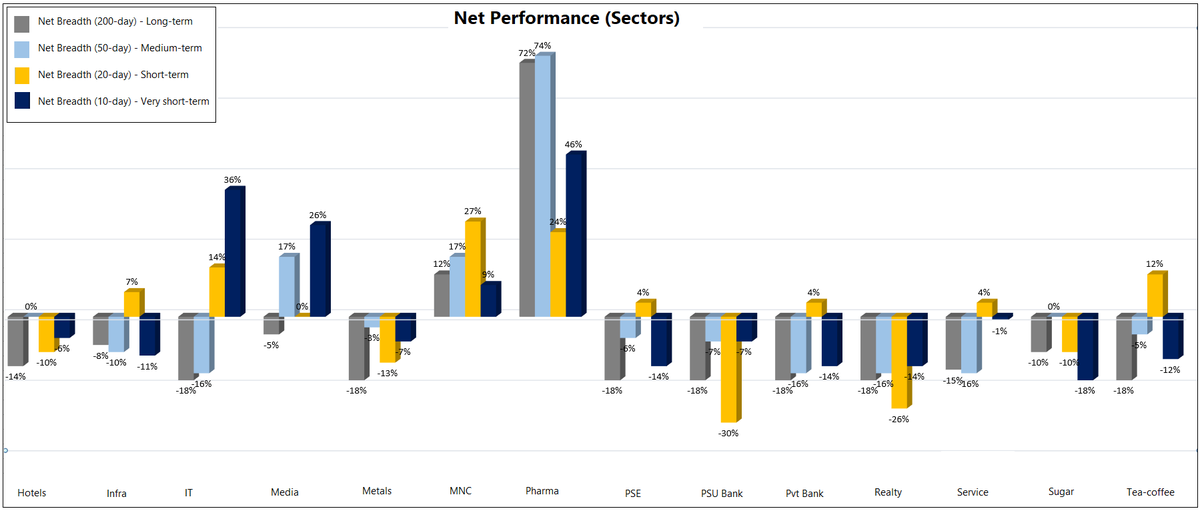
Below is Net breadth chart of long-term, medium-term, short-term and very short-term of all sectors.
These charts also capture the relative performance of different sectors using the moving average as the breadth indicator. Sectors that did not contribute even when nifty showed strength may be avoided, and sectors showing outperformance when Nifty is weak should be considered.
Breadth analysis and the breadth indicator can help one in trading price patterns more effectively.
Similar study can be done using any other indicator. Moving average is popular indicator. Hence, I took that as an example to explain the concept.
Similar study can be done using any other indicator. Moving average is popular indicator. Hence, I took that as an example to explain the concept.
For that matter, any indicator that you prefer can be used as a breadth indicator. The nature of breadth is changed based on indicator – Eg: If I calculate number of stocks trading above 5% ATR –I get to know how many stocks in the group are volatile.
End of Thread.
End of Thread.

 Read on Twitter
