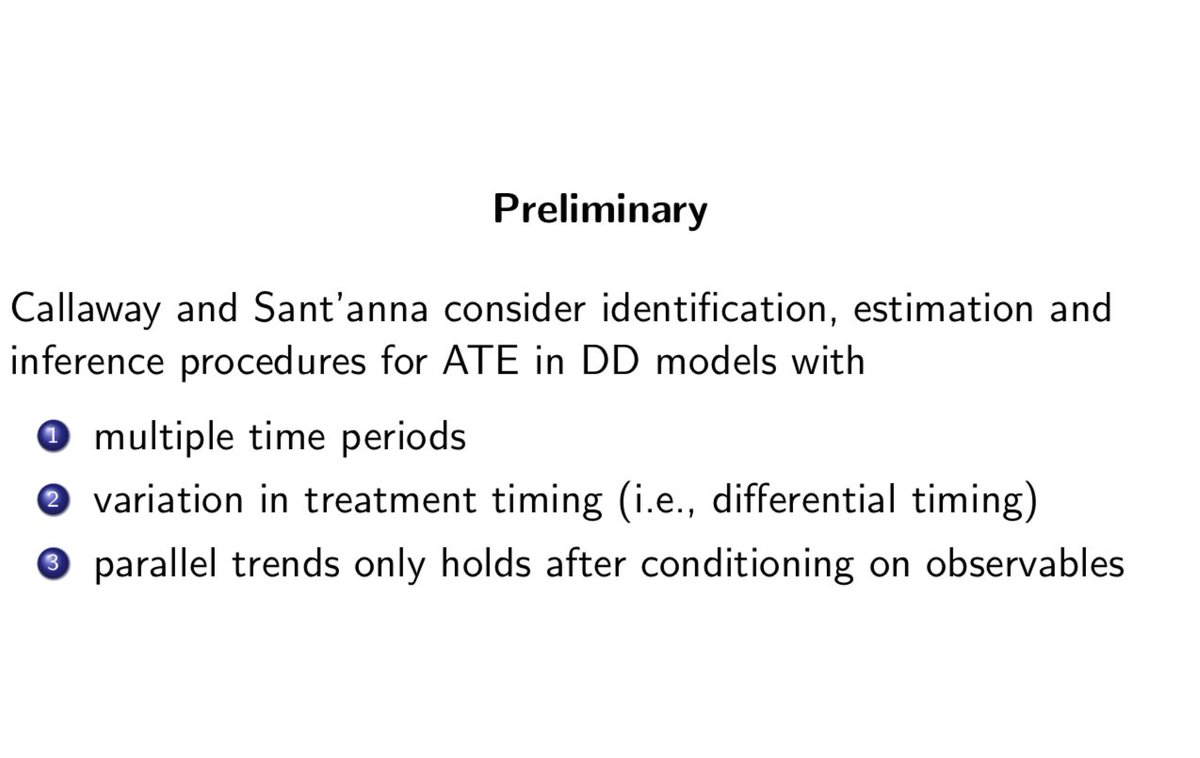
I just taught @pedrohcgs and Callaway& #39;s excellent paper on nonparametric diff-in-diff. I think when you do a simulation showing the bias of TWFE and then show their estimator which isn& #39;t, students freak out. Here& #39;s the lecture. Warning: it& #39;s long-is. https://www.dropbox.com/s/iv0dsj9vlk1pqad/cs.mp4?dl=0">https://www.dropbox.com/s/iv0dsj9...
Here are my lecture slides. I& #39;m going to now do a thread. If you read this thread, and then you read @Andrew___Baker & #39;s short piece (which I& #39;ll link to next), and then you read an imminent thread by @pedrohcgs , and then you read the paper, and then you do the simulation... 2/n
Then if one of those doesn& #39;t do it for you, one of the others will. But here& #39;s the slides. 3/n https://www.dropbox.com/s/r90za3fukp1y4nl/cs.pdf?dl=0">https://www.dropbox.com/s/r90za3f...
And here& #39;s @Andrew___Baker & #39;s excellent writeup of a few of these new DD papers. 4/n https://andrewcbaker.netlify.app/2019/09/25/difference-in-differences-methodology/">https://andrewcbaker.netlify.app/2019/09/2...
But let me start at the top. Everyone on #EconTwitter has been hearing "oh the new DD papers this and the new DD papers that and something is biased, and something isn& #39;t good anymore and I& #39;m busy, and we& #39;re in a recession," and so on. How do we think about these? 5/n
Well, here& #39;s how I think about these new DD papers. Some of them seem focused on parallel trend type stuff. For instance @jondr44 has a paper called "Pre-test with Caution: Event-study Estimates after testing for Parallel Trends." It& #39;s in the title! 6/n
But some of them have been focused on two things: 1) differential timing; 2) heterogeneity over time. Heterogeneity over time is different from heterogeneity cross-sectionally. Heterogeneity "cross sectionally" would be like this: My ATT is 10, but @jmorenocruz is 5. 7/n
The average ATT for us 7.5. OLS handles that fine. You can see me run it in the simulation, for instance -- TWFE handles group heterogeneity just fine. What TWFE can& #39;t handle is heterogeneity *over time* (with differential timing). TWFE is a sin in such situations. 8/n
And I illustrate that in the video, and you can see for yourself if you run this simulation here. @Andrew___Baker has the R code if you want to bug him for that. Just run it to see for yourself. Here& #39;s the dropbox link to the half completed simulation 9n https://www.dropbox.com/s/nikinluypt4tf5m/baker.do?dl=0">https://www.dropbox.com/s/nikinlu...
So, TWFE is biased. Run line 110 to see for yourself and compare that negative number to what it should be using line 96. It should at least be positive!! So, @pedrohcgs and Brant, what& #39;s this all about. That only took 10 slides (which is sort of like the lecture I gave). 10n
@pedrohcgs and Brant& #39;s estimator is used for all the reasons you don& #39;t want to use TWFE: 1) differential timing, 2) heterogeneity over time, and 3) conditional parallel trends. In other words, the *modal situation* for applied microeconomists doing program evaluation. 11/n
The notation in this paper is DENSE. So I& #39;m going to give the white belt version. Basically, there& #39;s a billion treatment effects you can calculate if you have differential timing with heterogeneity over time - like literally a unique treatment effect per group/year. 12/n
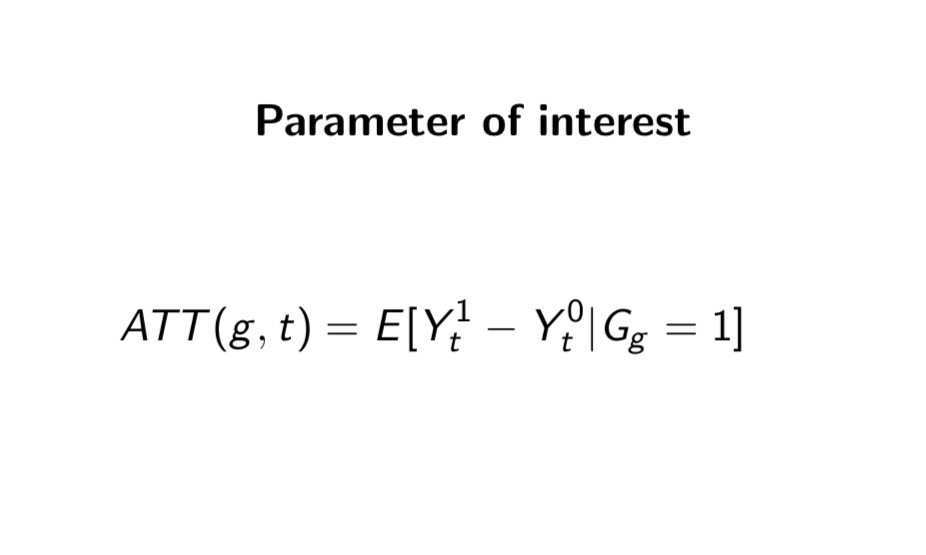
Well, in @pedrohcgs and Callaway that has a name -- the group/time ATT. It& #39;s notation is ATT(g,t). What is that? Well let& #39;s say I got my PhD in 2007 and it& #39;s now 2020. My ATT would be ATT(2007, 2020). This is also what they mean by "the long difference". 13/n
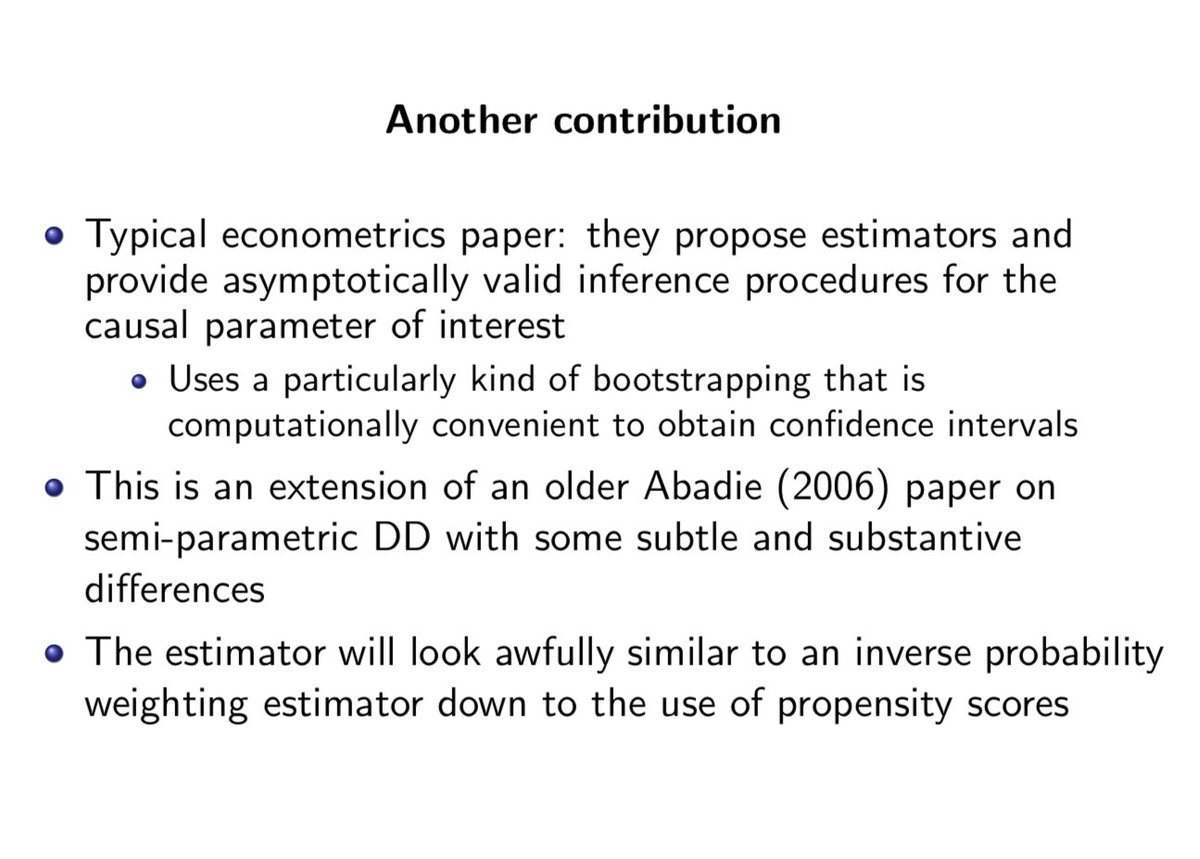
One of the things I really like about this paper is it was a reward for spending time learning about the history of thought on inverse probability weighting, the different weights, and even an older Abadie paper on semi parametric diff-in-diff from 2006. Everything comes around
Here& #39;s the thing you have to keep in mind -- DD and TWFE are not the same thing. DD is a design; TWFE is an estimator. Just like IV and 2SLS aren& #39;t the same thing. IV is a design; 2SLS is an estimator. @pedrohcgs and Callaway& #39;s is a slightly nonparametric DD estimator. 14/n
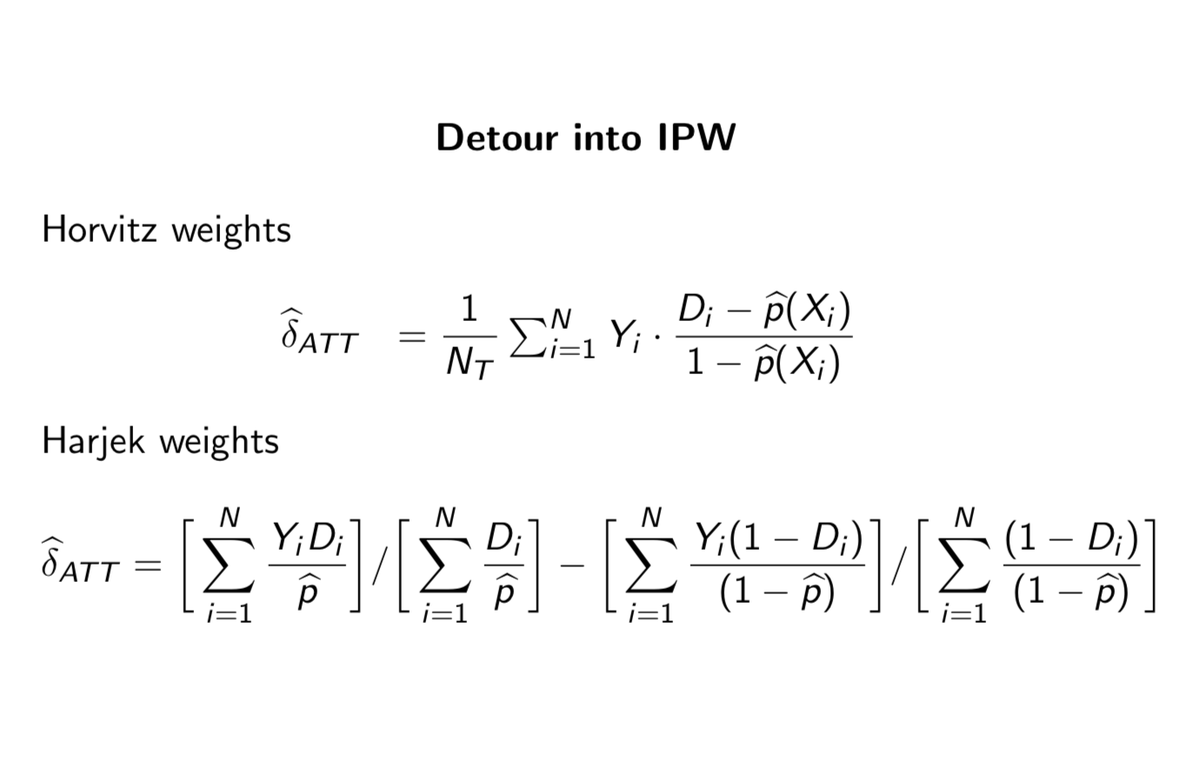
At least, that& #39;s what I am calling it because really all you& #39;re doing in this ("all you& #39;re doing" says the guy who can& #39;t do anything) is weighting the "long difference" by normalized weights based on the propensity score. It harkens back to inverse probability weighting! 15/n
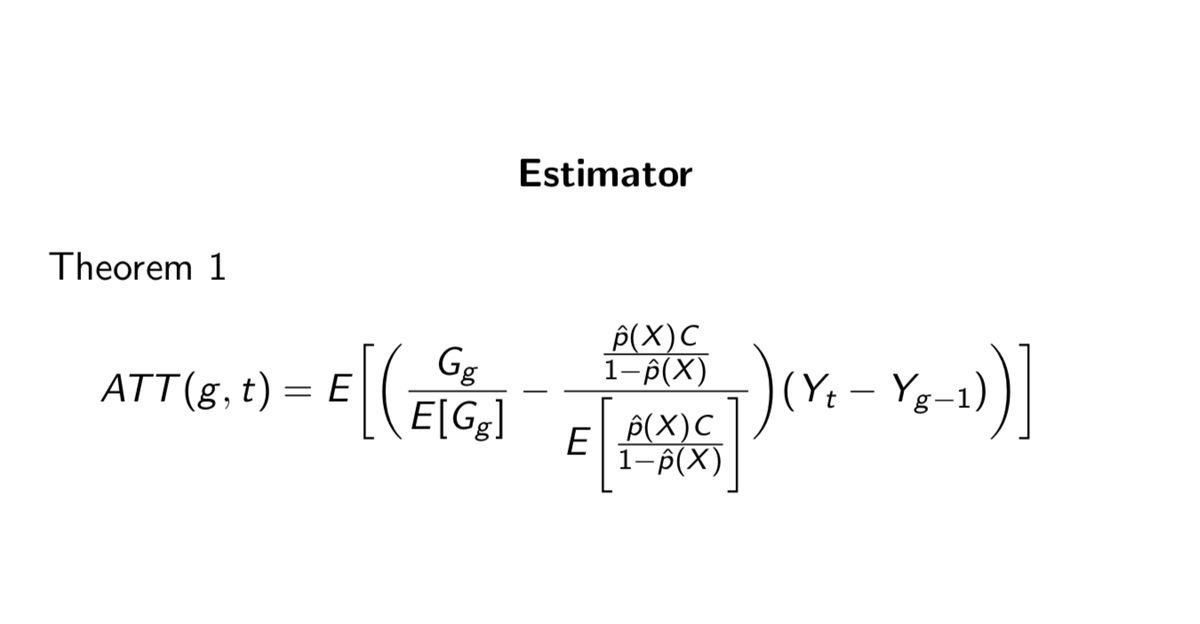
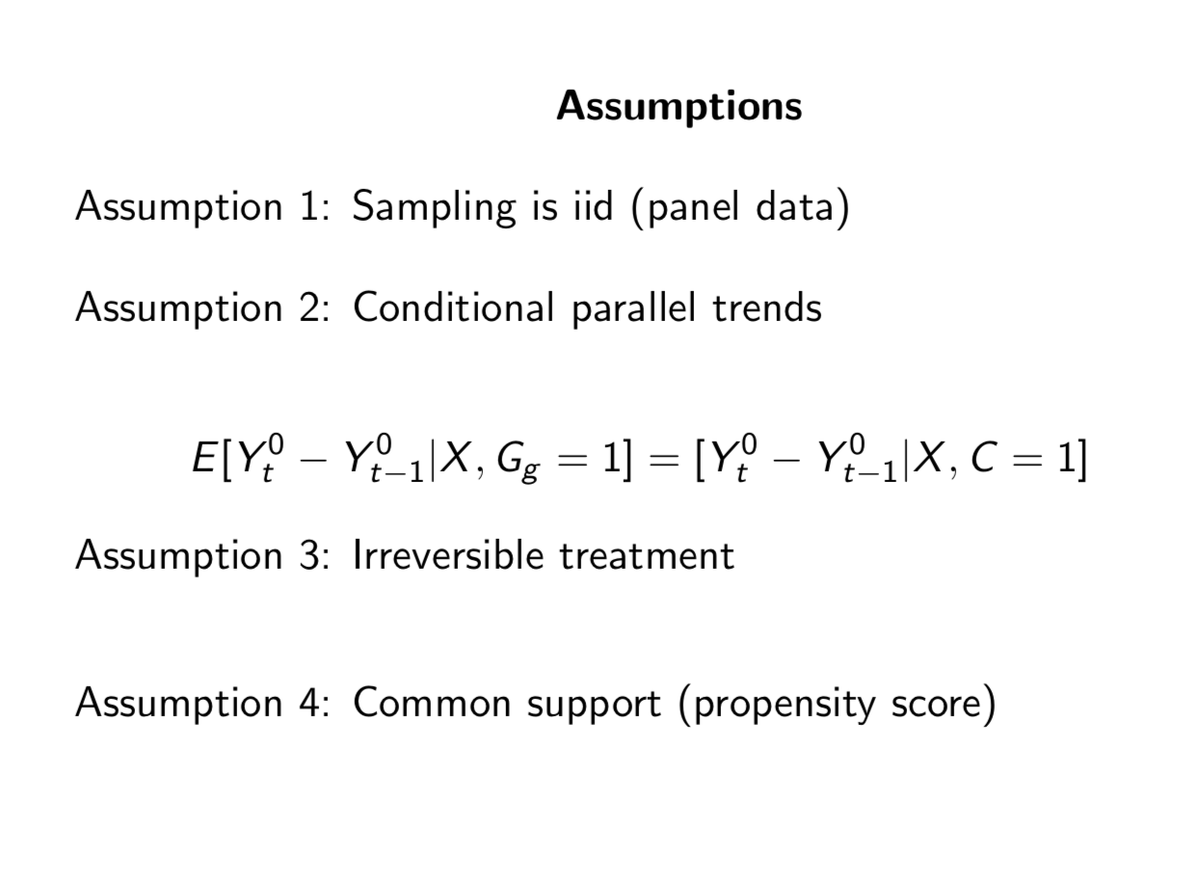
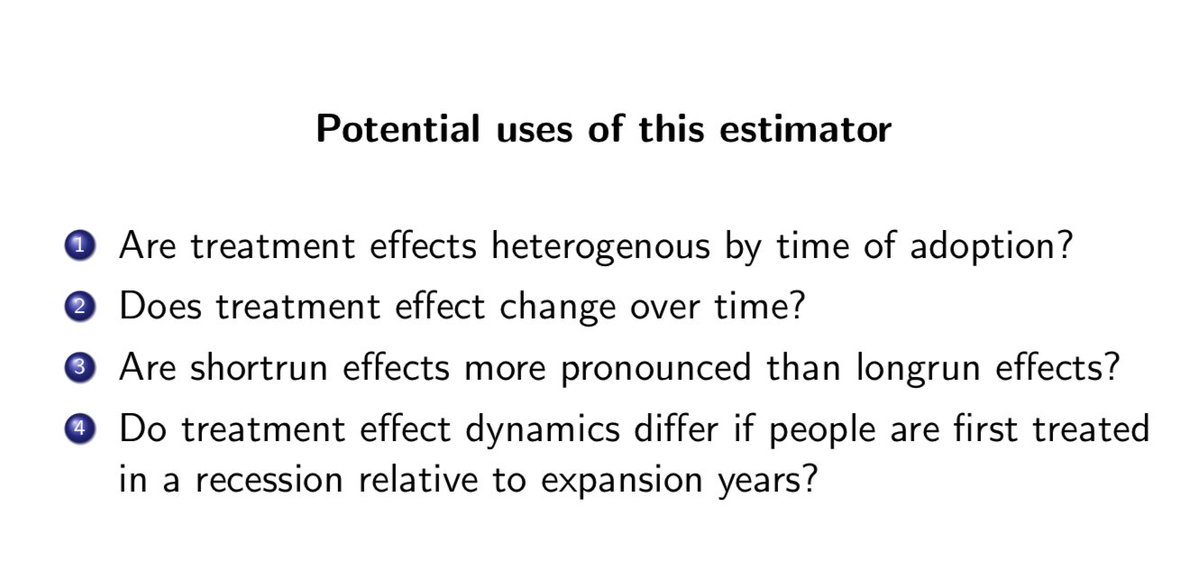
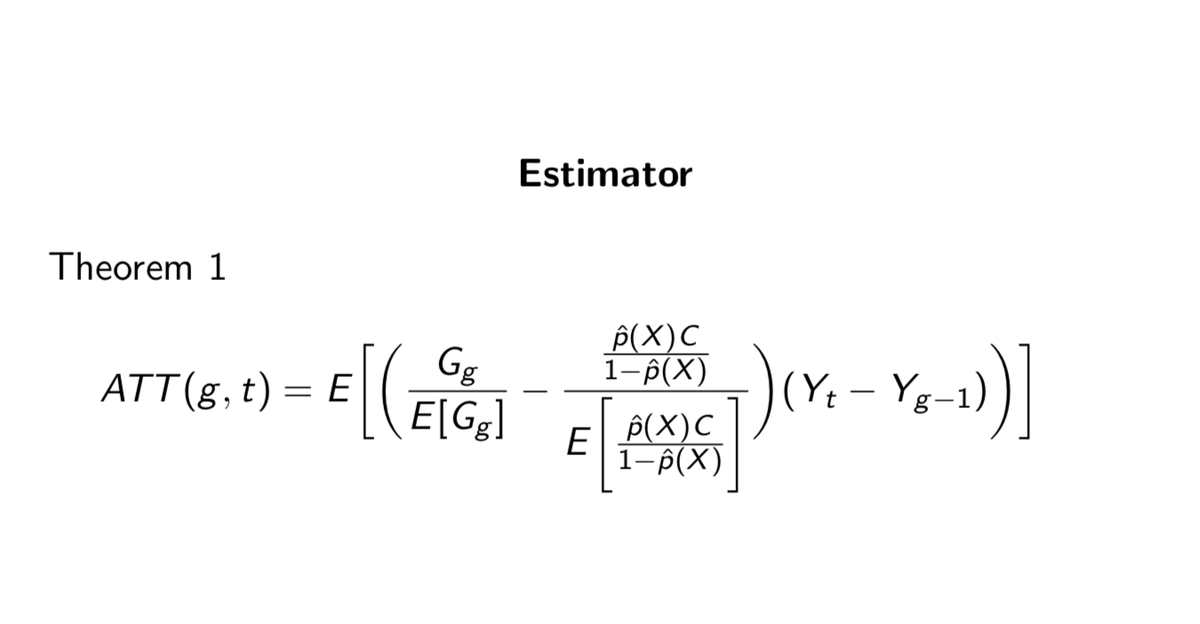
Briefly, here& #39;s situations where you may want it -- all of which have to do with dynamic heterogeneity. Here& #39;s an example of the group-time ATT. Here& #39;s the four assumptions needed for identification. And here& #39;s the funky estimator. Let& #39;s dig into this estimator. 16/n
Notice how the estimator is at its core just a weighting of the "long difference". You can take the ATT at any point in time, but you weight the actual outcomes based on whether it& #39;s a treatment or control differently. The expectations are with respect to time for a group. 17/n
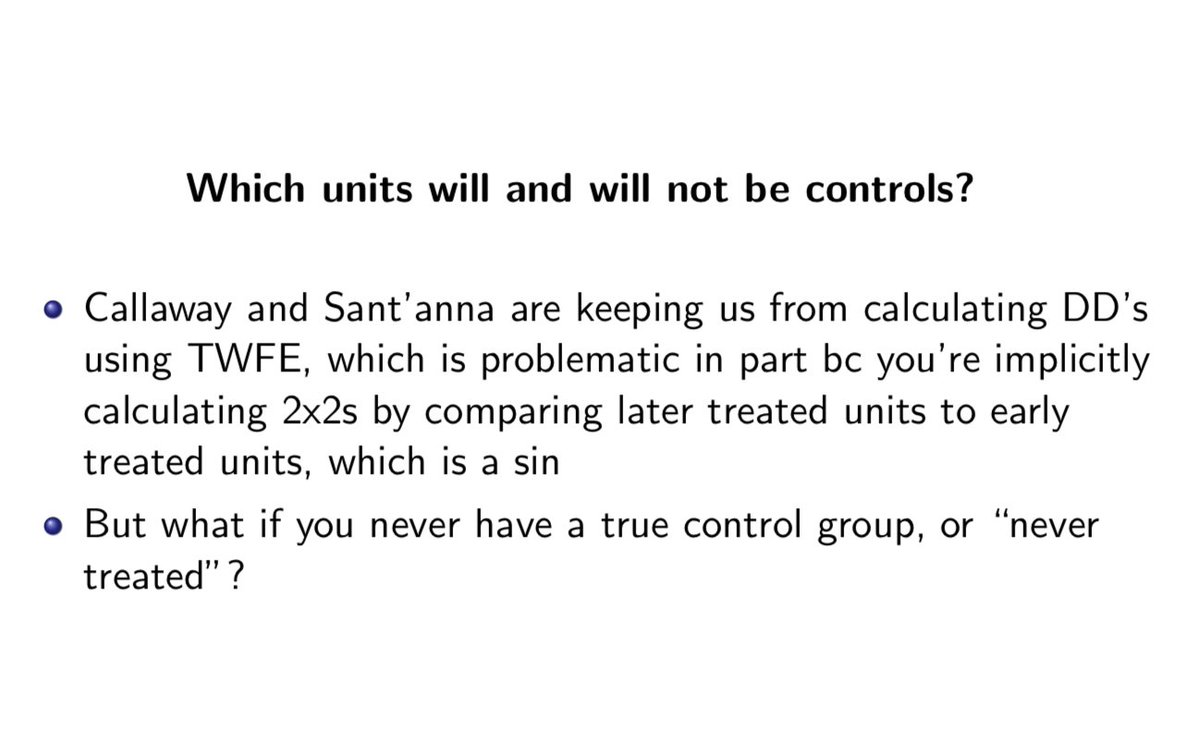
Look closely at the C in the estimator, though. That& #39;s basically the never treated units. But what if you have staggered universal adoption (e.g., minimum wage)? Well, look at remark 1: just use the "not yet treated" as controls. What& #39;s the lesson here? 18/n
The lesson here is that when Adam sinned, it was because he compared treated units to *already treated units*, and with heterogeneity over time, that leads to bias. *So don& #39;t use them as controls*. And @pedrohcgs and Callaway don& #39;t. But econometrics isn& #39;t *that* easy. 19/n
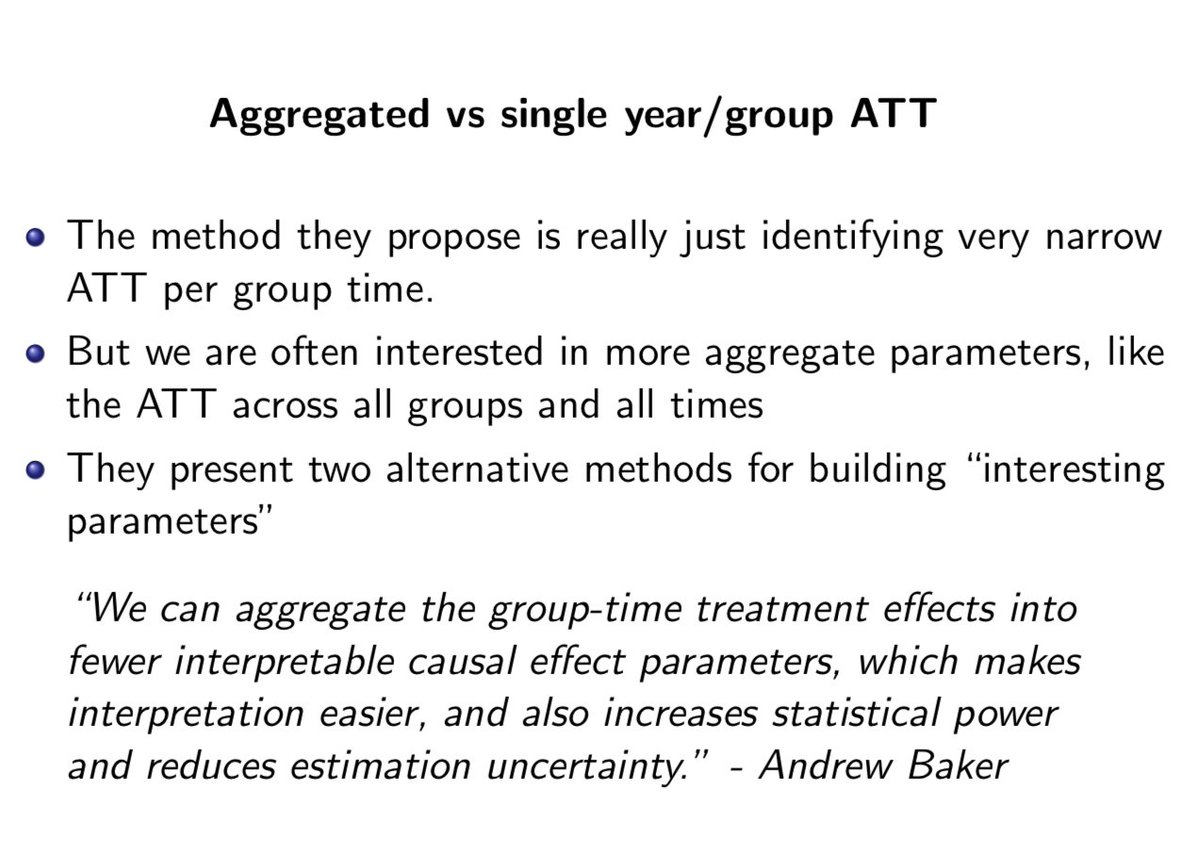
So the paper is a lot to digest, but strangely, the simulation isn& #39;t. So I encourage you to study it, then look at these notes, then watch the video, then read the paper, and all between. But now the fun part. This method identifies a billion little ATTs. But you can aggregate!
After all, a policymaker probably is more interested in a more global ATT than some snapshot ATT at year t for some isolated group, right? Well like I said, they provide a couple of ways to do it. In R it doesn& #39;t automatically, but I& #39;m having to manually do it and haven& #39;t yet.
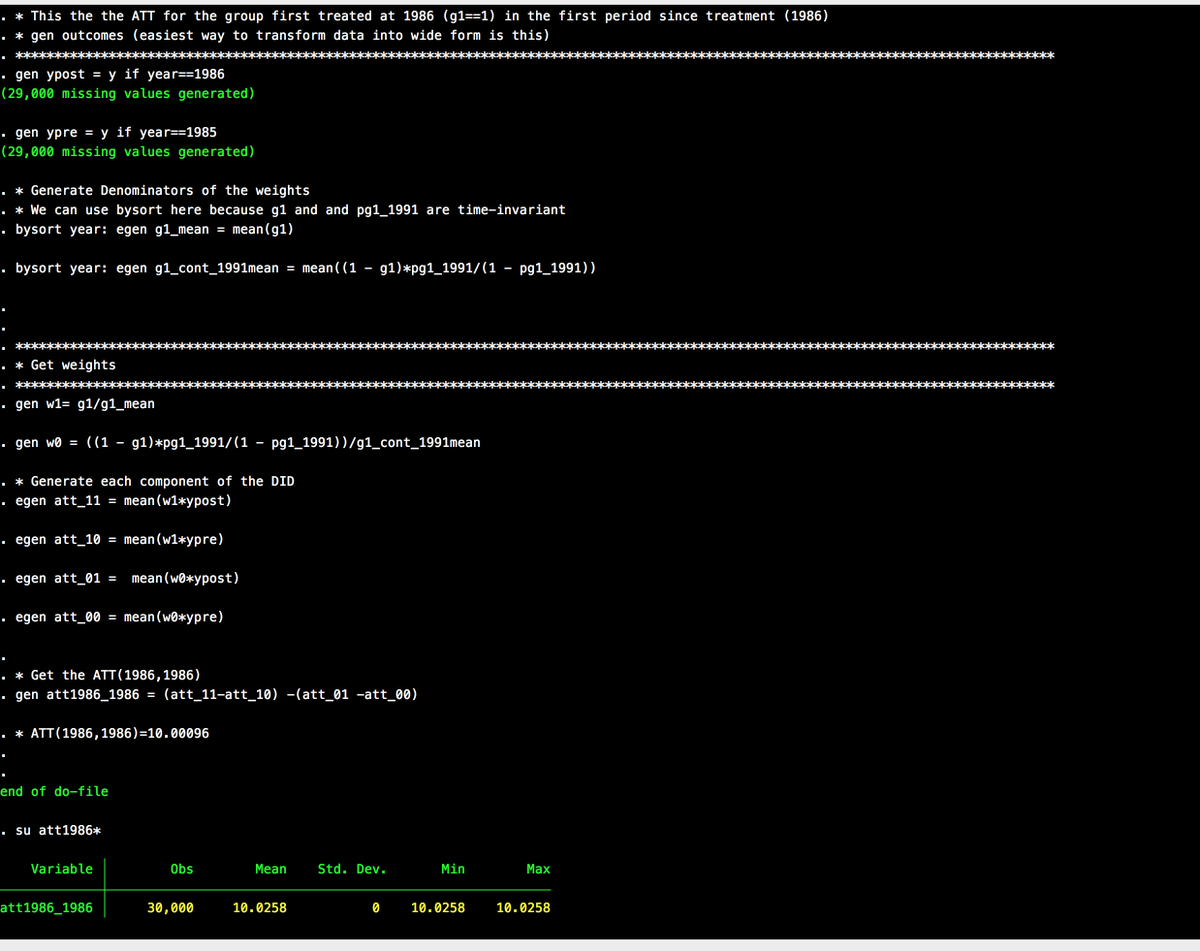
So, here& #39;s the thing. You have to just run the simulation yourself to see. Do this: using line 96, make a spreadsheet of each individual ATT for a group/year like this. You should get 10 in 1986. And they do! 22/n https://www.dropbox.com/s/nikinluypt4tf5m/baker.do?dl=0">https://www.dropbox.com/s/nikinlu...
Okay, but maybe they got lucky. What about 1987? You should get 20. And they do! Yet TWFE? A giant poopy face negative value for the static parameter that looks like crap in the event study too. As the Hebrew say, "lo tov" (not good). 23/n
Still more that has to be done in this simulation: still have to aggregate the individual ATTs into "interesting parameters", which I& #39;m working on. And need to bootstrap, which I also need to do. But putting those aside: wow. What a paper and a gift to us. Great job! 24/n

 Read on Twitter

