NYC antibody testing and the fatality rate of covid19.
A physicist& #39;s take on the problem.
Thread
@JamieWoodhouse
@Kit_Yates_Maths
@lymanstoneky
@andrew_lilico
@bajhanlaurence
1/n
A physicist& #39;s take on the problem.
Thread
@JamieWoodhouse
@Kit_Yates_Maths
@lymanstoneky
@andrew_lilico
@bajhanlaurence
1/n
Summary:
In this thread I obtain an estimate on the IFR of covid-19 in NYC. I find that the IFR is
close to 1.1
Methodology: I use a simple time-series model of the deaths curve after a lockdown in combination with the serological data released on THU, Apr 23
2/n
In this thread I obtain an estimate on the IFR of covid-19 in NYC. I find that the IFR is
close to 1.1
Methodology: I use a simple time-series model of the deaths curve after a lockdown in combination with the serological data released on THU, Apr 23
2/n
Background:
A critically important, if elusive characteristic
of covid19 is the infections fatality rate, IFR.
The value of IFR is central to any policy debate on covid 19.
If the IFR is close to 0.1% as some suggest
https://lockdownsceptics.org/mikko-paunio-paper/
then..
3/n">https://lockdownsceptics.org/mikko-pau...
there are grounds to consider lockdowns an overreaction.
In contrast, if the IFR is close to 1% a lockdown - timed or
indefinite- can be viewed as a more appropriate response to
the epidemic than mild mitigation.
4/n
In contrast, if the IFR is close to 1% a lockdown - timed or
indefinite- can be viewed as a more appropriate response to
the epidemic than mild mitigation.
4/n
The main difficulties in inferring the IFR from
epidemiological data are
1 The # of cases in a given population is often not known https://www.thelancet.com/journals/laninf/article/PIIS1473-3099(20)30244-9/fulltext
2">https://www.thelancet.com/journals/... Infections increase extremely rapidly therefore data analysis requires careful modelling of long-term causal effects 5/n
On Thursday, Apr 23 the state of NY released the results of randomised testing of the population of the state for covid19 antibodies
https://www.cnbc.com/2020/04/23/new-york-antibody-study-estimates-13point9percent-of-residents-have-had-the-coronavirus-cuomo-says.html
6/n">https://www.cnbc.com/2020/04/2...
https://www.cnbc.com/2020/04/23/new-york-antibody-study-estimates-13point9percent-of-residents-have-had-the-coronavirus-cuomo-says.html
6/n">https://www.cnbc.com/2020/04/2...
Here, I show how to use this information in combination with the time series analysis of the response of the NYC deaths curve to the mid-March quarantine measures to correctly estimate the IFR of covid-19 in NYC.
I use some assumptions, which are open to correction
7/n
I use some assumptions, which are open to correction
7/n
I hope that the following technical description of my calculation will prove insightful for the general public and useful for the specialists working in the field.
I am aware of several places where the method
could be improved.
8/n
I am aware of several places where the method
could be improved.
8/n
First, I list the main assumptions of the calculation.
These are open to criticisms/corrections
A1. As of Monday 20 21.2% of NYC residents have been infected with covid19 (with caveats, see here https://twitter.com/newscientist/status/1253777198160531456?s=20)
9/n">https://twitter.com/newscient...
These are open to criticisms/corrections
A1. As of Monday 20 21.2% of NYC residents have been infected with covid19 (with caveats, see here https://twitter.com/newscientist/status/1253777198160531456?s=20)
9/n">https://twitter.com/newscient...
A2. In the absence of social distancing measures the basic reproductive number for covid19 is R0=2.75.
A3 Growth of infections is reasonably well described by the basic SIR model
https://www.maa.org/press/periodicals/loci/joma/the-sir-model-for-spread-of-disease-the-differential-equation-model
10/n">https://www.maa.org/press/per...
A3 Growth of infections is reasonably well described by the basic SIR model
https://www.maa.org/press/periodicals/loci/joma/the-sir-model-for-spread-of-disease-the-differential-equation-model
10/n">https://www.maa.org/press/per...
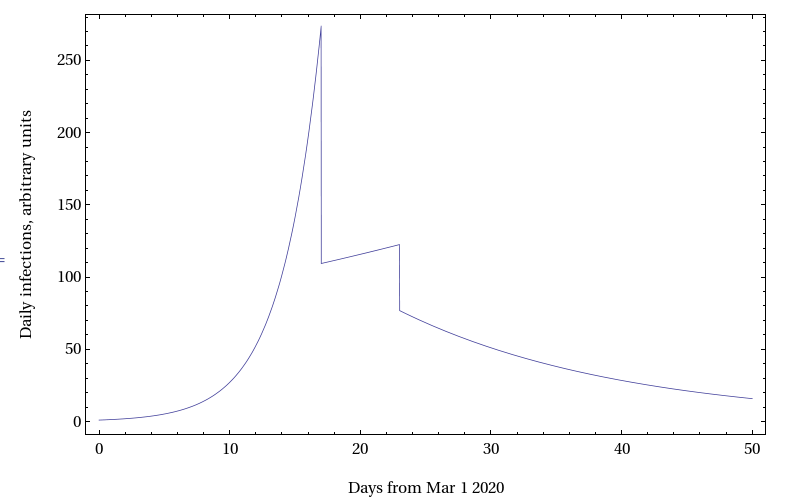
A4. The quarantine measures were introduced in two steps. Closures of bars/eateries & ban on public gatherings effective on Mar 17 and a lockdown effective on Mar 23. Each of these steps was marked by a downward jump in the value of R0.
11/n
11/n
A5. The probability distribution of time from infection to death for hospital cases is given here
https://twitter.com/cheianov/status/1252662717967667202?s=20
(details">https://twitter.com/cheianov/... on request)
A6. It takes about 10 days after infection for antibodies to develop
12/n
https://twitter.com/cheianov/status/1252662717967667202?s=20
(details">https://twitter.com/cheianov/... on request)
A6. It takes about 10 days after infection for antibodies to develop
12/n
A7 The latest release of hospital deaths data is reasonably accurate up to one weak before today. The data are available here
https://github.com/nychealth/coronavirus-data
A8">https://github.com/nychealth... Community deaths account for up to 1/3 of Covid19 deaths
(ibid)
(end of assumptions)
13/n
https://github.com/nychealth/coronavirus-data
A8">https://github.com/nychealth... Community deaths account for up to 1/3 of Covid19 deaths
(ibid)
(end of assumptions)
13/n
The rest is applied mathematics.
We denote by R0, R1, and R2 the values of R0
in the periods before MAR17, between MAR17-MAR22,
and MAR23 +R1 and R2 will be the fitting parameters of the model
14/n
We denote by R0, R1, and R2 the values of R0
in the periods before MAR17, between MAR17-MAR22,
and MAR23 +R1 and R2 will be the fitting parameters of the model
14/n
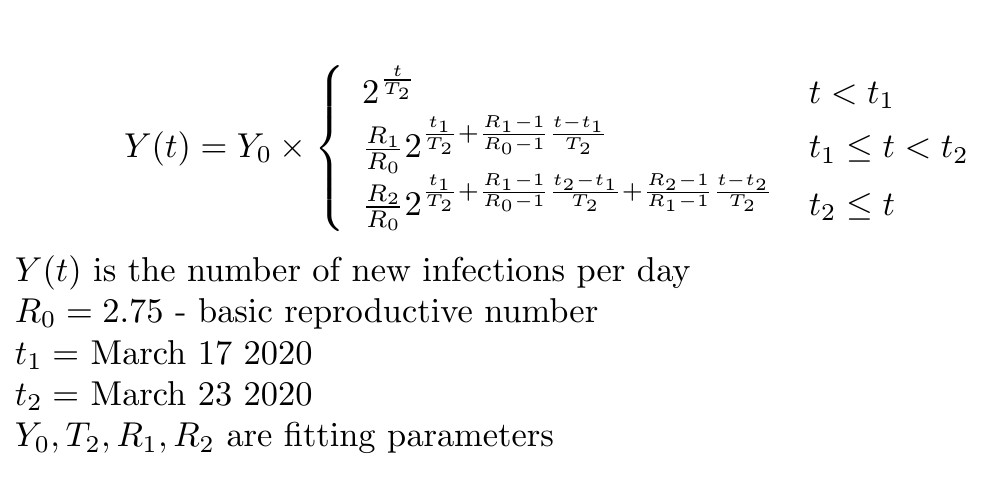
We denote by T2 the doubling time of infections in the
period before MAR17.
Then the SIR model predicts the following form
of the daily infections, Y
[cf this thread
https://twitter.com/cheianov/status/1252657345831882760?s=20]
15/n">https://twitter.com/cheianov/...
period before MAR17.
Then the SIR model predicts the following form
of the daily infections, Y
[cf this thread
https://twitter.com/cheianov/status/1252657345831882760?s=20]
15/n">https://twitter.com/cheianov/...
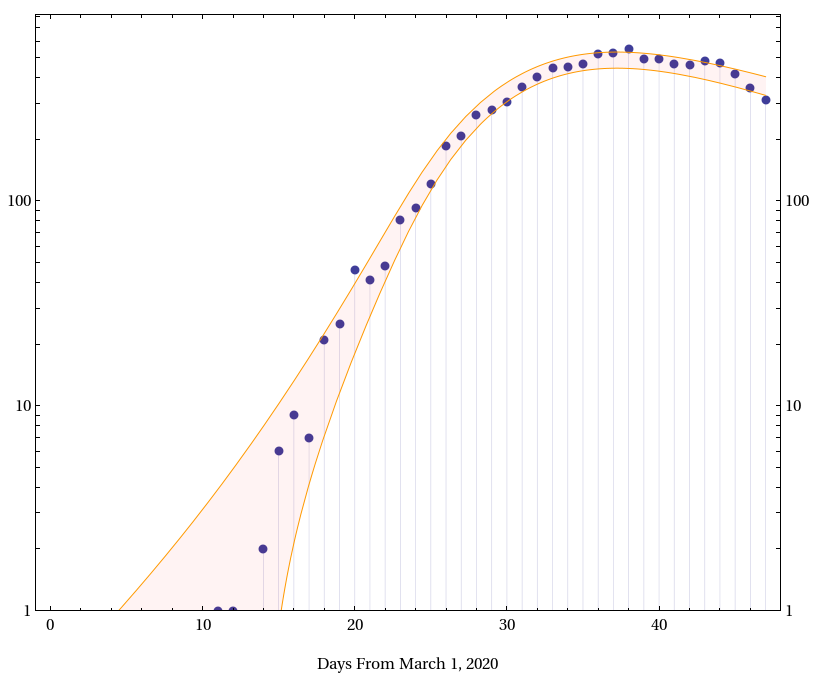
Using Y0, T2, R1 and R2 as variational parameterrs
I find the best fit (logarithmic least squares) to the
NYC data. The graph shows the 2sigma region for the Poissonian noice in the data. About 4.5% of data points would typically lie outside.
18/n
I find the best fit (logarithmic least squares) to the
NYC data. The graph shows the 2sigma region for the Poissonian noice in the data. About 4.5% of data points would typically lie outside.
18/n
The values of fitting parameters are
Doulbing time= 2.1 days
R1=1.1
R2=0.69
Normalisation factor eta*Y0=5.6
19/n
Doulbing time= 2.1 days
R1=1.1
R2=0.69
Normalisation factor eta*Y0=5.6
19/n
We are now in position to estimate the IFR. The total number of antibody-positive NYC residents is given (within our model) by
20/n
20/n
Which gives for the IFR (denoted by eta here)
IFR = (5.58x2.26x10^3)/(1.76x10^6)=0.72
This calculation, however, neglects community deaths. Using our assumption A8
21/n
IFR = (5.58x2.26x10^3)/(1.76x10^6)=0.72
This calculation, however, neglects community deaths. Using our assumption A8
21/n
We conclude that it is likely that the IFR of covid
in NYC is close to 1.1
22/n
in NYC is close to 1.1
22/n
Discussion: a simple model proposed here gives a remarkably good fit of the epidemiological data.
The model indicates that IFR of covid19 in NYC is close to 1
It also indicates that the social distancing measures that took effect on Mar 17 were not sufficient (R1>1)
//Ends
The model indicates that IFR of covid19 in NYC is close to 1
It also indicates that the social distancing measures that took effect on Mar 17 were not sufficient (R1>1)
//Ends
Revision of my yesterday& #39;s estimate of the infections fatality rate of covid19 in NYC [courtesy of @Shagamanx1]
My revised estimate is IFR=0.8
Explanation
1/m
My revised estimate is IFR=0.8
Explanation
1/m
My assumption A6 was based on incomplete knowledge.
Antibody tests involve both IgM and IgG. The latter takes longer to develop.
The correct expression for the number of IgG positive results is
2/m
Antibody tests involve both IgM and IgG. The latter takes longer to develop.
The correct expression for the number of IgG positive results is
2/m
The function P_A is not fully known, however, for hospital cases it can be inferred from these two publications [kindly pointed out to me by of @Shagamanx1]
https://www.medrxiv.org/content/10.1101/2020.03.02.20030189v1
https://www.medrxiv.org/content/1... href=" https://www.medrxiv.org/content/10.1101/2020.03.06.20031856v1
Here">https://www.medrxiv.org/content/1... I just state the result (see Fig below)
3/m
https://www.medrxiv.org/content/10.1101/2020.03.02.20030189v1
Here">https://www.medrxiv.org/content/1... I just state the result (see Fig below)
3/m
Due to the shift of the integration weight to earlier times (compared to the previously assumed 10 days), I obtain a smaller value of the integral
4/m
4/m
And an amended value of IFR (taking into account community deaths factor)
IFR = (3/2)x(5.58x1.67x10^3)/(1.76x10^6)=0.8
5/m
IFR = (3/2)x(5.58x1.67x10^3)/(1.76x10^6)=0.8
5/m
Note that a similar figure is obtained if one simply divides the reported number of deaths by the number of antibody-positive residents.
The critics of such a naive calculation reasonably point out that it neglects a 28 days lag in formation of antibodies. 6/m
The critics of such a naive calculation reasonably point out that it neglects a 28 days lag in formation of antibodies. 6/m
Therefore, they argue, the naive calculation strongly underestimates the actual number of covid19 cases (people infected in the past 28 days), and thus overestimates the IFR.
In fact, there are two counteracting effects, which almost precisely compensate each other.
7/m
In fact, there are two counteracting effects, which almost precisely compensate each other.
7/m
The retardation in the formation of antibodies is compensated by the long time (21 days) from infection to death, which works in the opposite direction.
Ends//
Ends//

 Read on Twitter


![The function P_A is not fully known, however, for hospital cases it can be inferred from these two publications [kindly pointed out to me by of @Shagamanx1] https://www.medrxiv.org/content/1... href=](https://pbs.twimg.com/media/EWfBfAVXkAAGgLS.png) https://www.medrxiv.org/content/1... I just state the result (see Fig below)3/m" title="The function P_A is not fully known, however, for hospital cases it can be inferred from these two publications [kindly pointed out to me by of @Shagamanx1] https://www.medrxiv.org/content/1... href=" https://www.medrxiv.org/content/10.1101/2020.03.06.20031856v1Here">https://www.medrxiv.org/content/1... I just state the result (see Fig below)3/m" class="img-responsive" style="max-width:100%;"/>
https://www.medrxiv.org/content/1... I just state the result (see Fig below)3/m" title="The function P_A is not fully known, however, for hospital cases it can be inferred from these two publications [kindly pointed out to me by of @Shagamanx1] https://www.medrxiv.org/content/1... href=" https://www.medrxiv.org/content/10.1101/2020.03.06.20031856v1Here">https://www.medrxiv.org/content/1... I just state the result (see Fig below)3/m" class="img-responsive" style="max-width:100%;"/>


