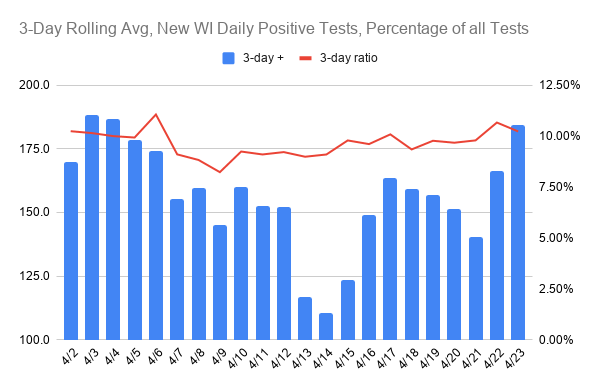
THREAD 1/ Some data and graphs using @DHSWI data on #Wisconsin& #39;s #COVIDー19 cases. We& #39;ve had two high new-case days in a row, which pushes the 3-day rolling average up (blue bars):
2/ The red line is the 3-day rolling average of percentage of positive tests. Yesterday, again, was a high number: 12%. Today was 9.6%, a number that is still above mid-April numbers. You can see both the red line and the blue bars are up from 2 weeks ago.
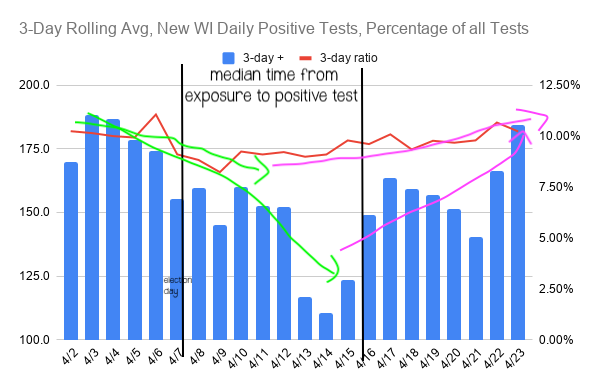
3/ That annotated graph uses the April 7 election day as a benchmark, since its forced in-person voting was the biggest interruption to the state& #39;s "safer at home" policies designed to slow the spread. The 7-8 incubation/test time is also noted starting at election day.
4/ Some have insisted that election day didn& #39;t cause a spike or surge or rise in cases. However, at least 7 voters/poll workers in Milwaukee, 2 in Kenosha, and 19 or more statewide have tested positive with election day the likely point of infection.
5/ I dunno, looking at this is sure seems like SOMETHING happened around April 7 that cause cases and rates of positive tests to start moving back up.
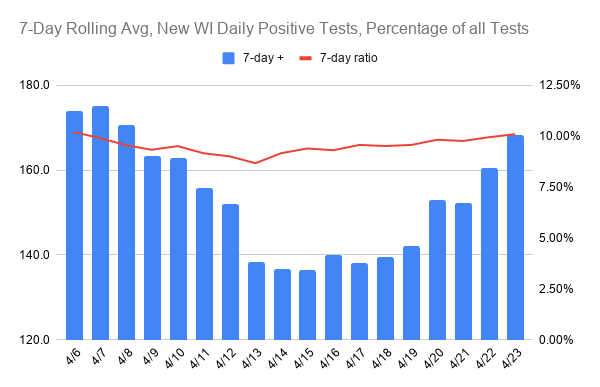
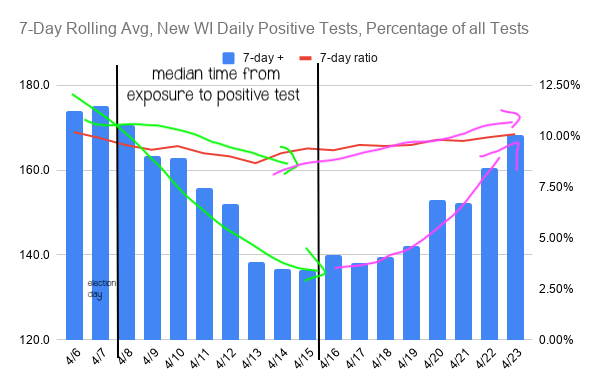
6/ Here& #39;s the same data but showing a 7-day rolling average, to better smooth out daily noise.
7/ And with trendlines and incubation-testing time noted. Again, it sure seems like we were getting things taken care of through mid-April, and then things started inching back up again.
8/ The hope would be as we increase the number of tests processed in a day--and the last two days, the number of tests was way up!--the percentage of positive tests would decline. That would mean spread is contained and isolation/contact tracing can be effective.

 Read on Twitter