PPTs are for making you mesmerized!
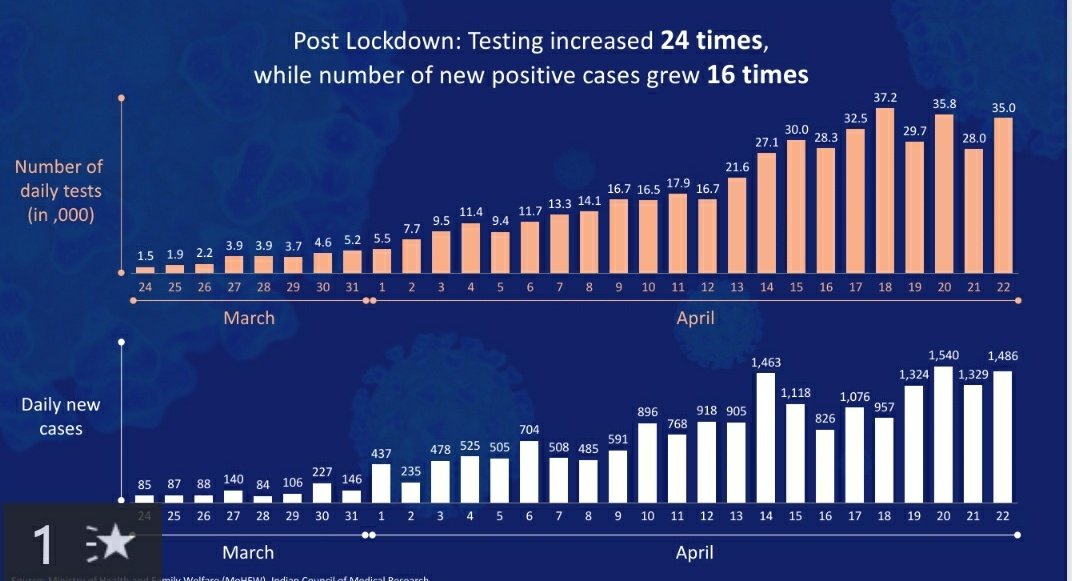
Let us look this first slide
CLAIM:
Post lockdown, testing increased 24 times, while number of positive cases grew only 16 times
Let us look this first slide
CLAIM:
Post lockdown, testing increased 24 times, while number of positive cases grew only 16 times
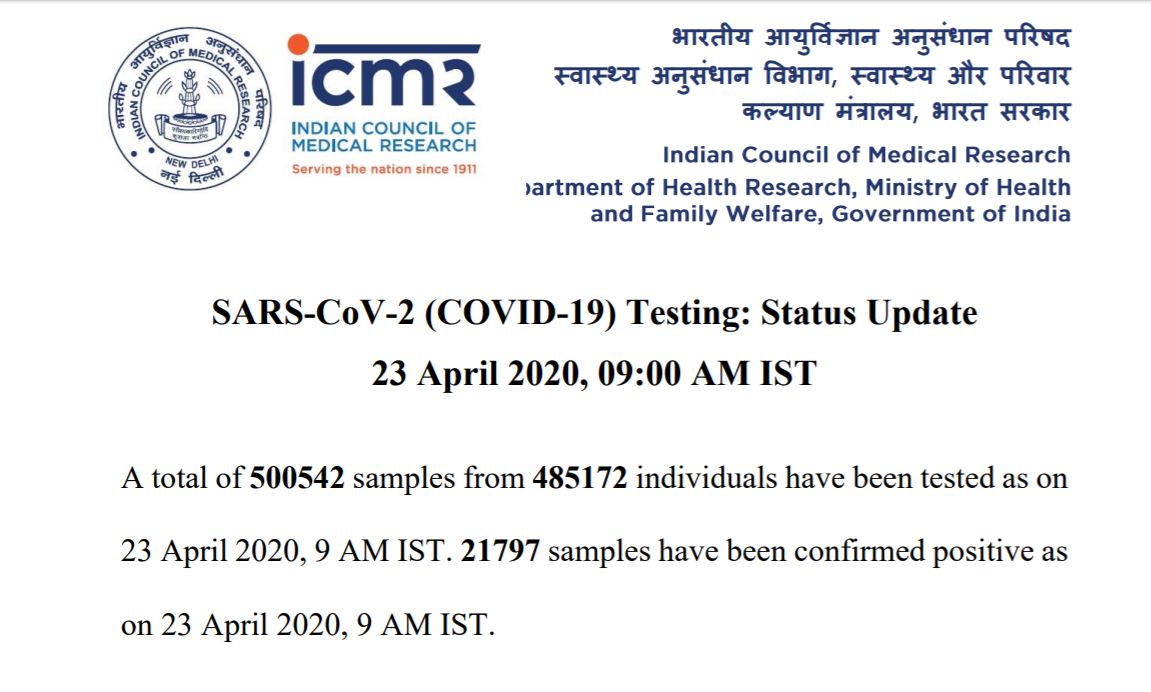
First let us see ICMR press releases for
23rd March and 23rd April
23/03/20
Tests = 20707
Positives = 471
23/04/20
Tests = 500542
Positives = 21797
Increase in tests = 500452/20707 = 24.2 times
Increase in positives = 21797/471 = 46.3 times!!!!!!
23rd March and 23rd April
23/03/20
Tests = 20707
Positives = 471
23/04/20
Tests = 500542
Positives = 21797
Increase in tests = 500452/20707 = 24.2 times
Increase in positives = 21797/471 = 46.3 times!!!!!!
Look at this table, before drooling seeing the PPT and graphs my dear friends
While tests increased by 24.2 times between pre-lockdown and today, positives increased by 46.3 times!
Also the % of positive cases detected per tests increased by 191.45%!
That is the STORY........
While tests increased by 24.2 times between pre-lockdown and today, positives increased by 46.3 times!
Also the % of positive cases detected per tests increased by 191.45%!
That is the STORY........
Remember I taken the number of tests done here, instead of the number of people, because that was the golden period of #Mysterious890
24.5 times, if we take number of people instead of number of tests.
485172/19817 = 24.5 times!
24.5 times, if we take number of people instead of number of tests.
485172/19817 = 24.5 times!
If anyone had doubts like @t_d_h_nair that whether they have taken absolute numbers pre-lockdown and post lockdown.
My answer is here https://abs.twimg.com/emoji/v2/... draggable="false" alt="👇" title="Down pointing backhand index" aria-label="Emoji: Down pointing backhand index"> https://twitter.com/jamewils/status/1253317619383328770?s=19">https://twitter.com/jamewils/...
My answer is here

 Read on Twitter


