My strategy is to allow price charts to go through a low volatility period and buy/sell the breakout from those relative low volatility conditions.
Low volatility setups present themselves in one form of classical chart pattern.
FLAG/PENNANT is short-term cont. chart pattern https://twitter.com/TechCharts/status/1253245419515269121">https://twitter.com/TechChart...
Low volatility setups present themselves in one form of classical chart pattern.
FLAG/PENNANT is short-term cont. chart pattern https://twitter.com/TechCharts/status/1253245419515269121">https://twitter.com/TechChart...
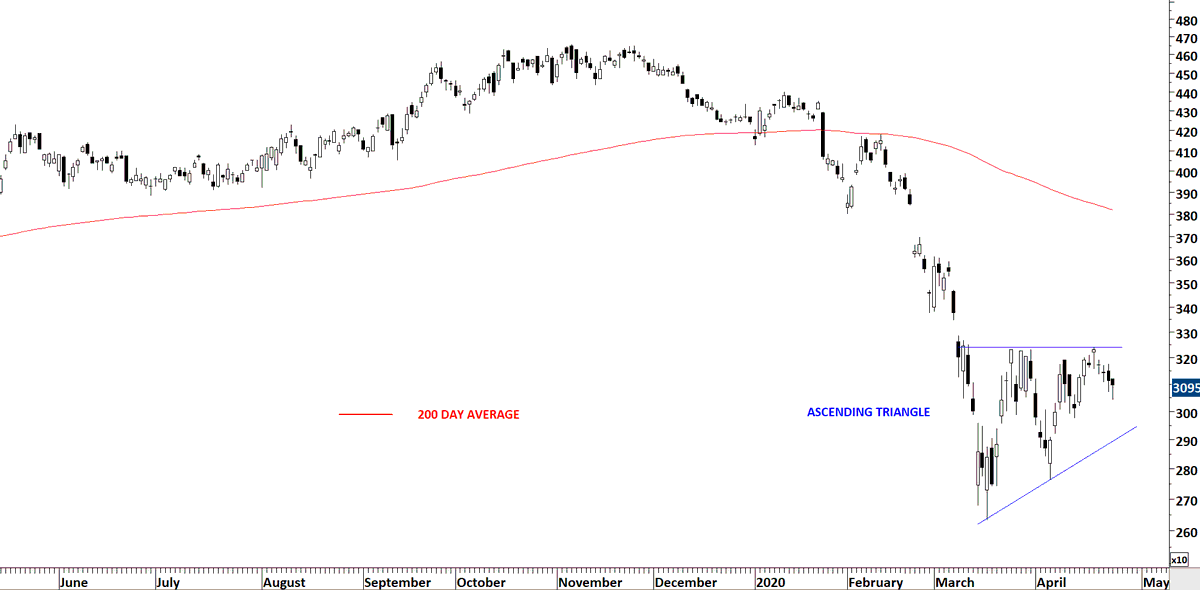
Sometime the stock will not reverse with a V bottom, but also not test exactly the same lows to call it a double bottom. Give it some time. Especially if it is a short-term chart patter.
Double bottoms can morph into #ascendingtriangles.
Double bottoms can morph into #ascendingtriangles.

 Read on Twitter


