Weekly COVID-19 in Japan Stats Update-at the critical two point after the state of emergency was declared. A mixture of bad but also some not so bad this week. Perhaps even some evidence of deceleration, which may result in better outcomes 1 to 2 weeks henceforth?
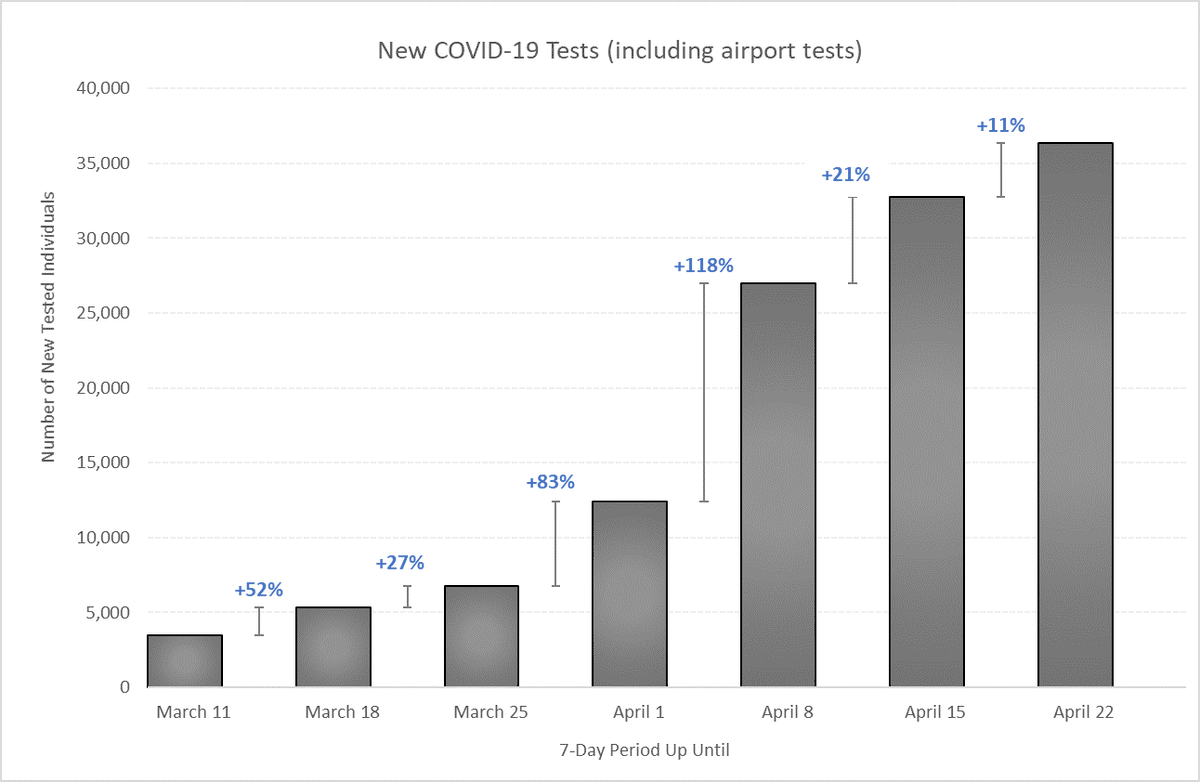
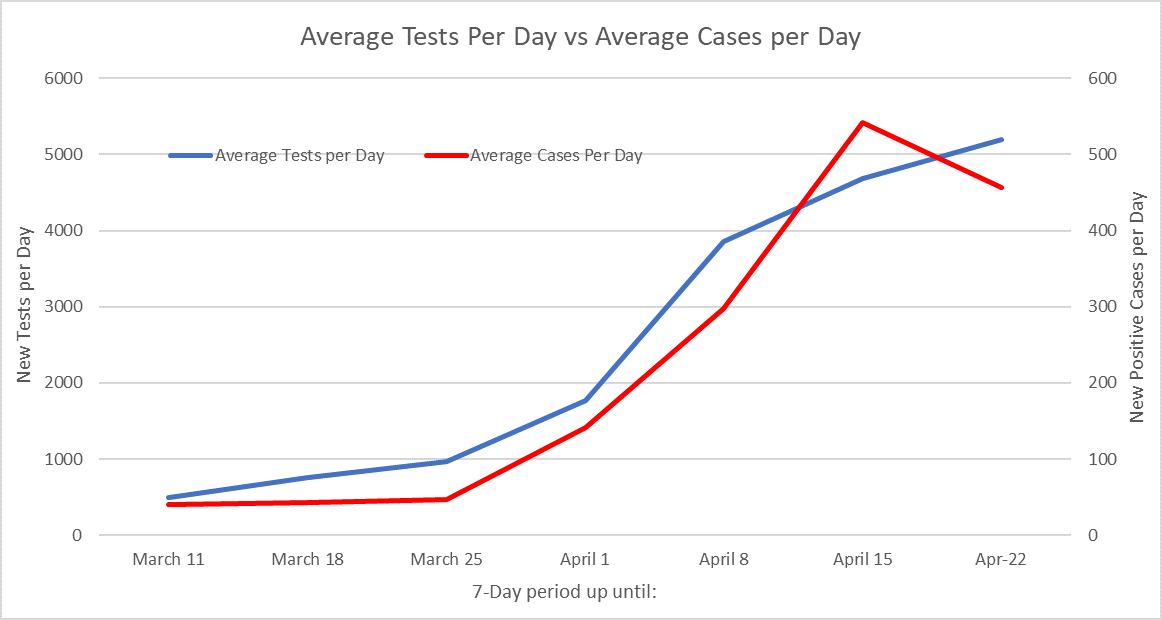
First, the indicator from which all else seems to flow: Testing. There was a small uptick in new tests compared to the previous week. This figure, including at-the-border tests, shows that three times the number of tests were conducted this week compared to the week up to April 1
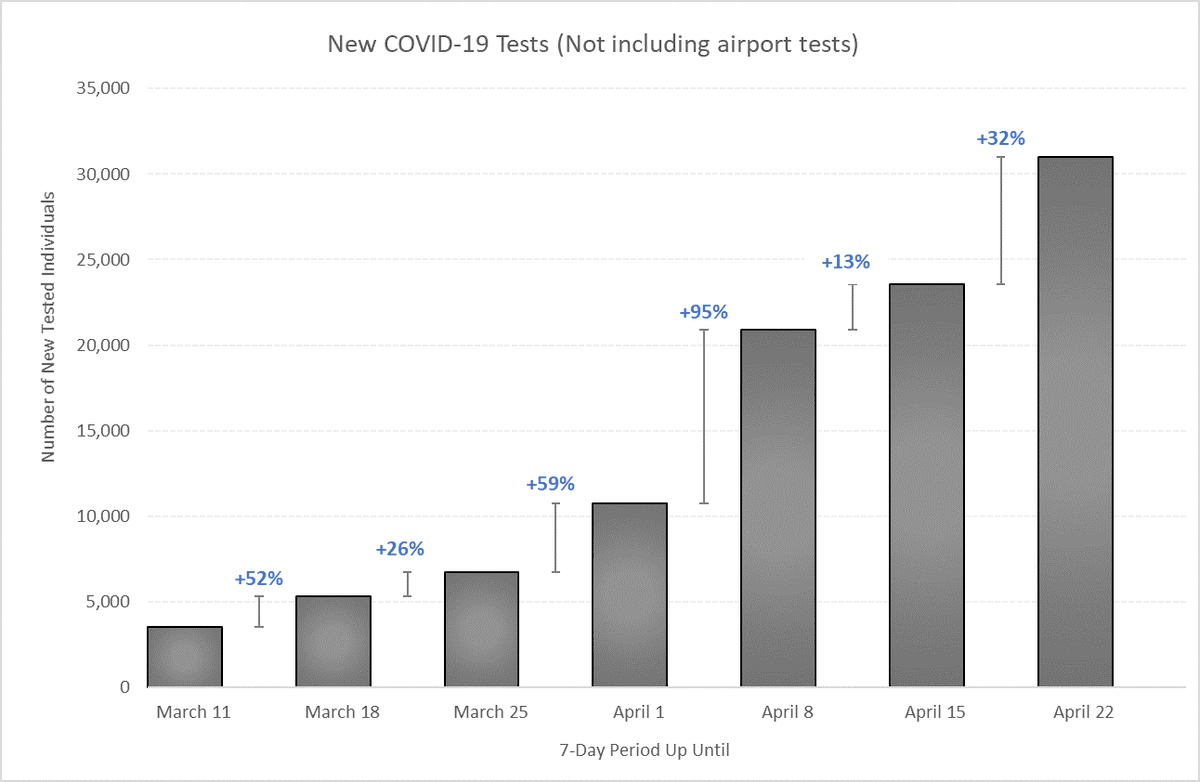
As the number of new arrivals into the country collapses, less at-the-border testing is taking place compared to previous weeks. So, there was actually a much healthier and consistent increase in internal new tests being conducted.
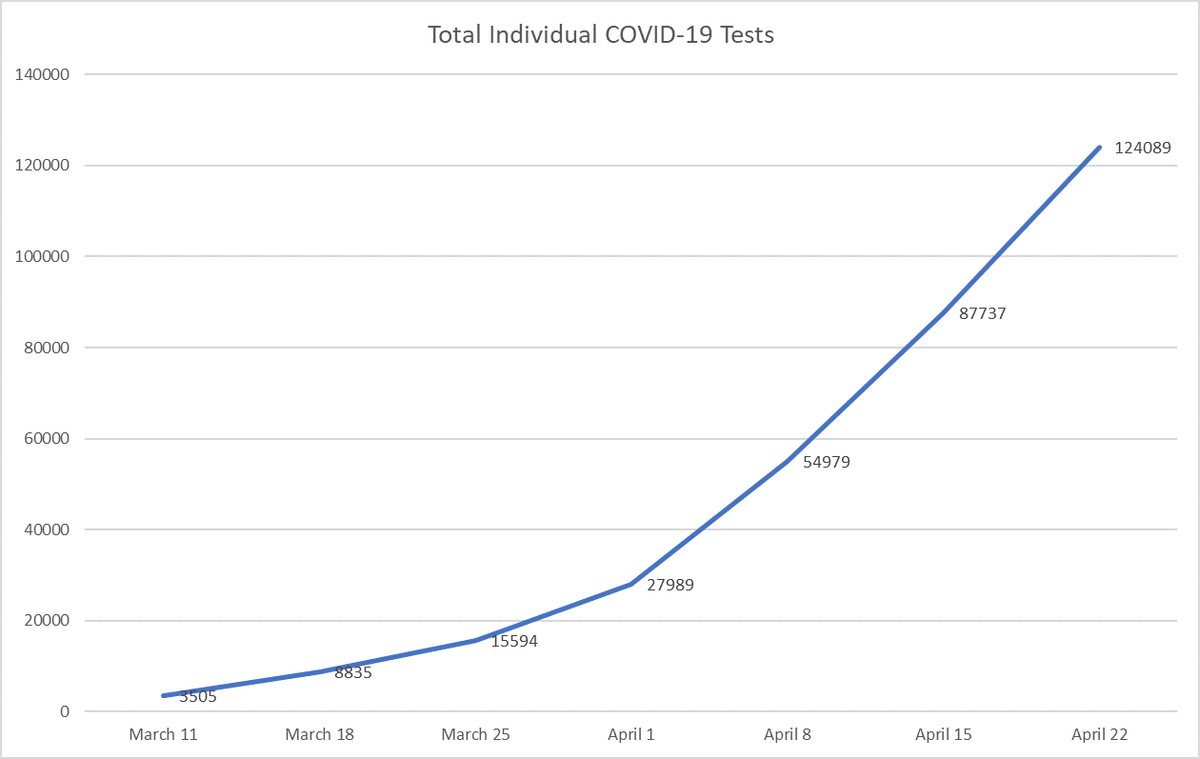
Since the start of April, the total number of individuals tested has quadrupled from just under 28,000 to around 124,000.
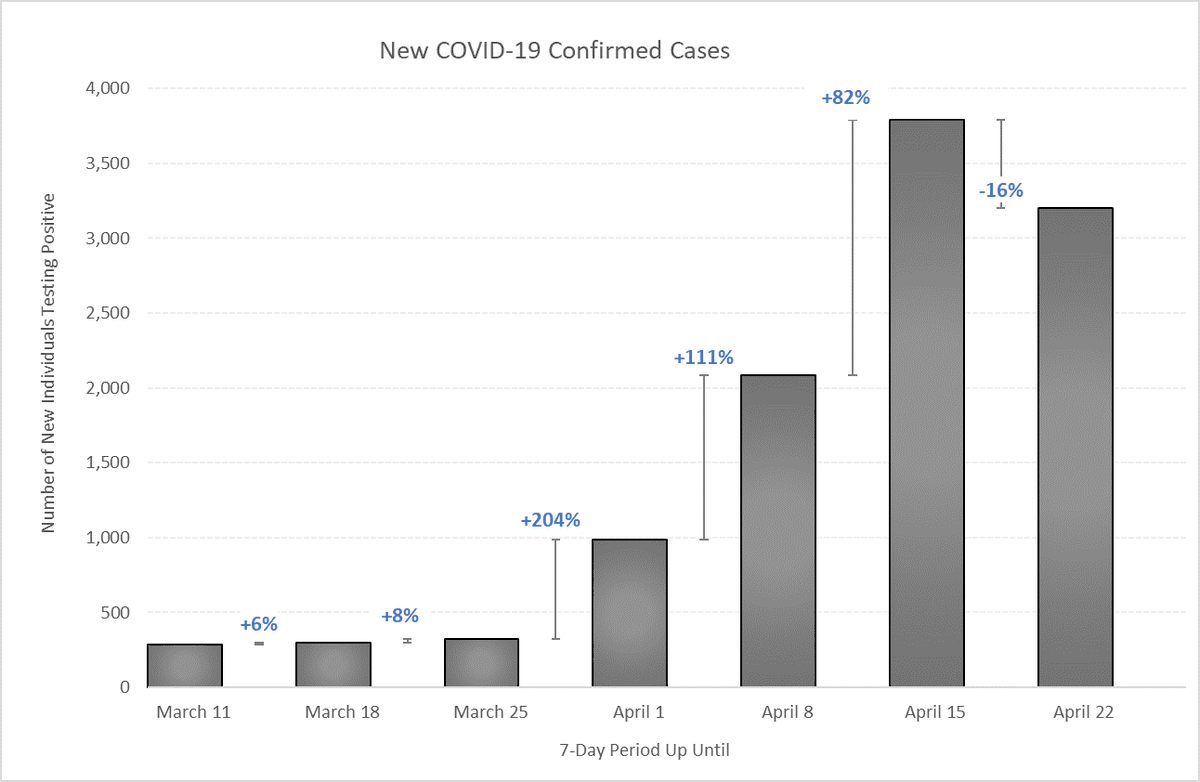
New confirmed cases thankfully decreased somewhat this week despite additional internal testing. The first time this has happened nationally.
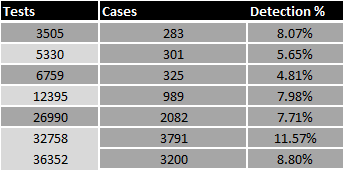
The detection percentage thus dropped back under 10% despite last week& #39;s spike. A figure around 3-4% is probably desirable from international experience.
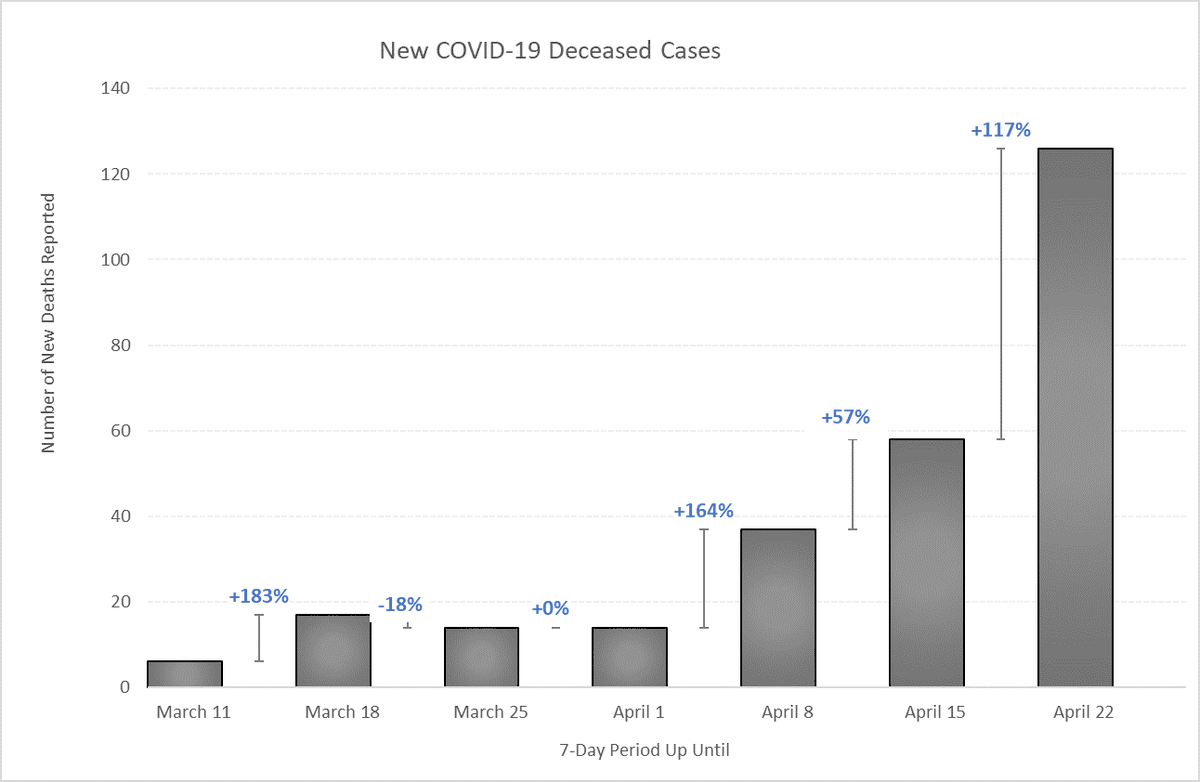
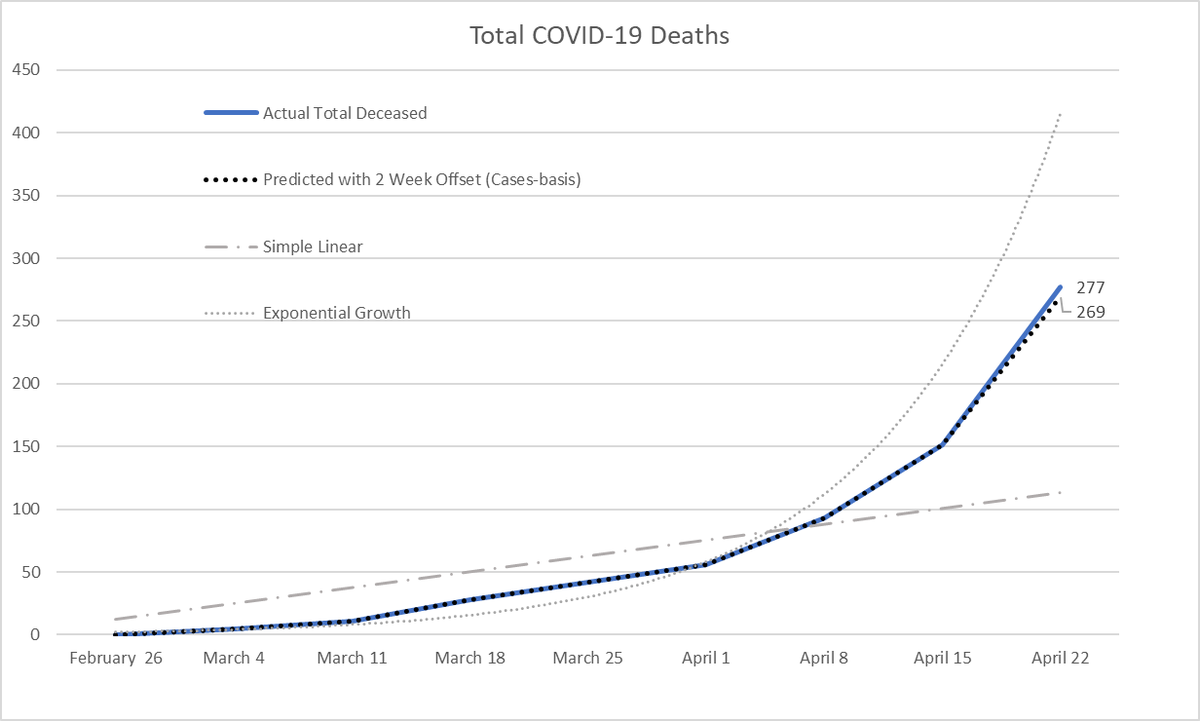
The bad news, however, is the big leap in deceased cases. In short, a week-on-week doubling of new cases.
That said, this was not wholly unexpected given the big jump in active serious cases (those requiring ICU admission and/or respiratory assistance) last week, which is a leading indicator (see later in thread) https://twitter.com/CoreyJWallace/status/1250678714758647808?s=20">https://twitter.com/CoreyJWal...
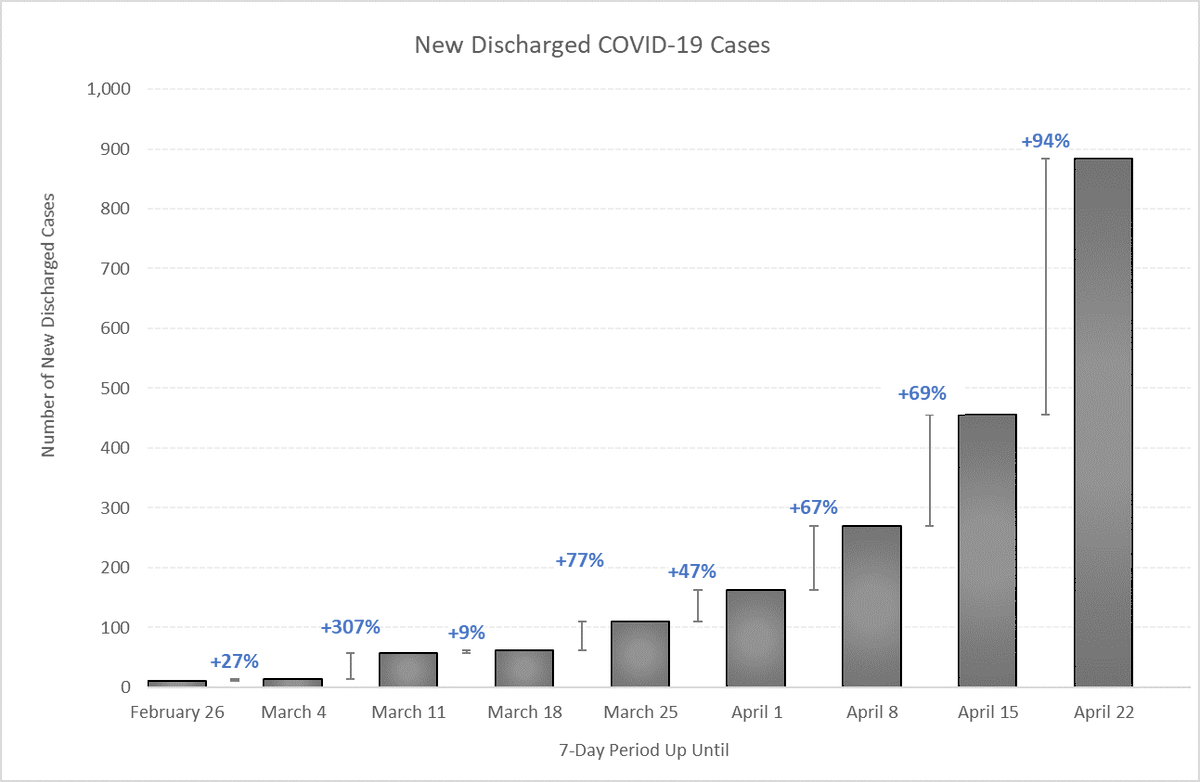
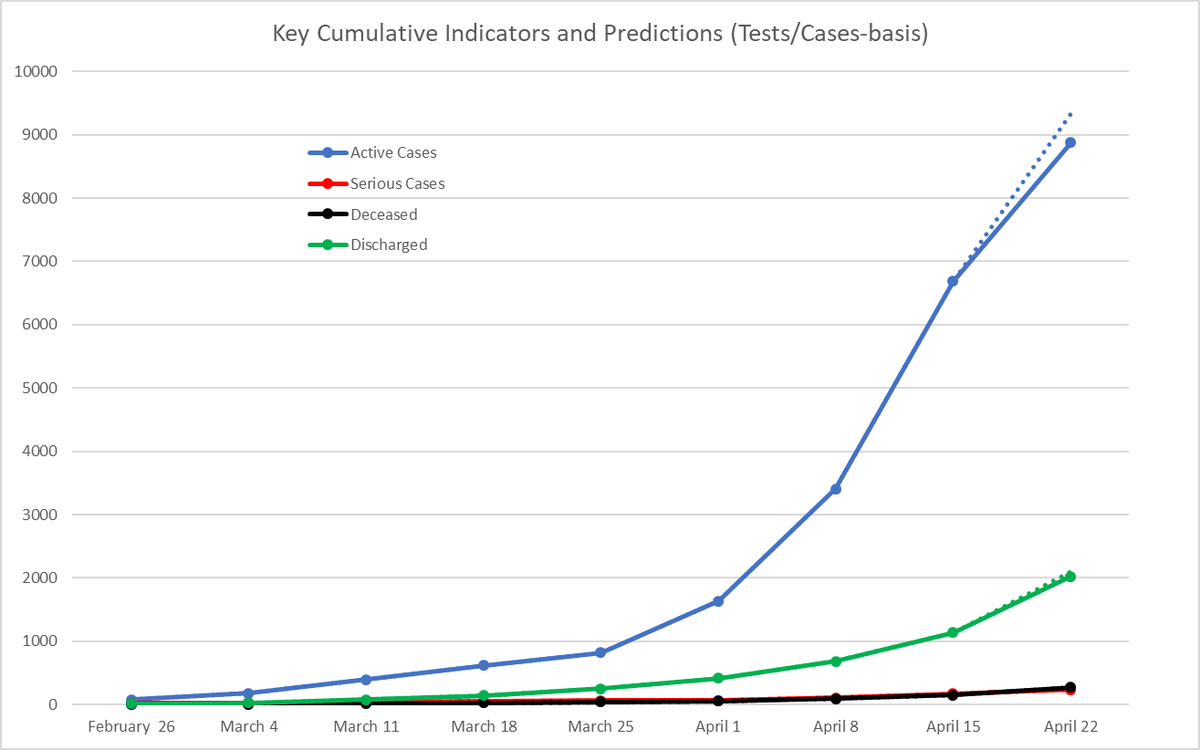
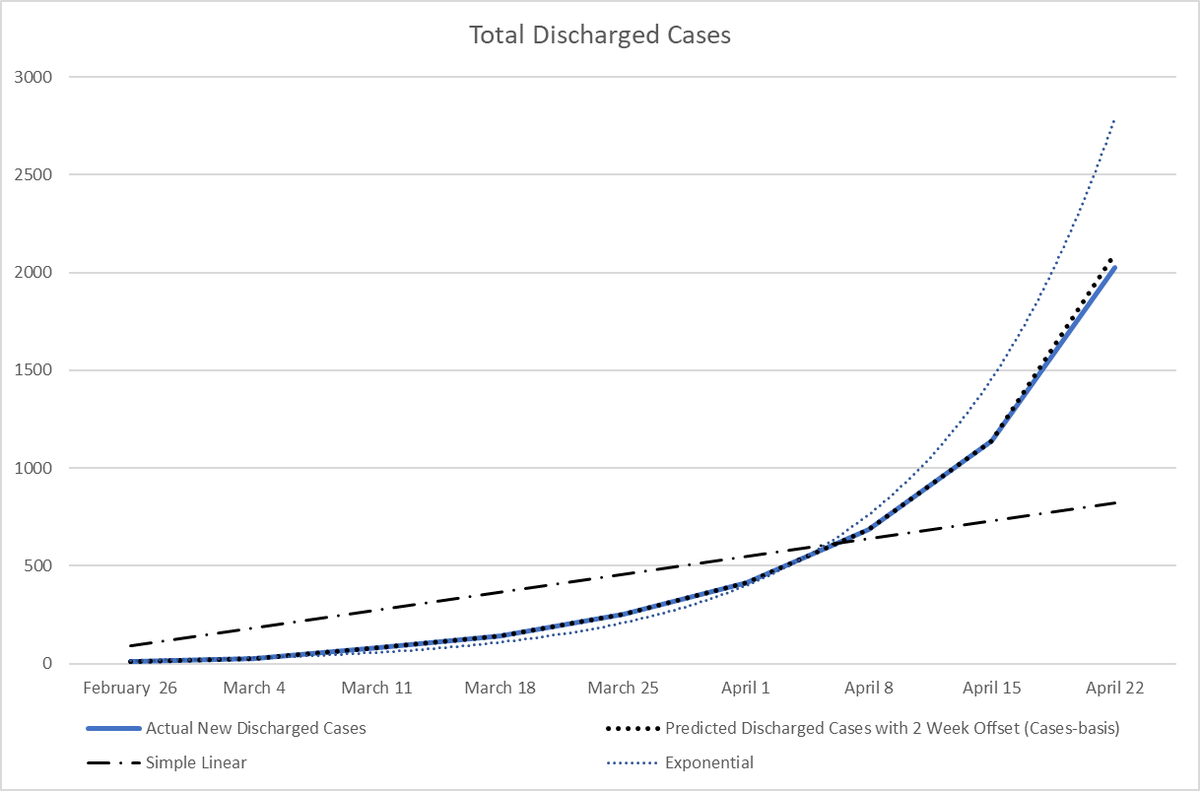
One major change over the last couple of weeks has been in the numbers discharged. Big jump this week in particular. Again not surprising given policy changes and time, but a healthy indicator if not for what it means for the burden on health institutions.
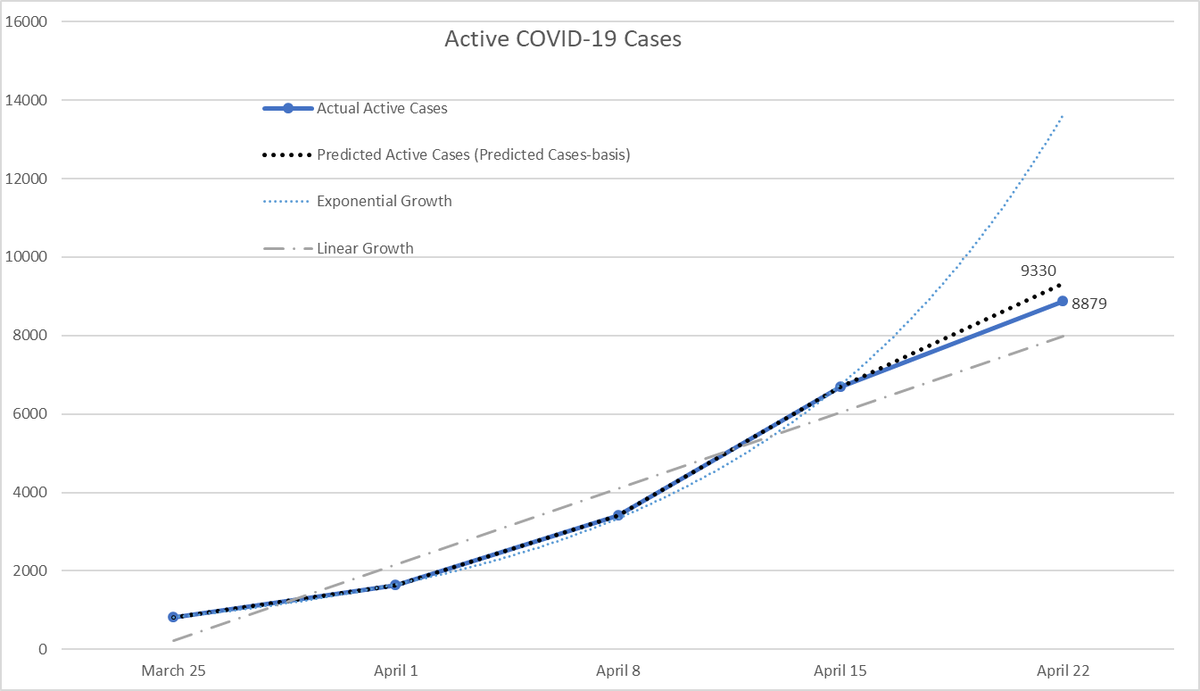
The number of new discharged cases was a major factor in keeping the number of & #39;actives cases& #39; lower than projected totals (more so than deceased). The blue dotted line is roughly where I would have expected active cases to have been based on 36,000 odd tests (linear regression).
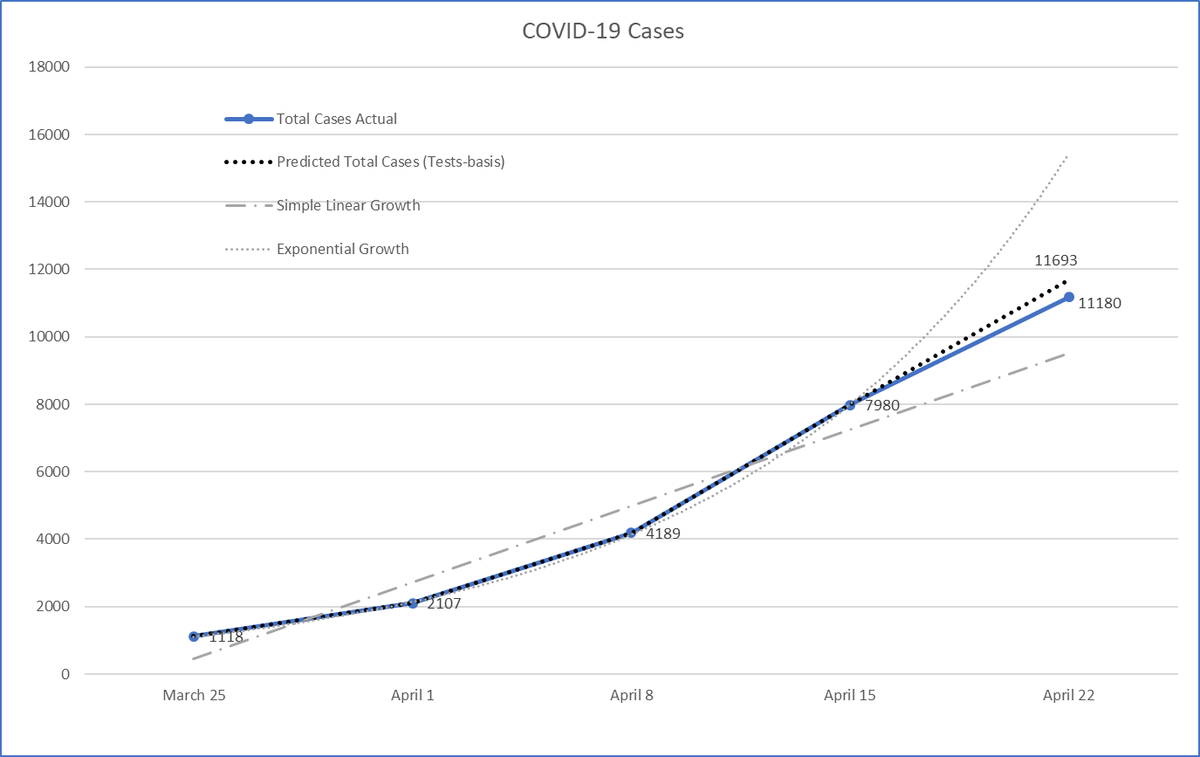
Also helpful was a lower than predicted number of total cases at the end of this week (simple exponential and linear trend lines included as well as prediction using test number-based regression).
For more detail, here is the figure for active cases with the other trend reference points. In the previous few weeks this was following a weekly doubling trajectory, so going in a better direction.
Discharged cases stayed on a weekly doubling trajectory as well, with the best fit (ie highest R², good SS) being between confirmed new cases and discharged patients 2 weeks subsequent.
Likewise, confirmed cases were a good fit for deceased cases two weeks subsequent. If accurate, we should probably brace for at least another week of significantly increasing deceased cases.
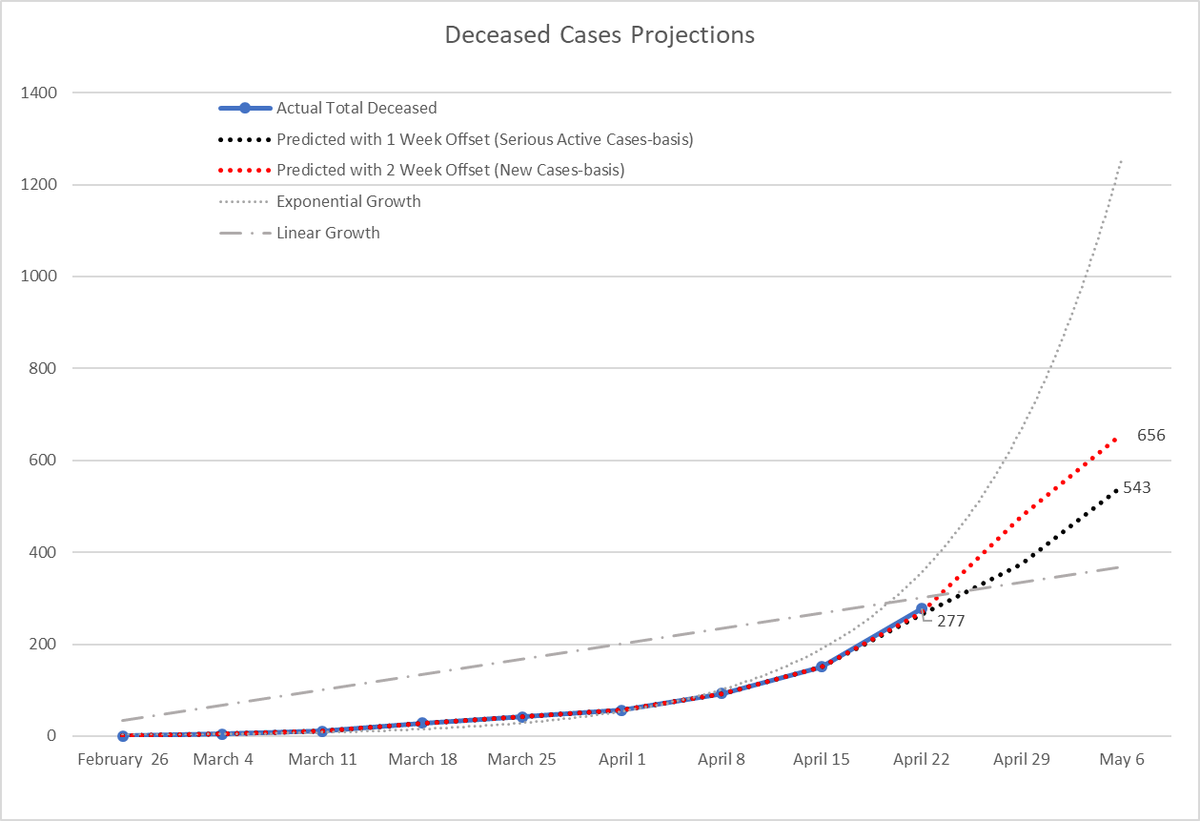
Deceased cases and serious active cases (offset by one week) also show a good fit. Both projections point to a two-week doubling of total deceased COVID-19 patients based on current trends.
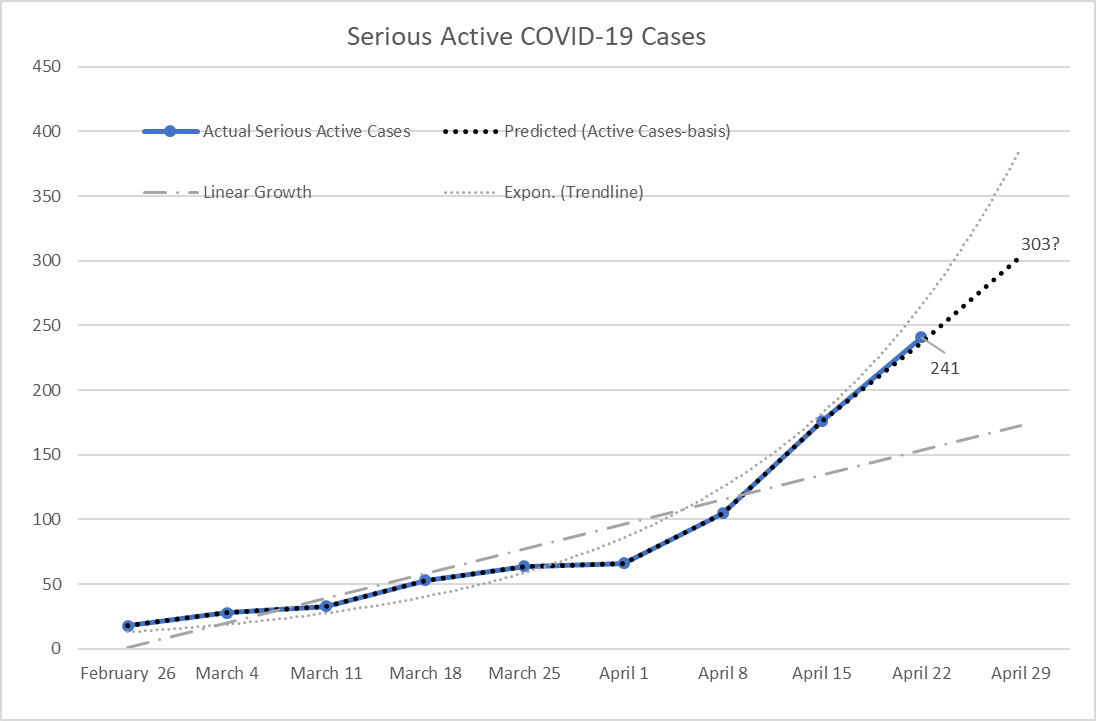
Serious active cases (as a function of active cases) has for some time been hugging a weekly doubling trajectory, although this week did there was a small deceleration in the rate of increase compared to the previous week.
Thus, if the active cases metric & #39;only& #39; grows by the same rate as the previous week (rather than doubling as it did in weeks prior) it would suggest the actual number of serious active cases will sit closer to 300 rather than the 400 predicted by the exponential function.
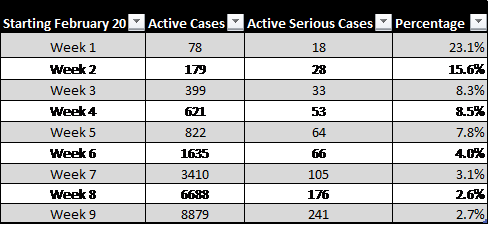
Finally, here& #39;s the table for active serious cases as a percentage of active cases. It& #39;s very low, although important to note that MHLW publishes net daily figures rather than gross figures for ICU admissions etc.
So can& #39;t precisely compare how many Japanese cases are serious with elsewhere. In the US, for example, it is estimated somewhere between 4.9% and 11.5% require ICU admission at some point. https://www.statista.com/statistics/1105420/covid-icu-admission-rates-us-by-age-group/">https://www.statista.com/statistic...

 Read on Twitter