1/ OK. Lots of charts making their way around comparing deaths Year-over-Year.
I pulled the data from the CDC for the last 3 years comparing influenza, pneumonia, COVID-19 and ALL Deaths.
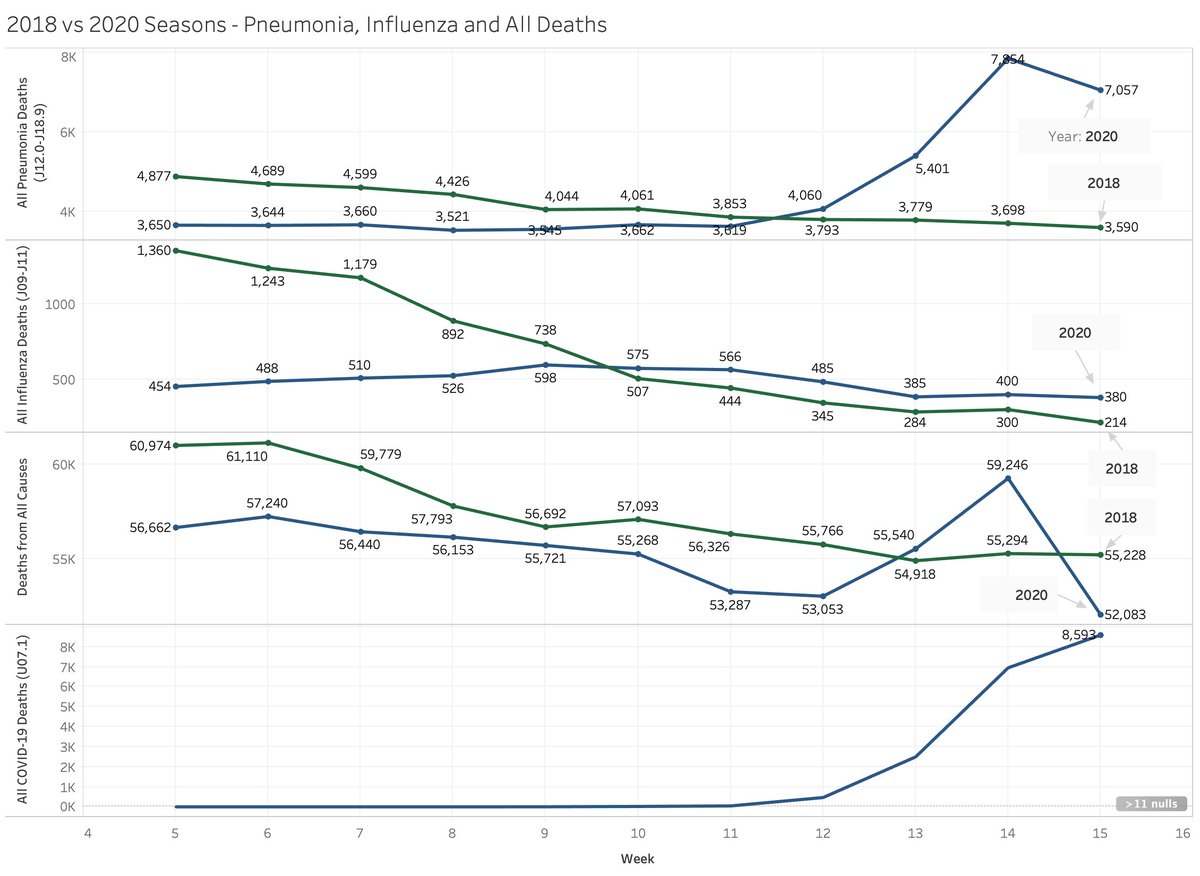
Let& #39;s start with 2020 vs 2018 (one of the higher flu seasons in the past 10 years)
I pulled the data from the CDC for the last 3 years comparing influenza, pneumonia, COVID-19 and ALL Deaths.
Let& #39;s start with 2020 vs 2018 (one of the higher flu seasons in the past 10 years)
2/ So first thing to notice is that the 2020 data will normalize over time. The "lagging" deaths may (or may not) roll up - so we& #39;ll see.
Note that influenza deaths in 2018 were significant that year.
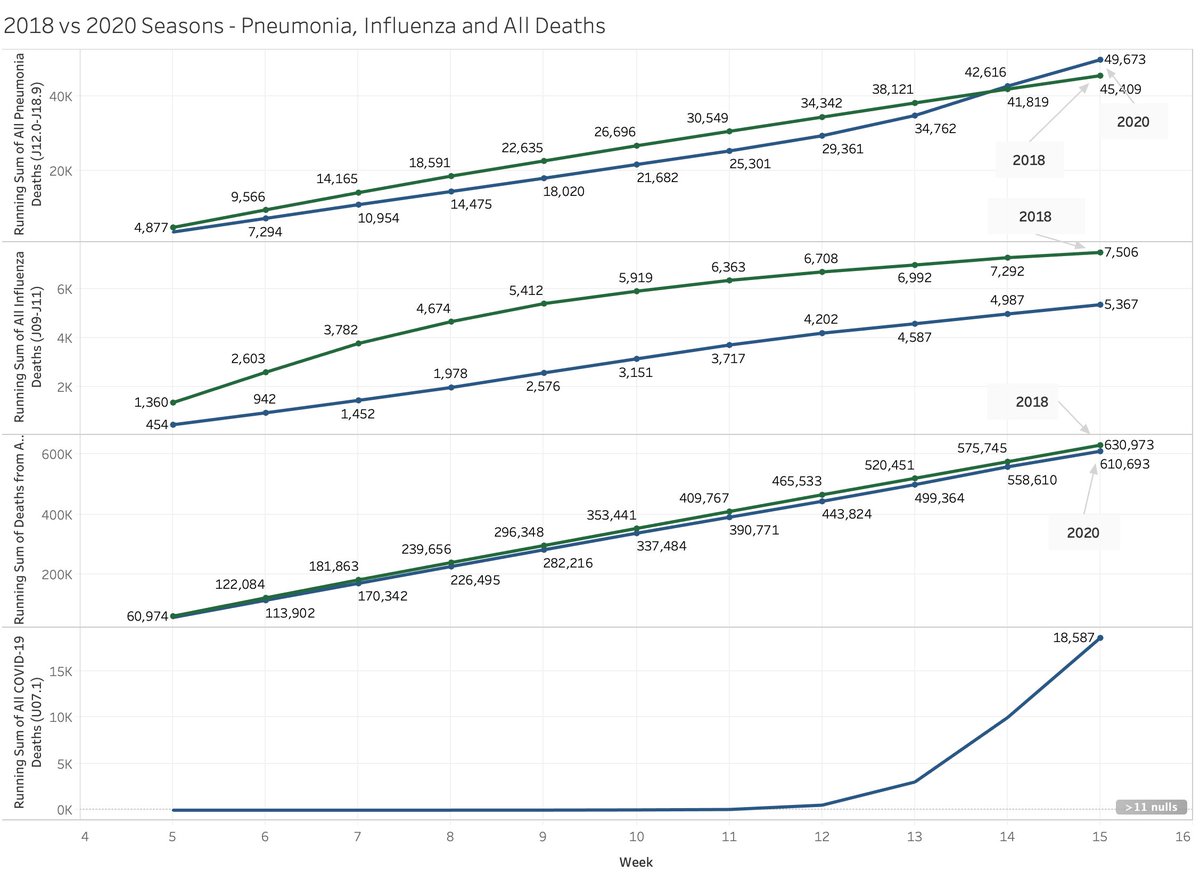
When these add up cumulatively you can see that things kind of "even out".
Note that influenza deaths in 2018 were significant that year.
When these add up cumulatively you can see that things kind of "even out".
3/
Note here:
- 2018 had 20K more deaths overall than 2020.
- Pneumonia deaths in 2020 overtook 2018 a week ago (more on this later though)
- Influenza total deaths in 2018 were 2200 higher than 2018
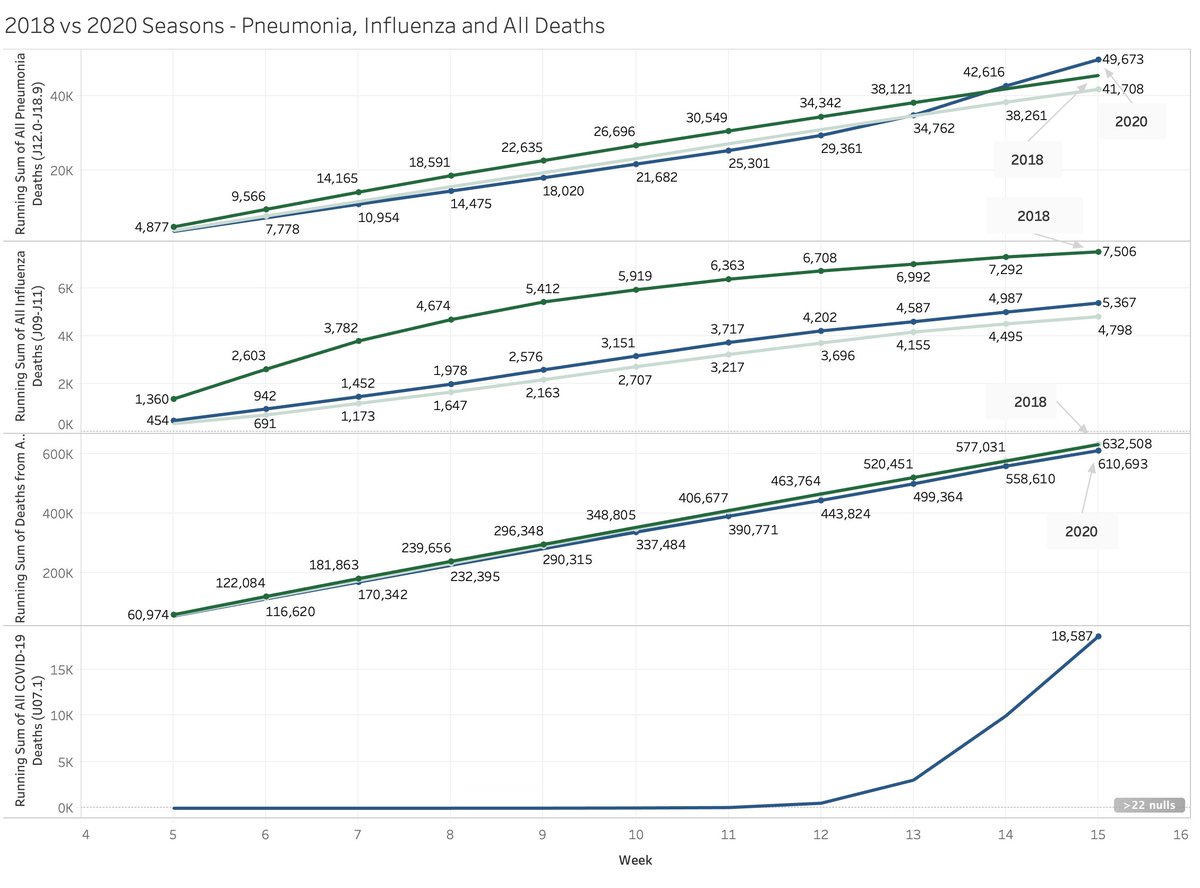
Let& #39;s be fair and add in a lower influenza year like 2019
Note here:
- 2018 had 20K more deaths overall than 2020.
- Pneumonia deaths in 2020 overtook 2018 a week ago (more on this later though)
- Influenza total deaths in 2018 were 2200 higher than 2018
Let& #39;s be fair and add in a lower influenza year like 2019
4/ 2019 was slightly lower than 2020 in overall deaths but higher than 2020.
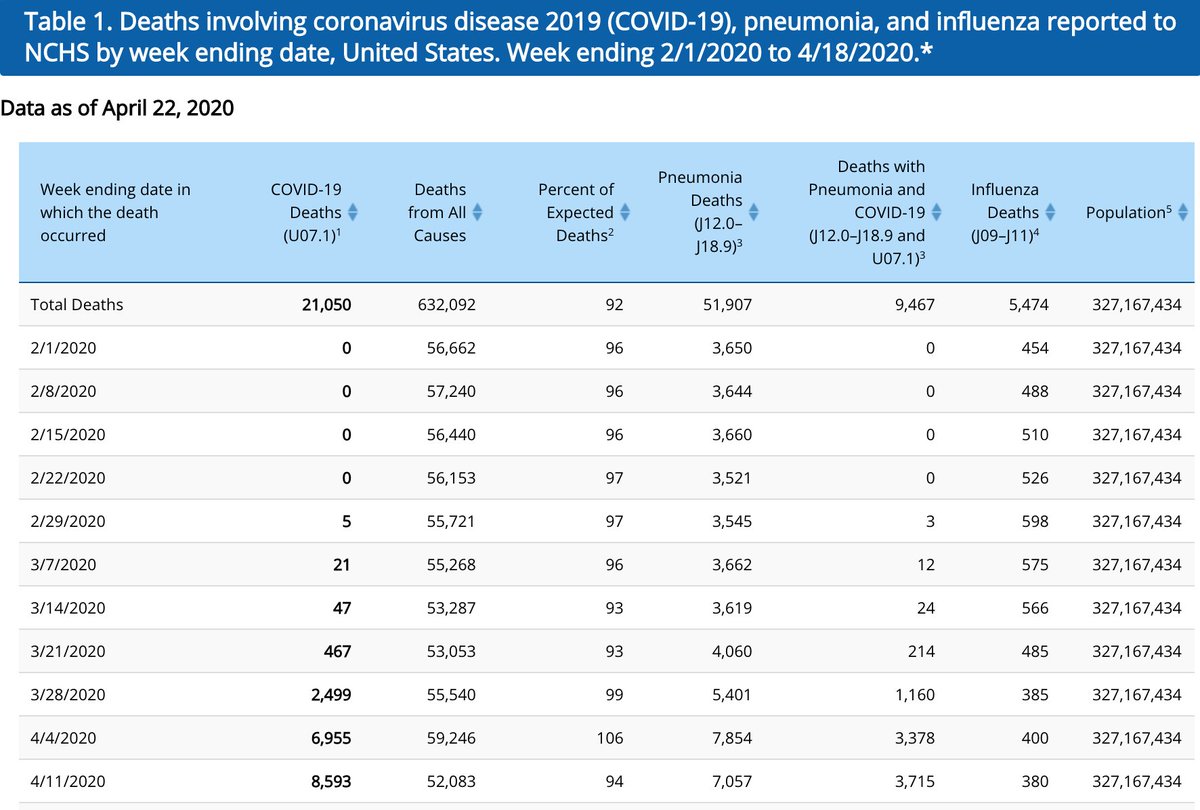
Let& #39;s revisit a very special stat which the CDC provides here:
https://www.cdc.gov/nchs/nvss/vsrr/covid19/index.htm?fbclid=IwAR2x1iONe5qI7G_VywM4KkHX8YeMeR8h3_HmEh2Hj_s6YovAvQ7iSPzrsdk">https://www.cdc.gov/nchs/nvss...
Let& #39;s revisit a very special stat which the CDC provides here:
https://www.cdc.gov/nchs/nvss/vsrr/covid19/index.htm?fbclid=IwAR2x1iONe5qI7G_VywM4KkHX8YeMeR8h3_HmEh2Hj_s6YovAvQ7iSPzrsdk">https://www.cdc.gov/nchs/nvss...
5/ So the column: "Deaths with Pneumonia and COVID-19 (J12.0-J18.9 and U07.1)" indicated that a portion of the influenza deaths are ALSO included in the pneumonia deaths. If you take that out of either column (all covid or all pneu.) things even out even more.
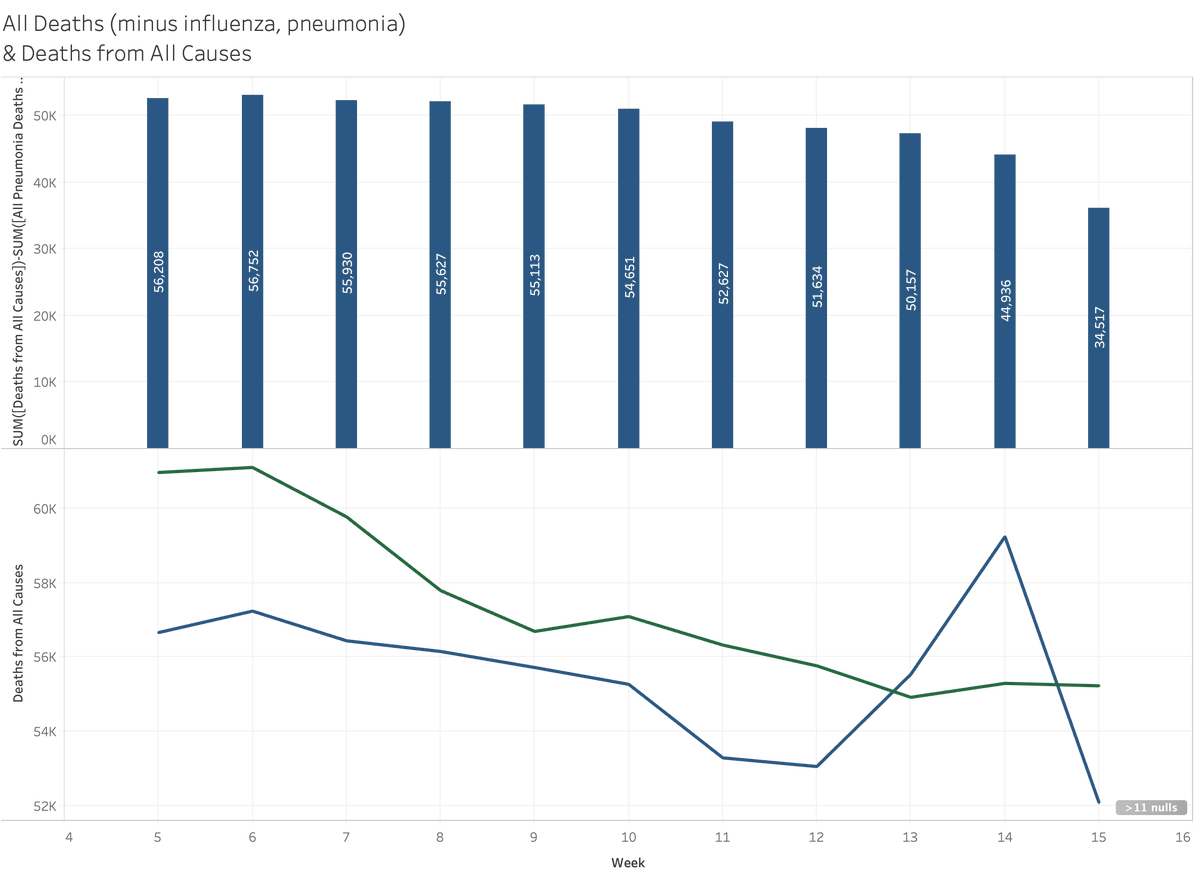
6/ Now let& #39;s take out influenza, pneumonia and COVID to understand what is happening while we& #39;re all sitting at home.
It seems we& #39;ve had roughly 20K to 30K fewer deaths this year because of... stay-at-home orders? More on that at a later time.
It seems we& #39;ve had roughly 20K to 30K fewer deaths this year because of... stay-at-home orders? More on that at a later time.
7/ Bottom line. A lot of us... including myself have latched onto some of this data to demonstrate some equilibrium of numbers but it& #39;s still WAY TOO EARLY to make any sense of this. I& #39;ve dubbed this the "can& #39;t cheat death" theory - but I can& #39;t support or deny it outright now.
You can check the sources yourself:
https://gis.cdc.gov/grasp/fluview/mortality.html
And">https://gis.cdc.gov/grasp/flu... here& #39;s a dataset from 2020:
https://data.cdc.gov/api/views/hc4f-j6nb/rows.csv?accessType=DOWNLOAD&bom=true&format=true">https://data.cdc.gov/api/views...
https://gis.cdc.gov/grasp/fluview/mortality.html
And">https://gis.cdc.gov/grasp/flu... here& #39;s a dataset from 2020:
https://data.cdc.gov/api/views/hc4f-j6nb/rows.csv?accessType=DOWNLOAD&bom=true&format=true">https://data.cdc.gov/api/views...

 Read on Twitter