An alternative analysis of goal creation
In this thread, I will try to find a new way to measure the goal creating ability of the PL players by putting their numbers into context.
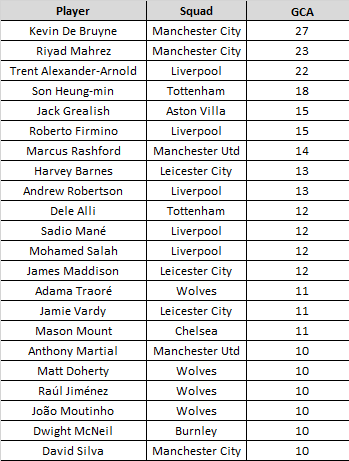
First of all, let& #39;s see which players have the highest GCA numbers this season:
In this thread, I will try to find a new way to measure the goal creating ability of the PL players by putting their numbers into context.
First of all, let& #39;s see which players have the highest GCA numbers this season:
Lets define GCA real quick:
GCA -- Goal-Creating Actions
The two offensive actions directly leading to a goal, such as passes, dribbles and drawing fouls.
GCA -- Goal-Creating Actions
The two offensive actions directly leading to a goal, such as passes, dribbles and drawing fouls.
fbref’s new additions, Goal Creating Actions (GCA) and Shot Creating Actions (SCA) were used as a proxy of creativity by a lot of people last week. This is all great but I was wondering, is there a way to put these stats into context? There is no such stat as unsuccessful GCA/SCA
Or is it? We can say that most of these actions are created in the final third, so what if we use the touches in the attacking 3rd data? Let’s assume that every touch in that area is a possible threat to create a shot or a goal.
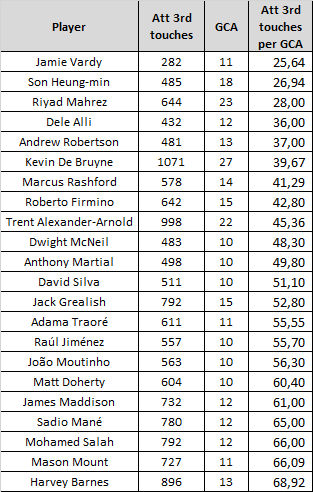
This is how our group stands after the adjustment:
This is how our group stands after the adjustment:
In this case the lower the number is the better. For example, Vardy& #39;s 25,64 means he creates 1 GCA for every 26th touch in the attacking 3rd.
As you can see, De Bruyne and TAA fell back a bit, while Vardy, Son, and Mahrez are head and shoulders above the rest of the players.
As you can see, De Bruyne and TAA fell back a bit, while Vardy, Son, and Mahrez are head and shoulders above the rest of the players.
So you might be asking, who are the most threatening players then? No worries, I got you covered, here is the top 20! (min 200 touches)
The top 3 is unchanged but there are a few unexpected names on this list – Benteke, Williams, or Mousett could be surprising for many of us.
The top 3 is unchanged but there are a few unexpected names on this list – Benteke, Williams, or Mousett could be surprising for many of us.
This thread was inspired by @colintrainor ’s article from 2013 on @OptaSports.
If you want to read the original piece here you go: https://www.optasportspro.com/news-analysis/blog-an-alternative-analysis-of-key-passes/
data:">https://www.optasportspro.com/news-anal... @fbref
If you want to read the original piece here you go: https://www.optasportspro.com/news-analysis/blog-an-alternative-analysis-of-key-passes/
data:">https://www.optasportspro.com/news-anal... @fbref
Hope you liked this short experiment.
Any feedback is welcome, tell me what do you think about this metric!
Any feedback is welcome, tell me what do you think about this metric!

 Read on Twitter


