The Swedish CDC @Folkhalsomynd released a (now retracted) report yesterday with a mathematical model for the number of infected in the Stockholm area. Since the report was only available in Swedish, here is a short summary:
Thread.
Thread.
1/ Starting with some background. The model focuses on Stockholm Län (i.e. the “county” Stockholm belongs to), which is the hardest hit region in Sweden.
(from April 10th as in the report)
- Total population: 2 374 550
- Confirmed cases: 4128 (now 6400)
- Deaths: 510 (now 1070)
(from April 10th as in the report)
- Total population: 2 374 550
- Confirmed cases: 4128 (now 6400)
- Deaths: 510 (now 1070)
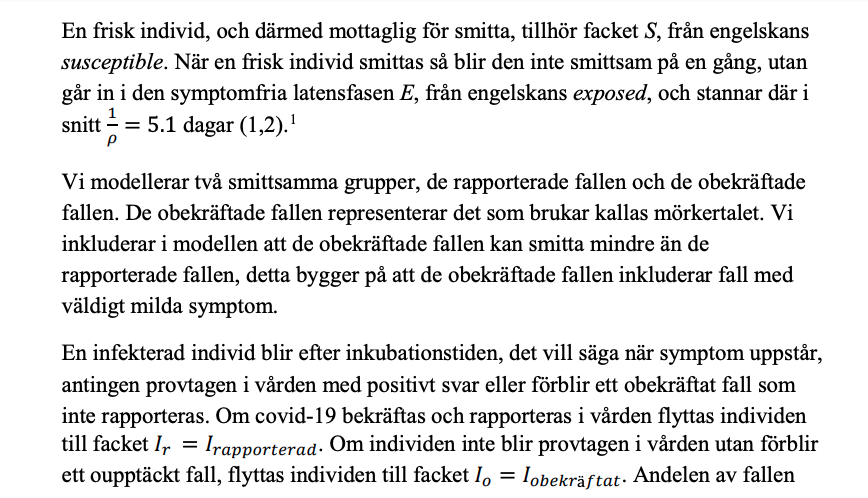
2/ They use a compartment model, dividing the population into 5 groups:
- S: susceptible individuals (not yet infected)
- E: exposed (incubation)
- I_r: reported infected (confirmed)
- I_o: unreported infected
- R: recovered
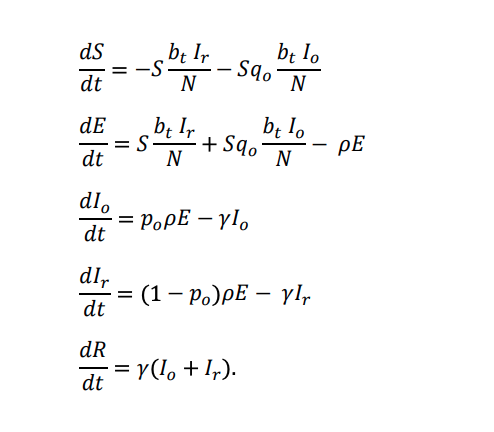
related by a system of equations:
- S: susceptible individuals (not yet infected)
- E: exposed (incubation)
- I_r: reported infected (confirmed)
- I_o: unreported infected
- R: recovered
related by a system of equations:
3/ Individuals in S can get infected and will then move to E, where they incubate for an average of 1/𝜌 = 5.1 days. A fraction of these (p_o) are undetected (go into I_o) while the rest (1-p_o) go into I_r. After avg. 1/𝛾 = 5 days, both recover (move to R).
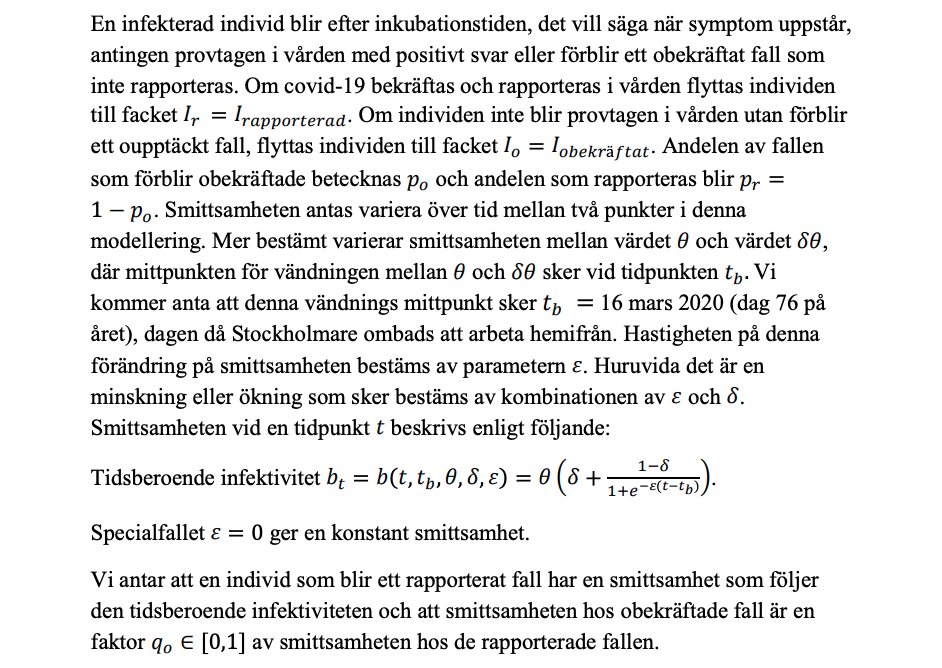
4/ The contagiousness of the virus at a given time (b_t) is treated as variable, starting at an initial value of 𝜽 and later stabilizing at 𝛿𝜽, with an assumed inflection point at March 16th, which is when Stockholm residents were asked to work remotely.
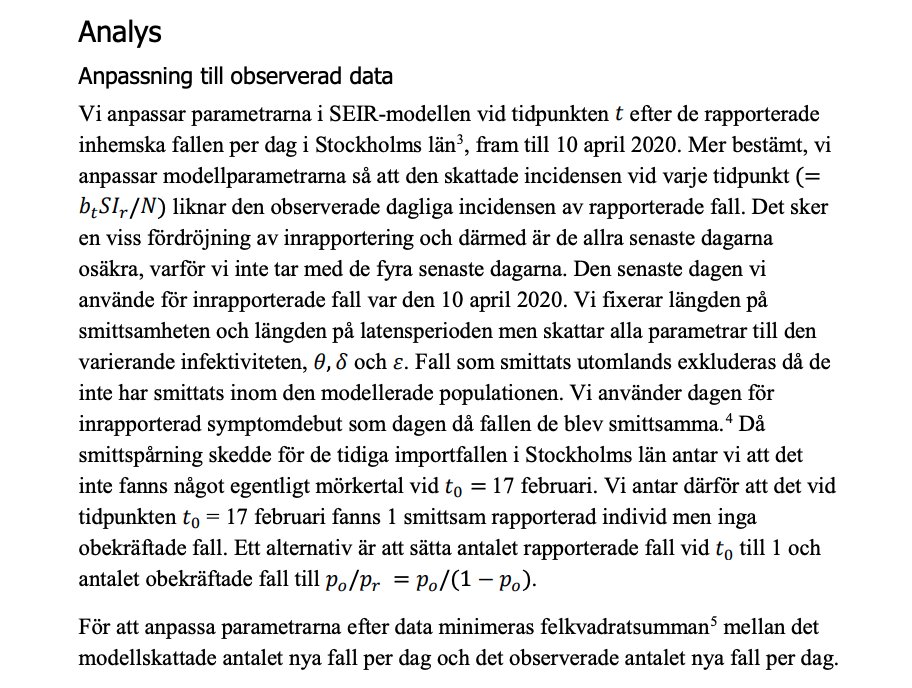
5/ To estimate b_t, (contagiousness at time t), they fit the parameters 𝛿, 𝜽, and ε to daily confirmed cases by minimizing the square error (residual) between the model prediction and observed (*non-imported*) daily cases. First case is assumed to be Feb 17th.
6/ To account for unconfirmed cases, it is assumed that for every confirmed case, there is some constant number of cases that are never detected. This is expressed as the ratio:
p_o = (unrep. cases)/(all cases)
Unreported cases are assumed to be less contagious by a factor q_o
p_o = (unrep. cases)/(all cases)
Unreported cases are assumed to be less contagious by a factor q_o
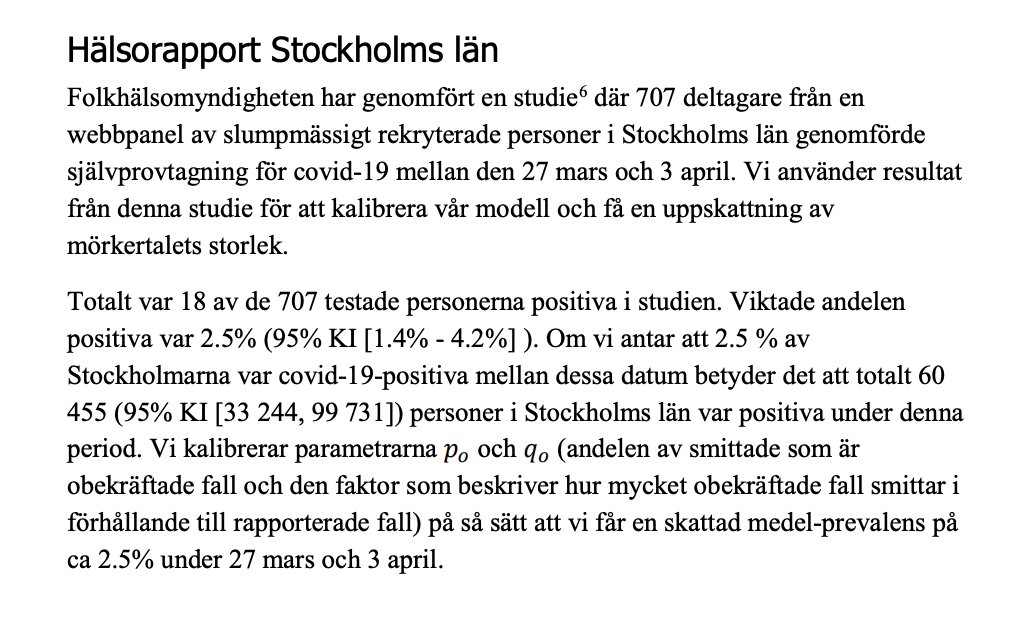
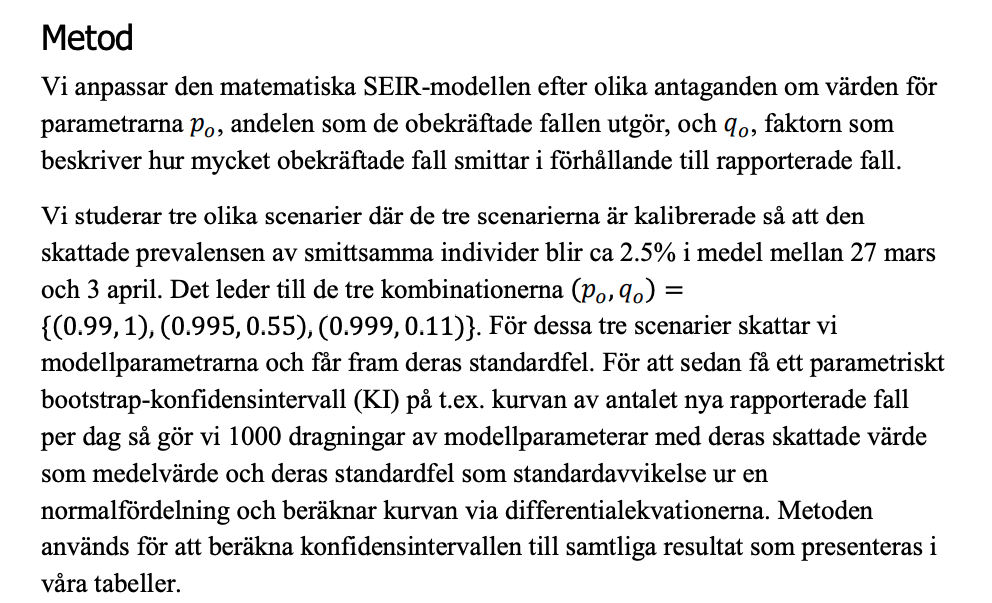
7/ To solve for the parameters p_o (fraction of total cases that are unreported) and q_o (infectiousness of unreported cases), they rely on a study from @Folkhalsomynd showing 2.5% of pop. in Stockholm Län tested positive for an active infection between March 27th and April 3rd.
8/ **Note**: as I was writing this thread, the report was retracted. The reason being that the Scenario 3 estimate below of p_o = 99.9% (previously reported as best fit) implies that the total number of infected exceeds the population of Stockholm.
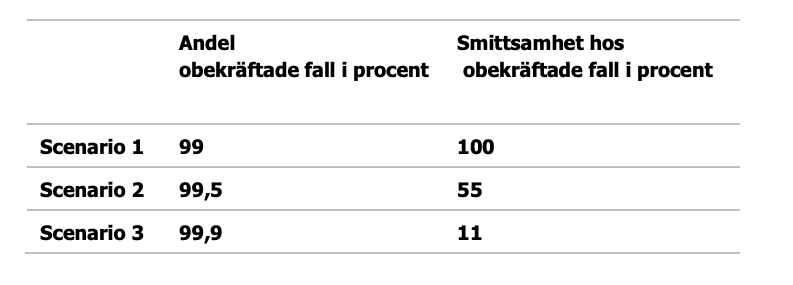
9/ They consider three combinations of (p_o, q_o) that match population prevalence of 2.5% in the above study.
Scenario 1: (0.99, 1)
Scenario 2: (0.995, 0.55)
Scenario 3: (0.999, 0.11)
i.e. between 100-1000 unconf. cases per confirmed, and unconf. cases are 11-100% infectious.
Scenario 1: (0.99, 1)
Scenario 2: (0.995, 0.55)
Scenario 3: (0.999, 0.11)
i.e. between 100-1000 unconf. cases per confirmed, and unconf. cases are 11-100% infectious.
10/ Because scenario 1 predicts a pop. prevalence of 2.3% (unlike 2.5% for scenarios 2 and 3), they do not include it in the full analysis. It is kept "only as a lower bound for the rate of unconf. cases".
11/ **Results**:
*Reminder: the report has now been retracted.*
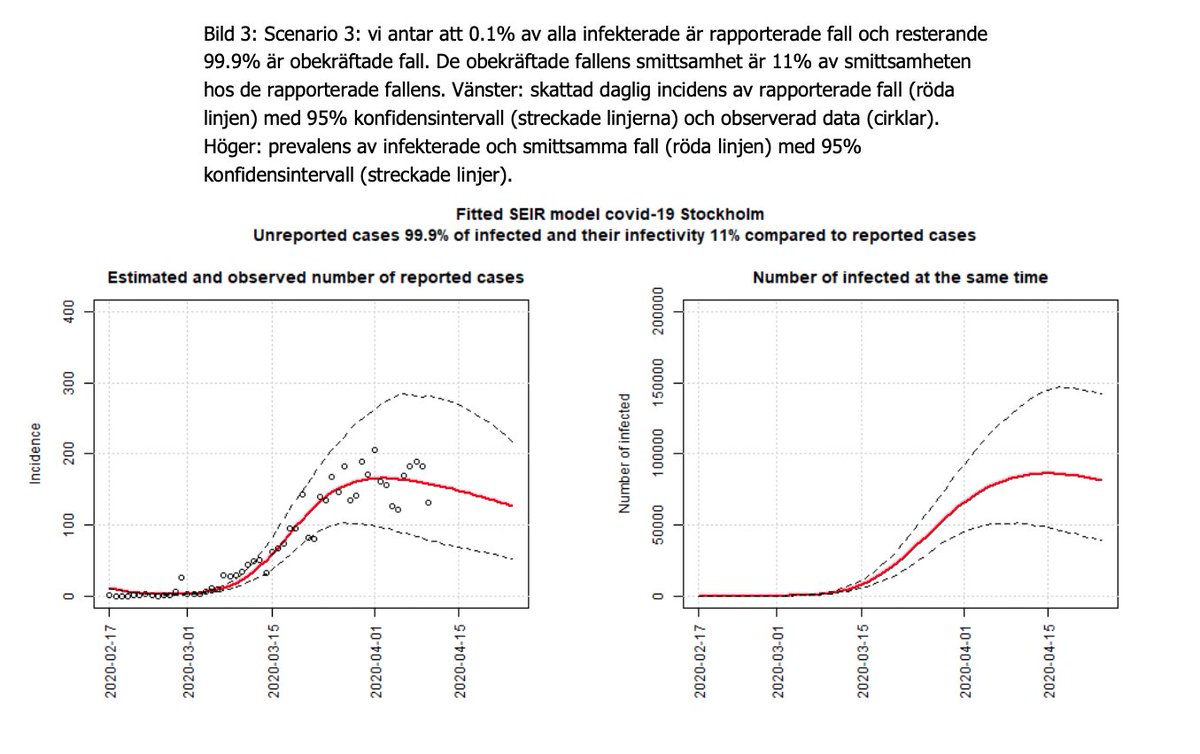
Overall, Scenario 3 was claimed to be the best fit to the data. This would imply 99.9% of all cases are undetected, with undetected cases being 11% as infectious.
*Reminder: the report has now been retracted.*
Overall, Scenario 3 was claimed to be the best fit to the data. This would imply 99.9% of all cases are undetected, with undetected cases being 11% as infectious.
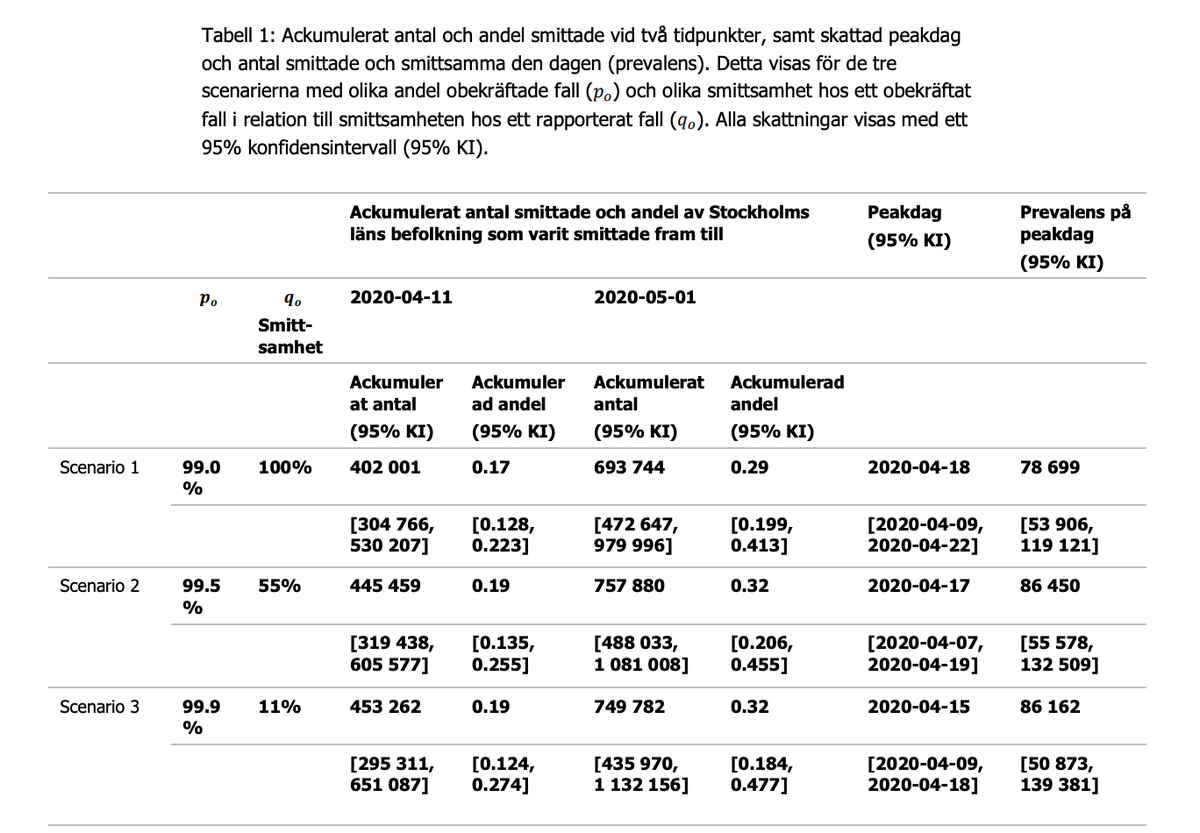
12/ Depending on scenario, they claim that the number of infected peaked between April 15th-17th, with a total of 86000 active infections.
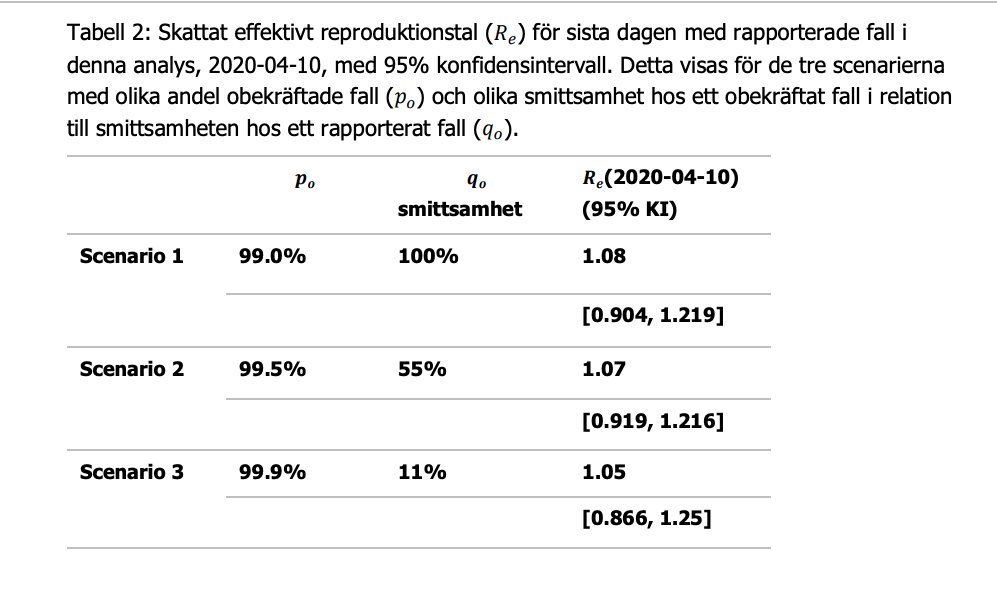
13/ R_e (effective number of new contagions per infected) was estimated to be just above 1 by April 10th:
14/ They estimated that by April 11th, 17-19% of Stockholm had been infected, and project 29-32% will be infected by May 1st.
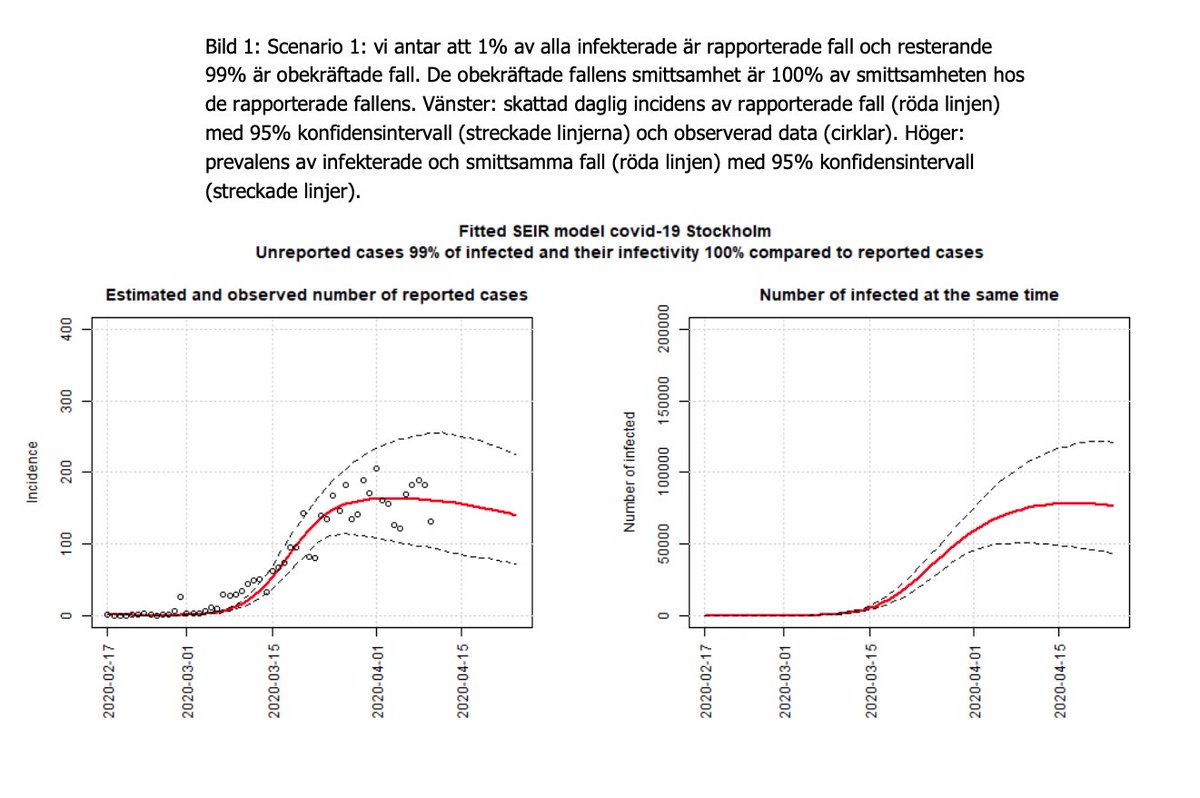
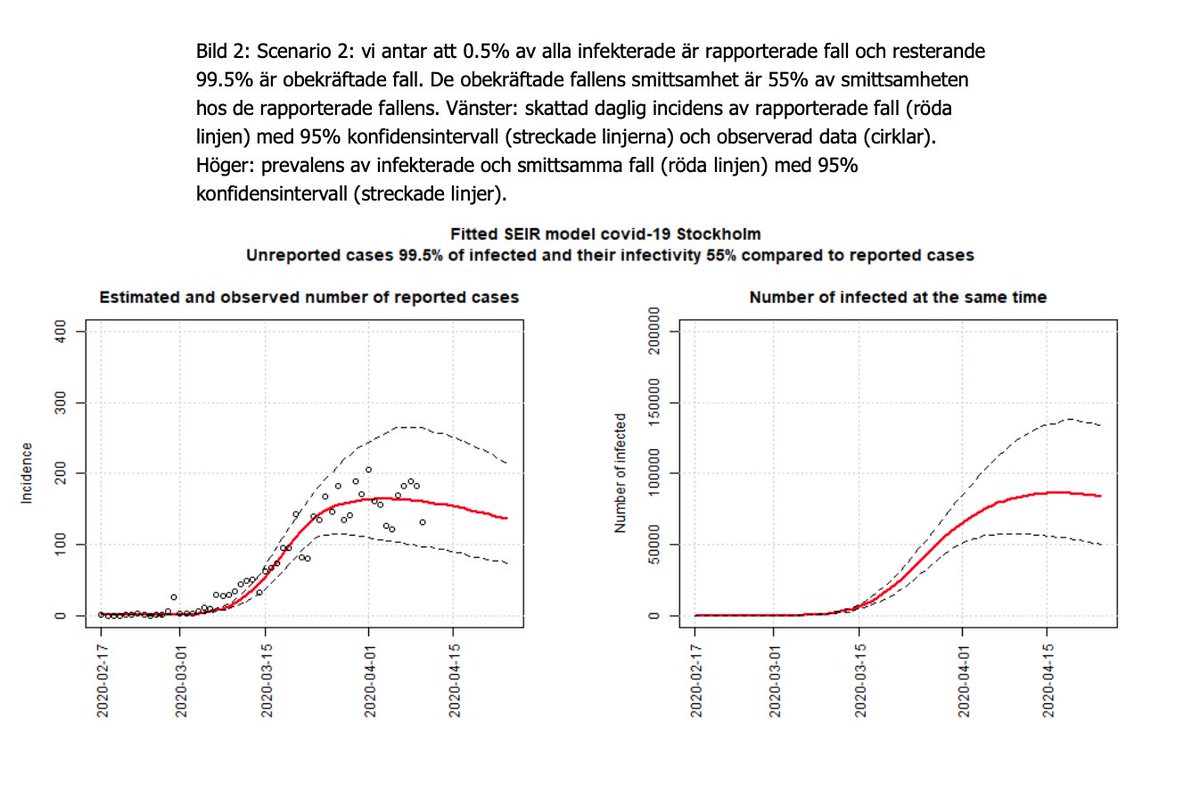
15/ The report includes nearly identical projections for each of the scenarios. On the left are the daily reported cases and on the right the number of infections at a given time.
16/ Finally, they apply some perturbations to (p_o, q_o) to estimate how sensitive the models are to error, but I& #39;m going to skip that since the entire thing has already been retracted.

 Read on Twitter