I hope so but I don& #39;t think so. Who thinks they have a shareable expert opinion on Sweden? https://www.cnbc.com/2020/04/22/no-lockdown-in-sweden-but-stockholm-could-see-herd-immunity-in-weeks.html">https://www.cnbc.com/2020/04/2...
Back in Sweden for a moment, estimating population immunity. First, its an open question whether infection, survival and antibodies really do provide immunity. That& #39;s a heck of a bet, but let& #39;s assume/hope that it does.
How might one estimate disease spread? 1/...
How might one estimate disease spread? 1/...
Let& #39;s take a VERY simple model. This was used in the Red Dawn emails but its basically common sense with heroic assumptions.
SUPPOSE the disease follows a predictable course. A person is infected at Day 0. The disease incubates, gets worse (or not), the person lives or dies. 2/
SUPPOSE the disease follows a predictable course. A person is infected at Day 0. The disease incubates, gets worse (or not), the person lives or dies. 2/
IF they die, let& #39;s assume/estimate its at Day 21. If they live, assume detectable antibodies at Day 28.
And will they live? We need an Infection Fatality Rate, or IFR. We don& #39;t know that. Of course, lacking widespread testing we don& #39;t infections at Day 0 or antibodies at 28. 3/
And will they live? We need an Infection Fatality Rate, or IFR. We don& #39;t know that. Of course, lacking widespread testing we don& #39;t infections at Day 0 or antibodies at 28. 3/
Rather than catalog our ignorance (I have free time, but not THAT much), what DO we know? Well, deaths, sort of - reporting issues are well documented but it may be our best handhold.
So work backwards. If we know Deaths on 4/22, by assumption they were infected on 4/1. 4/
So work backwards. If we know Deaths on 4/22, by assumption they were infected on 4/1. 4/
Add another Heroic Assumption: Use an IFR of 0.5%. That& #39;s five times as deadly as the regular flu, so its a scary number. 1 out of 200 that are infected go on to die.
So if 100 people died on 4/21 they were infected on 4/1 along with 199 x 100 (19,900) who go on to live. 5/
So if 100 people died on 4/21 they were infected on 4/1 along with 199 x 100 (19,900) who go on to live. 5/
But don& #39;t test those 19,900 for antibodies yet! They won& #39;t test positive for that until 4/28. Weird, and an assumption researchers will be checking, obvi, when the real modelers crunch this sort of thing.
The gist: knowing deaths by day and total deaths, we can estimate dates 6/
The gist: knowing deaths by day and total deaths, we can estimate dates 6/
of infection and antibody presence. Put those deaths within a population and we can estimate population immunity.
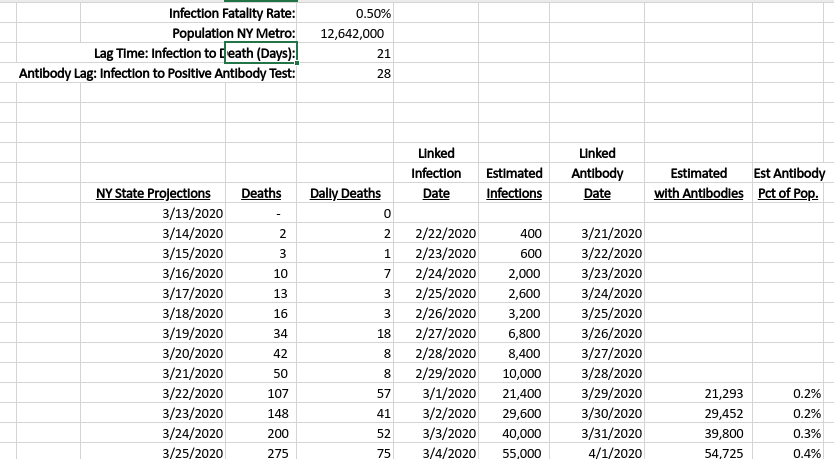
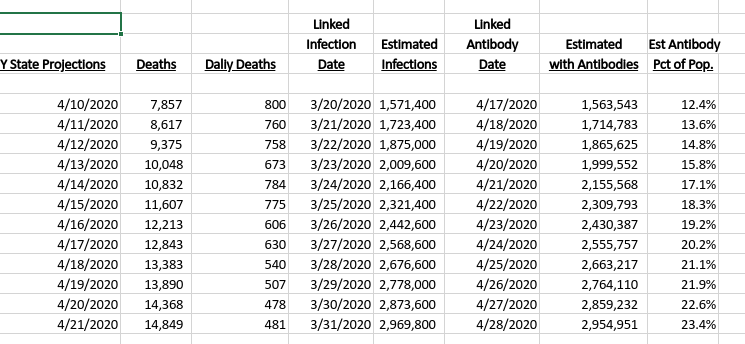
For example, I worked that out for the NY Metro area (NYC and the nearby counties), which account for 95% of the deaths in NY State. Lots of numbers, here goes: 7/
For example, I worked that out for the NY Metro area (NYC and the nearby counties), which account for 95% of the deaths in NY State. Lots of numbers, here goes: 7/
And the Too Many Numbers chart, which I& #39;ve snipped to save space and probably create confusion.
And what does it mean? From memory here, the controversial Stanford Santa Clara County study estimated an IFR of 0.25% and about 3% population with antibodies. People applauded the low IFR but I was worried about the low spread - it means COVID-19 has room to run in CA.
With an assumed IFR of 0.25% and bodies stacked like cordwood, NYC Metro would have about 34% showing antibodies today. Hard to believe Stockholm is at that level.
From the chart using 0.5%, antibodies on 4/21 are based on deaths on 4/14, so 17.1% in NY Metro should test pos.
From the chart using 0.5%, antibodies on 4/21 are based on deaths on 4/14, so 17.1% in NY Metro should test pos.

 Read on Twitter


