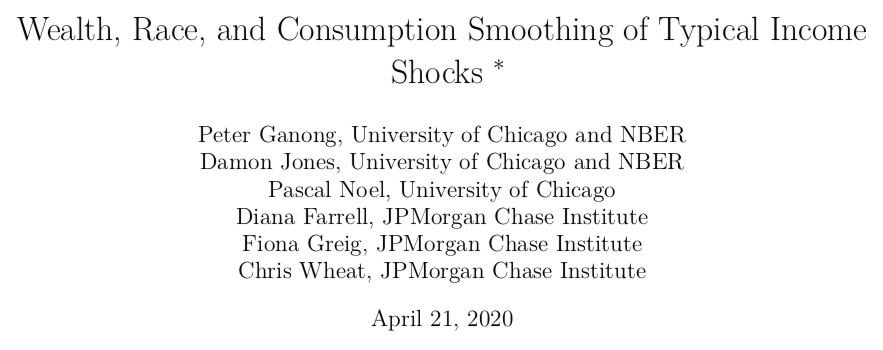
Wealth, Race, and Consumption Smoothing of Typical Income Shocks
Me + @ganong, @pascaljnoel, @Farrell_Diana, @FionaGreigDC, & Chris Wheat
paper: http://home.uchicago.edu/~j1s/RDFO_4_2020.pdf
\begin{thread}">https://home.uchicago.edu/~j1s/RDFO...
Motivation:
42% of people in the US report not having money set aside for an emergency*
How then, does month-to-month consumption vary when income unexpectedly changes?
*We will tie this to the current COVID-19 emergency at the end of this thread
42% of people in the US report not having money set aside for an emergency*
How then, does month-to-month consumption vary when income unexpectedly changes?
*We will tie this to the current COVID-19 emergency at the end of this thread
We ask 3 major questions:
1. How does consumption respond to typical changes in month-to-month income?
2. How does this vary by the amount of household liquid wealth?
3. How does this vary across racial groups?
1. How does consumption respond to typical changes in month-to-month income?
2. How does this vary by the amount of household liquid wealth?
3. How does this vary across racial groups?
To answer this question, we use a dataset on ~2 million households, combining:
1. de-identified panel data from administrative JPMC bank records w/ income & spending
2. public voter files w/ information on race
This is the first such dataset we know of at a monthly frequency
1. de-identified panel data from administrative JPMC bank records w/ income & spending
2. public voter files w/ information on race
This is the first such dataset we know of at a monthly frequency
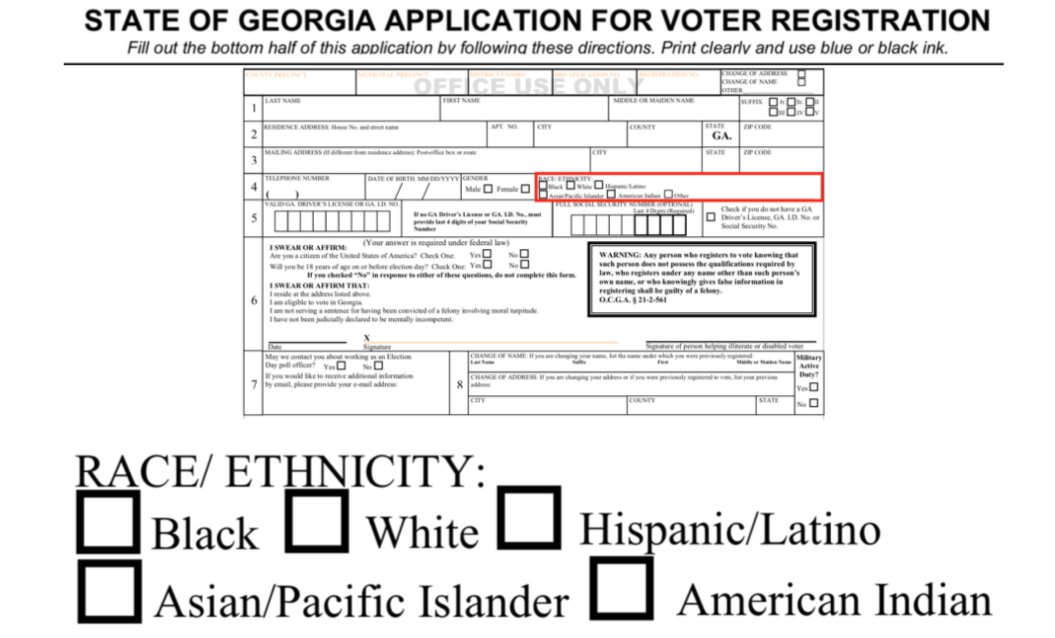
Voter registrations record race/ethnicity in 8 southern states, 3 of which also have a major JPMC presence: GA, FL, LA
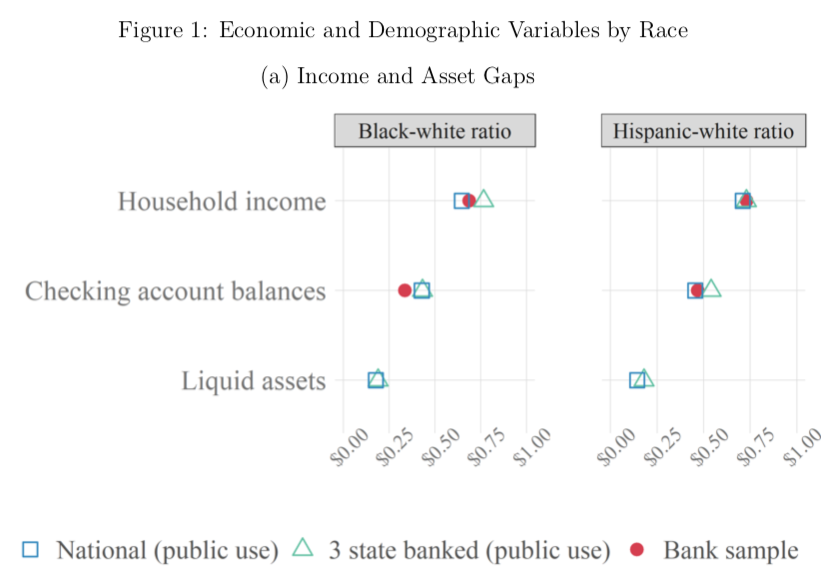
How representative is our sample?
We show black-white & Hispanic-white economic gaps in our sample are similar to those nationwide
How representative is our sample?
We show black-white & Hispanic-white economic gaps in our sample are similar to those nationwide
Income can change due to things outside of one& #39;s control (firm-level changes) or under one& #39;s control (individual-level)
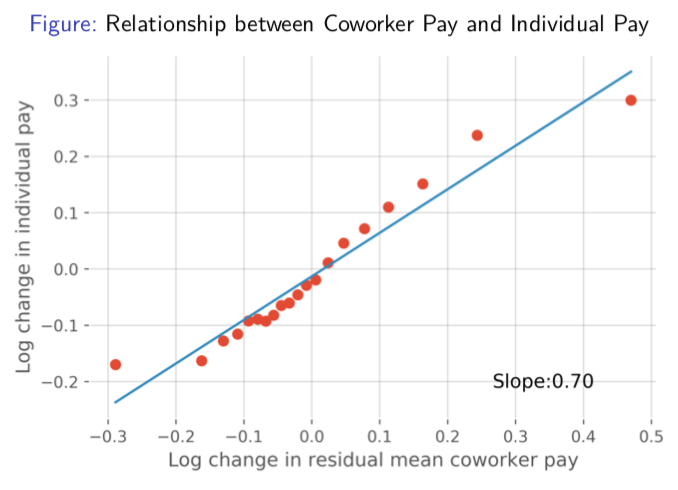
To capture firm-level changes, we take the average month-to-month change in income for one& #39;s co-workers
This proxy is highly correlated with one& #39;s own pay
To capture firm-level changes, we take the average month-to-month change in income for one& #39;s co-workers
This proxy is highly correlated with one& #39;s own pay
Our measure of income shocks has two key strengths:
1. Paycheck variation captures "typical" income changes (in contrast to unusual windfalls, like tax rebates)
2. We aim to isolate changes due to shocks to the firm (in contrast to worker-specific shocks)
1. Paycheck variation captures "typical" income changes (in contrast to unusual windfalls, like tax rebates)
2. We aim to isolate changes due to shocks to the firm (in contrast to worker-specific shocks)
Result 1:
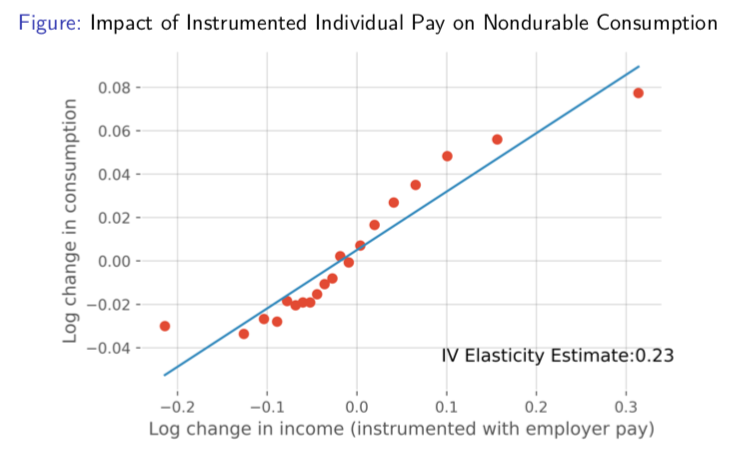
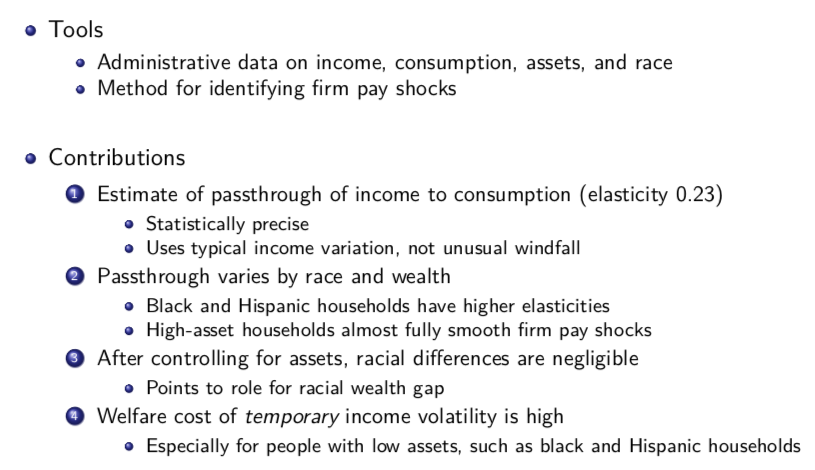
In the overall sample, a 10% change in monthly pay results in a 2.3% change in spending
(Elasticity = 0.23)
The estimates are precise
(standard error = 0.01)
In the overall sample, a 10% change in monthly pay results in a 2.3% change in spending
(Elasticity = 0.23)
The estimates are precise
(standard error = 0.01)
Result 2:
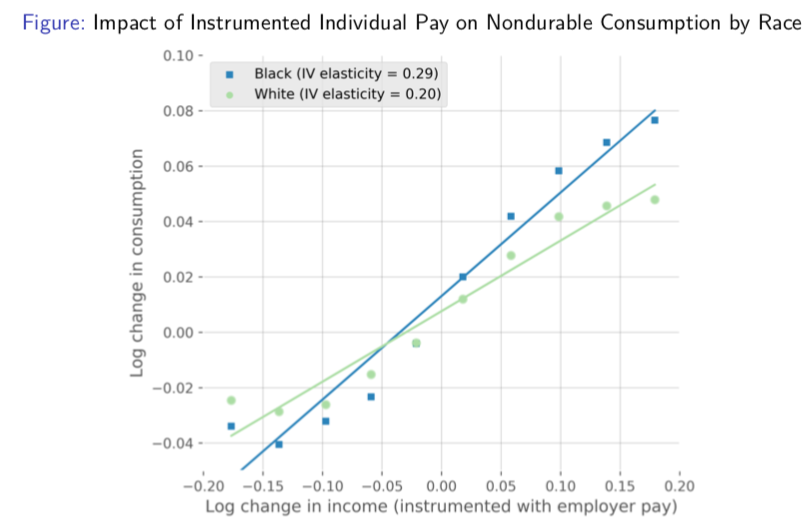
black household consumption is 50% more sensitive to income shocks, relative to white households
black elasticity: 0.29
white elasticity: 0.20
black household consumption is 50% more sensitive to income shocks, relative to white households
black elasticity: 0.29
white elasticity: 0.20
Result 2 (cont):
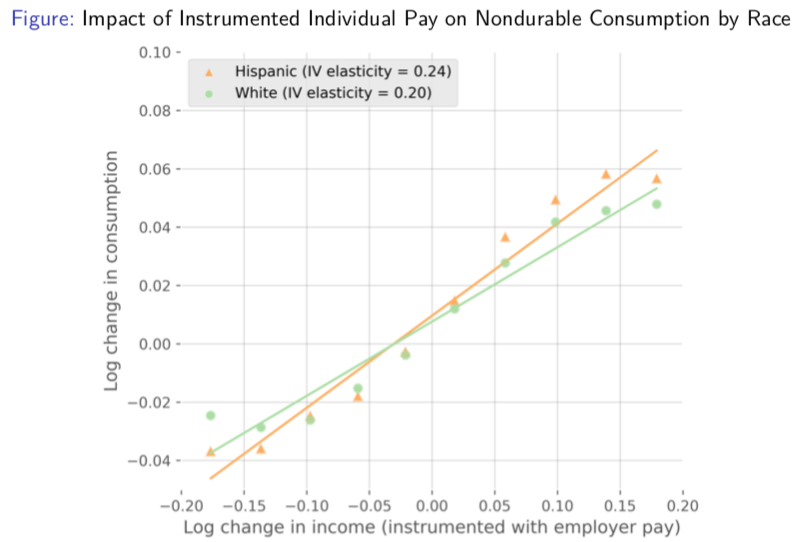
Hispanic household consumption is 50% more sensitive to income shocks, relative to white households
Hispanic elasticity: 0.24
white elasticity: 0.20
Hispanic household consumption is 50% more sensitive to income shocks, relative to white households
Hispanic elasticity: 0.24
white elasticity: 0.20
Result 3:
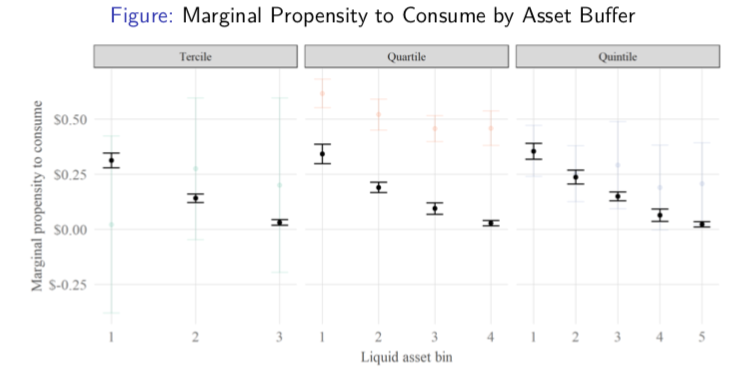
Whether one has liquid assets matters a lot for consumption sensitivity. High asset households have nearly zero sensitivity. Low asset households are significantly sensitive.
(here we plot marginal propensity to consume to compare to prior literature)
Whether one has liquid assets matters a lot for consumption sensitivity. High asset households have nearly zero sensitivity. Low asset households are significantly sensitive.
(here we plot marginal propensity to consume to compare to prior literature)
Result 4:
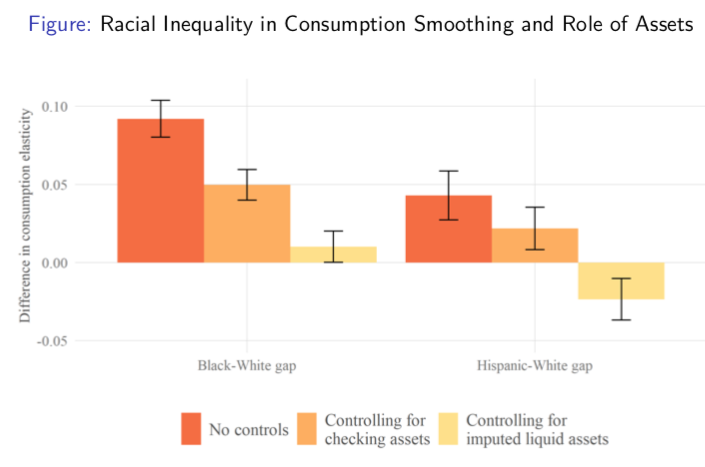
Combining the two previous results, when we compare households of similar asset levels, the differences between racial groups go away completely (or reverse)
Combining the two previous results, when we compare households of similar asset levels, the differences between racial groups go away completely (or reverse)
Result 4 (cont.):
Note: we don& #39;t interpret this to mean that our results are about "wealth and not race" ...
Rather, differences in consumption smoothing between racial groups are mediated by racial wealth gaps, which themselves are due to historical factors related to race
Note: we don& #39;t interpret this to mean that our results are about "wealth and not race" ...
Rather, differences in consumption smoothing between racial groups are mediated by racial wealth gaps, which themselves are due to historical factors related to race
Result 5:
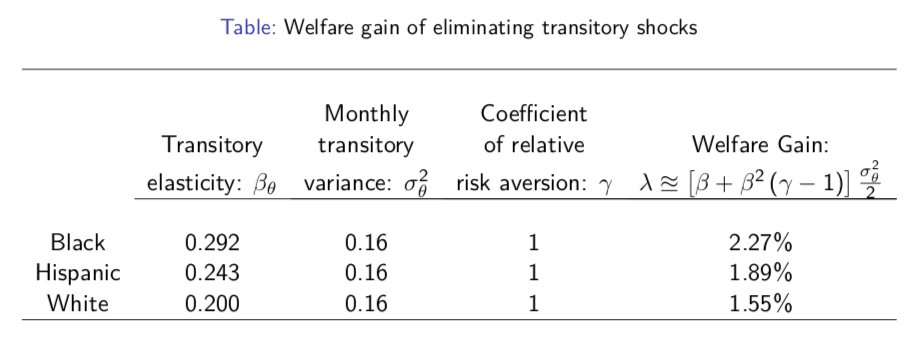
We derive an expression for the cost of consumption volatility. Eliminating monthly pay fluctuation is equivalent to raising lifetime consumption by "lambda"
This depends on the consumption elasticity "beta"
black & Hispanic gains are 50% & 20% larger than white ones
We derive an expression for the cost of consumption volatility. Eliminating monthly pay fluctuation is equivalent to raising lifetime consumption by "lambda"
This depends on the consumption elasticity "beta"
black & Hispanic gains are 50% & 20% larger than white ones
There are many studies of consumption sensitivity. What do we add?
1. Precision: the standard error of our MPC = 1¢
2. Comparison across racial groups
3. Many use unusual windfalls as natural experiments. We show households also respond to "typical" sources of income variation
1. Precision: the standard error of our MPC = 1¢
2. Comparison across racial groups
3. Many use unusual windfalls as natural experiments. We show households also respond to "typical" sources of income variation
In addition to this academic paper, we have written a JPMorgan Chase Institute report on racial gaps in financial outcomes, which includes additional results, e.g. the consumption response to tax refunds by race, and discusses policy implications https://institute.jpmorganchase.com/institute/research/household-income-spending/report-racial-gaps-in-financial-outcomes">https://institute.jpmorganchase.com/institute...
Our results also relate to the current COVID-19 pandemic: we have seen that black and Hispanic households have experienced disproportionately negative *health* impacts
Our findings suggest they may also experience disproportionately negative *economic* impacts
Our findings suggest they may also experience disproportionately negative *economic* impacts
First, many households who are still working are experiencing pay cuts or reductions in hours or reductions in self-employment income
Our results above show that black and Hispanic households will likely experience deeper cuts in consumption, as compared to white counterparts
Our results above show that black and Hispanic households will likely experience deeper cuts in consumption, as compared to white counterparts
But what about unemployment? The COVID-19 pandemic has brought about historic rates of transition into unemployment
In our paper, we also study consumption drops during unemployment spells. JPMC bank data allow us to identify when a household first receives a UI direct deposit
In our paper, we also study consumption drops during unemployment spells. JPMC bank data allow us to identify when a household first receives a UI direct deposit
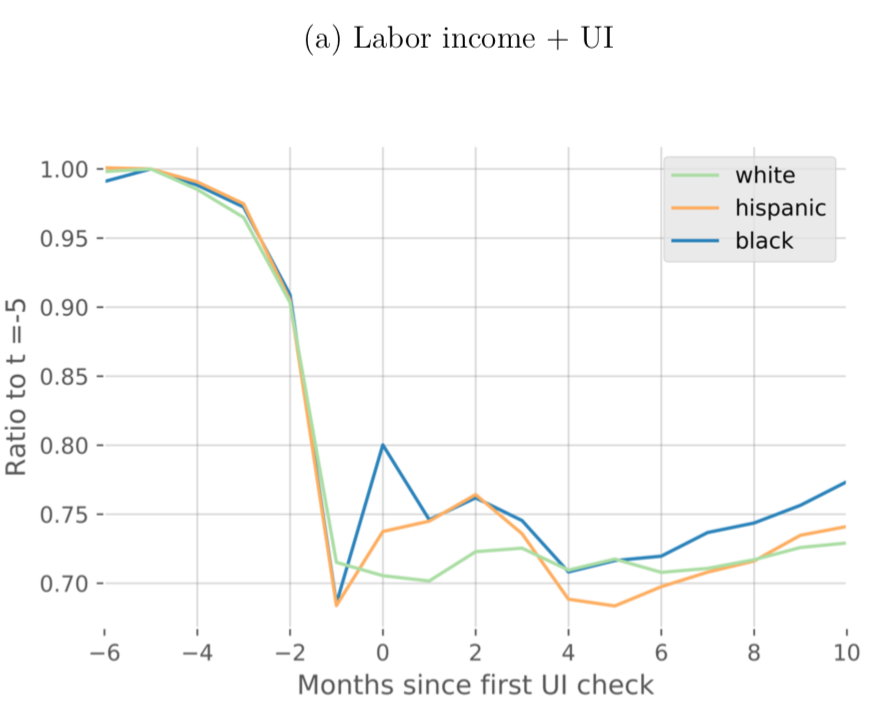
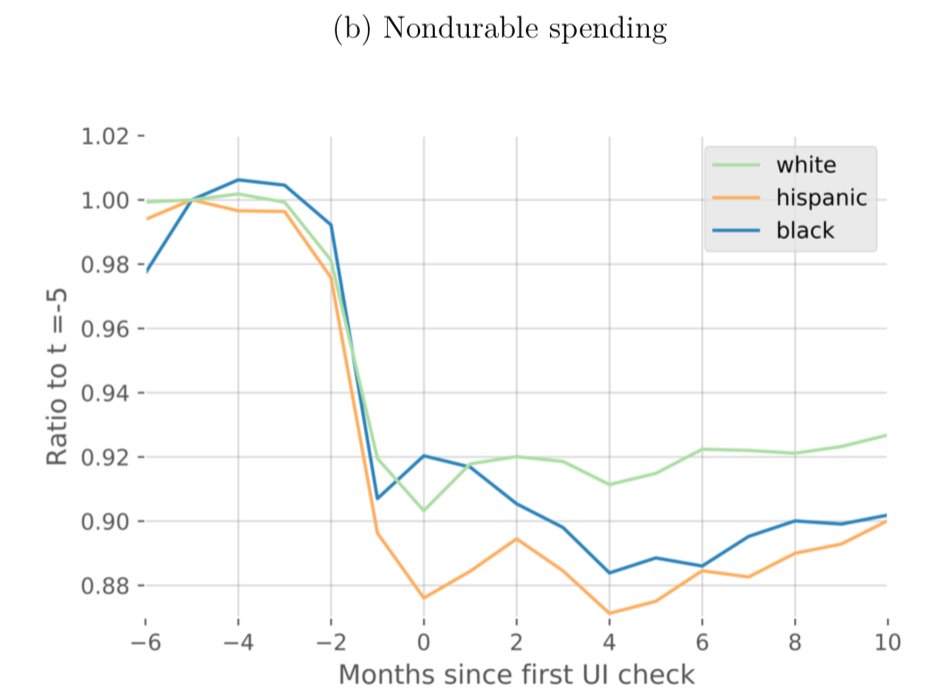
We track net income (labor income + UI) & consumption following the first UI direct deposit:
1. white, black, & Hispanic households experience similar net income drops after their first UI check
2. black & Hispanic households, however, experience steeper declines in consumption
1. white, black, & Hispanic households experience similar net income drops after their first UI check
2. black & Hispanic households, however, experience steeper declines in consumption
I put the wrong handle for my co-author Peter Ganong:
@p_ganong
 https://abs.twimg.com/emoji/v2/... draggable="false" alt="🤦🏾♂️" title="Man facepalming (medium dark skin tone)" aria-label="Emoji: Man facepalming (medium dark skin tone)">
@p_ganong

 Read on Twitter
 New Working Paperhttps://abs.twimg.com/emoji/v2/... draggable="false" alt="🚨" title="Police cars revolving light" aria-label="Emoji: Police cars revolving light">Wealth, Race, and Consumption Smoothing of Typical Income ShocksMe + @ganong, @pascaljnoel, @Farrell_Diana, @FionaGreigDC, & Chris Wheatpaper: https://home.uchicago.edu/~j1s/RDFO..." title="https://abs.twimg.com/emoji/v2/... draggable="false" alt="🚨" title="Police cars revolving light" aria-label="Emoji: Police cars revolving light">New Working Paperhttps://abs.twimg.com/emoji/v2/... draggable="false" alt="🚨" title="Police cars revolving light" aria-label="Emoji: Police cars revolving light">Wealth, Race, and Consumption Smoothing of Typical Income ShocksMe + @ganong, @pascaljnoel, @Farrell_Diana, @FionaGreigDC, & Chris Wheatpaper: https://home.uchicago.edu/~j1s/RDFO...">
 New Working Paperhttps://abs.twimg.com/emoji/v2/... draggable="false" alt="🚨" title="Police cars revolving light" aria-label="Emoji: Police cars revolving light">Wealth, Race, and Consumption Smoothing of Typical Income ShocksMe + @ganong, @pascaljnoel, @Farrell_Diana, @FionaGreigDC, & Chris Wheatpaper: https://home.uchicago.edu/~j1s/RDFO..." title="https://abs.twimg.com/emoji/v2/... draggable="false" alt="🚨" title="Police cars revolving light" aria-label="Emoji: Police cars revolving light">New Working Paperhttps://abs.twimg.com/emoji/v2/... draggable="false" alt="🚨" title="Police cars revolving light" aria-label="Emoji: Police cars revolving light">Wealth, Race, and Consumption Smoothing of Typical Income ShocksMe + @ganong, @pascaljnoel, @Farrell_Diana, @FionaGreigDC, & Chris Wheatpaper: https://home.uchicago.edu/~j1s/RDFO...">
 New Working Paperhttps://abs.twimg.com/emoji/v2/... draggable="false" alt="🚨" title="Police cars revolving light" aria-label="Emoji: Police cars revolving light">Wealth, Race, and Consumption Smoothing of Typical Income ShocksMe + @ganong, @pascaljnoel, @Farrell_Diana, @FionaGreigDC, & Chris Wheatpaper: https://home.uchicago.edu/~j1s/RDFO..." title="https://abs.twimg.com/emoji/v2/... draggable="false" alt="🚨" title="Police cars revolving light" aria-label="Emoji: Police cars revolving light">New Working Paperhttps://abs.twimg.com/emoji/v2/... draggable="false" alt="🚨" title="Police cars revolving light" aria-label="Emoji: Police cars revolving light">Wealth, Race, and Consumption Smoothing of Typical Income ShocksMe + @ganong, @pascaljnoel, @Farrell_Diana, @FionaGreigDC, & Chris Wheatpaper: https://home.uchicago.edu/~j1s/RDFO...">
