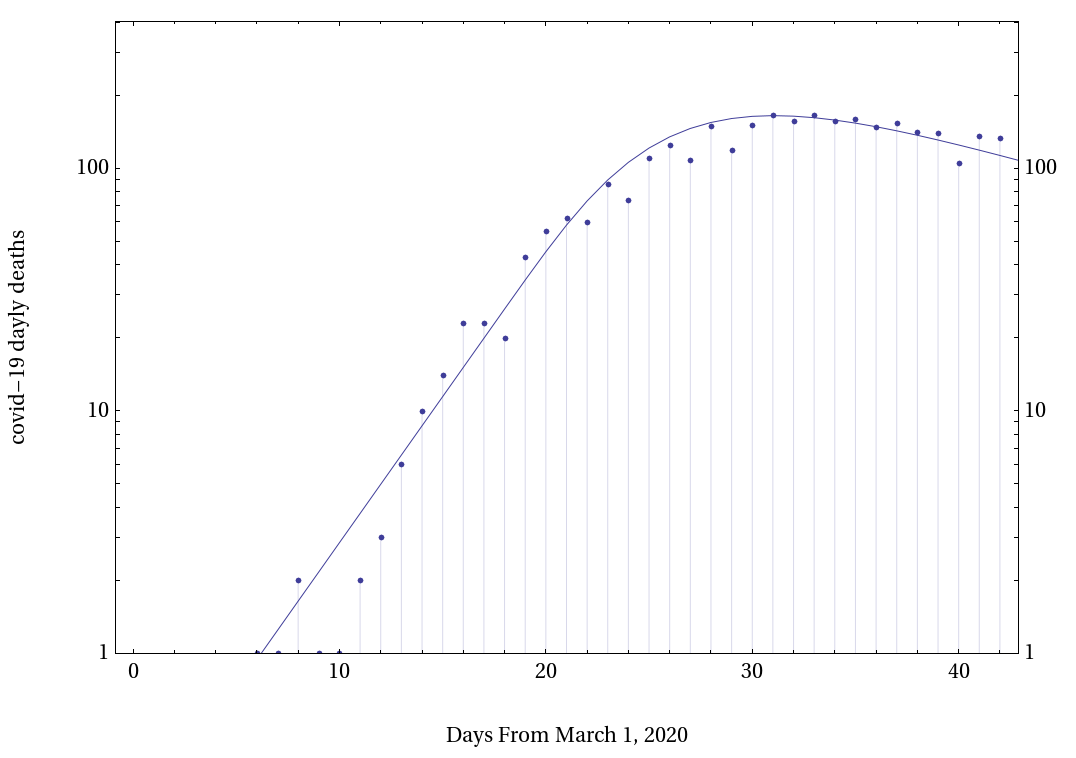
Why did this happen? The main reason is the strongly asymmetric infections peak. While the maximum occurs on March 23, all of its weight lies to the left of the maximum. In convolution with the broad&smooth function P(t) the maximum shifts to the left of the naive prediction 18/n
Does that mean that the empirical data confirm our prediction for the position of the peak?
The answer is no.
19/n
The answer is no.
19/n
Near the maximum death rates plateaus so the position of the maximum is completely defined by random noise. The peak could have occurred anywhere between Apr4-11.
Notwithstanding, our prediction is consistent with the data, which falsifies the contention of the "dissidents"
20/n
Notwithstanding, our prediction is consistent with the data, which falsifies the contention of the "dissidents"
20/n
We have thus shown that the central premise of the
covid-19 dissidents& #39;s argument is a fallacy resulting from
a mathematically incorrect association of the mean of a distribution function with its maximum and disregard for the noise. Does it make their theory wrong?
21/n
covid-19 dissidents& #39;s argument is a fallacy resulting from
a mathematically incorrect association of the mean of a distribution function with its maximum and disregard for the noise. Does it make their theory wrong?
21/n
Not necessarily. We have only shown that the observed deaths curve is consistent with the mainstream view. We need to look for further evidence to confirm/falsify the dissident& #39;s theory. Such research is beyond the scope of this thread, however, a couple of points are due
22/n
22/n
Firstly, the "dissident" theory is only consistent with herd immunity+observed total deaths if the infection fatality rate of covid-19 is less than 0.1% and the total cases are greater than 50%. Such a scenario was investigated (among others) in this paper
23/n
23/n
As I show in this thread, assuming the main premises of the Gupta et al model, one can benchmark it against the NHS infections/tests ratio. This analysis comfortably rules out the conditioins required by the "dissident" theory.
https://twitter.com/cheianov/status/1242960650634231808?s=20
24/n">https://twitter.com/cheianov/...
https://twitter.com/cheianov/status/1242960650634231808?s=20
24/n">https://twitter.com/cheianov/...
Furthermore, it is instructive to compare the UK
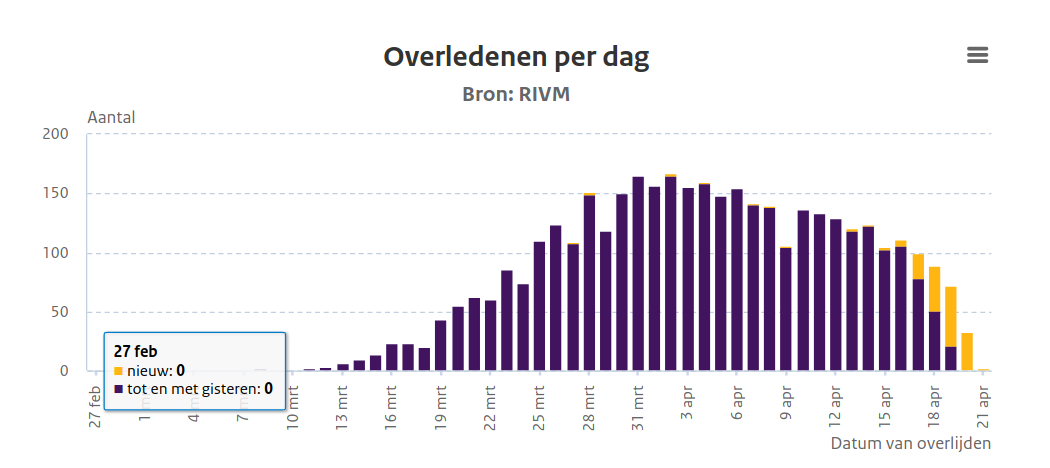
with other countries. Here I consider the example of NL. In NL the lockdown became effective on March 14. As can be seen from the chart below, the deaths peaked in the noise-dominated region between Mar 30-Apr 4.
25/n
with other countries. Here I consider the example of NL. In NL the lockdown became effective on March 14. As can be seen from the chart below, the deaths peaked in the noise-dominated region between Mar 30-Apr 4.
25/n
The NL peak is shifted towards longer times, which
can be easily explained by the differences in the values of R0 between/after lockdown (the position of the maximum is sensitive to those). But the overall pattern is very similar to the UK.
26/n
can be easily explained by the differences in the values of R0 between/after lockdown (the position of the maximum is sensitive to those). But the overall pattern is very similar to the UK.
26/n
To illustrate this point I fit the NL data using the same
model, however with a different choice of the doubling time T2=2.5 days. Note, that the doubling time is a purely empirical characteristic following uniquely from the gradient of the curve preceding the peak.
model, however with a different choice of the doubling time T2=2.5 days. Note, that the doubling time is a purely empirical characteristic following uniquely from the gradient of the curve preceding the peak.
We can see that a small variation in the time
from lockdown to the peak is naturally explained by a variation in epidemiological parameters across the countries.
However, it would be a very remarkable coincidence indeed
28/n
from lockdown to the peak is naturally explained by a variation in epidemiological parameters across the countries.
However, it would be a very remarkable coincidence indeed
28/n
if two countries with different populations&population,
which triggered the lockdown at completely different points of the epidemic curve happened to do it within almost the same distance of the natural infections peak, as the "dissident" theor would imply
29/n
which triggered the lockdown at completely different points of the epidemic curve happened to do it within almost the same distance of the natural infections peak, as the "dissident" theor would imply
29/n
To conclude, the "dissident" theory suggesting that the quarantine was introduced in the UK after the natural peak of infections is based on invalid evidence. In contrast, SIR models operating within the widely accepted regime of high mortality/no herd immunity
demonstrate
30/n
demonstrate
30/n
excellent agreement with the empirical data in both
UK and NL. Considering the highly consequential nature of the errors in the epidemiological modelling, I invite the "dissidents" to defend their arguments in an open debate here or elsewhere. // Ends
UK and NL. Considering the highly consequential nature of the errors in the epidemiological modelling, I invite the "dissidents" to defend their arguments in an open debate here or elsewhere. // Ends

 Read on Twitter


