In the following tweets I will share my experiences and also discuss two examples of "polarity" principles with some text-book chart patterns that were very helpful. Treat it as a case study.
Some good lessons here for me. I will highlight each lesson I learned.
Some good lessons here for me. I will highlight each lesson I learned.
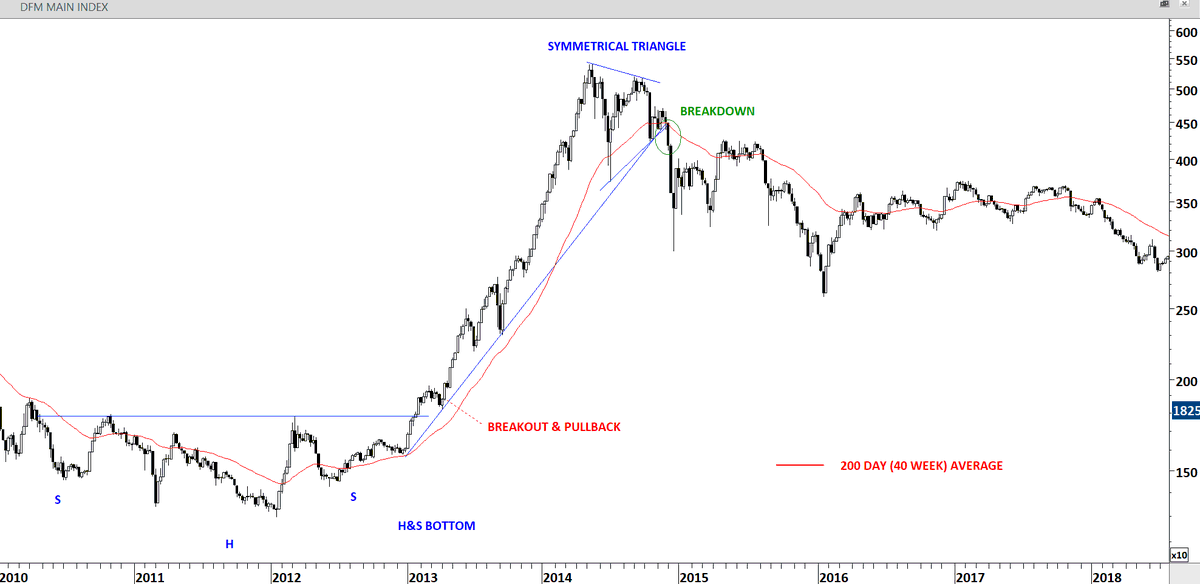
1) After a very dull 3 years of base formation, UAE markets started forming a recognizable pattern. A possible H&S bottom at the back of expectation to be upgraded by MSCI to #emergingmarkets status.
2) Long consolidations and low volumes result in loss of interest by many market participants. It is usually after those dull periods the strong trends emerge. Lesson: always stay alert. Keep repeating your daily/weekly routine of analysis. Money never sleeps.
3) The breakout from the multi-year H&S bottom took place in the beginning of 2013, resulting in a strong uptrend, with the expectation of an upgrade and "so called" passive money flows to UAE and QATAR.
4) Index providers can change the status of a market and they say this in advance and allow passive and active fund managers to make required "re balancing". Those re balancing sometimes can add up to 20-25% of the funds. Anyhow it results in fund in/outflows.
5) Markets in those type of situations operate with the buy the rumor sell the news principle Even though it is believed to have long-term fundamental changes, an upgrade or downgrade is nothing other than a buy the rumor sell the news play Lesson: market dynamics remain the same
6) Following the breakout, previous resistance acted as support as index pulled back to the H&S bottom neckline.
Lesson: Polarity principle. Previous support becomes the new resistance and vice versa.
Lesson: Polarity principle. Previous support becomes the new resistance and vice versa.
7) Following the strong uptrend the index formed a symmetrical triangle. Given that there was all the fundamental reasons for the market to move higher, the bias was the symmetrical triangle to act as continuation chart pattern. Lesson: symmetrical triangle is a neutral chart pat
8) Symmetrical triangle is a neutral chart pattern and we should have an open mind to asses which direction the breakout will take place. With the breakdown, the 200-day moving average was breached. Lesson: Use 200-day average as a trend filter. Breakdowns should take place below
9) As the market was unfolding to reverse the 2013-2014 uptrend with funds allocating more and more money to UAE and QATAR due to MSCI upgrade, I was asked to find proper hedges if the markets were to correct. Lesson: correlation is a slippery statistical tool (continued)
10) Unless you have a liquid ETF that mimics the index/benchmark, it is very difficult to find a really good hedge. In frontier/emerging markets it was not possible at the time. Your best option was to ask the investment banks to lend you shares to sell (another way of shorting).
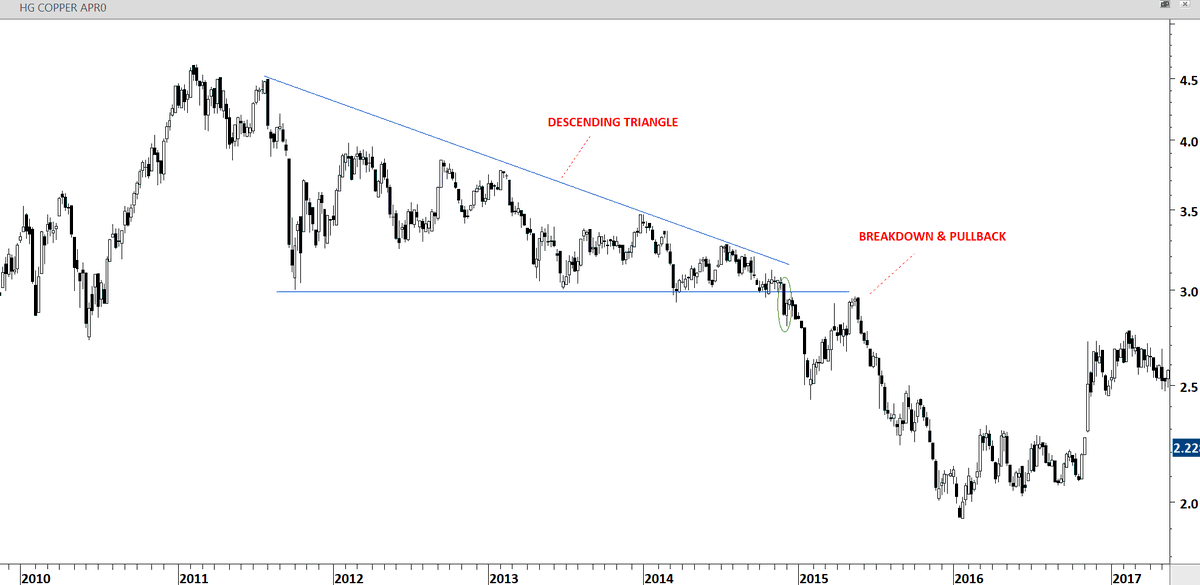
11) Strong $USD weak #emergingmarkets and weak #commodities was the theme so I spotted this #descendingtriangle on #copper. With decent correlation to #emergingmarkets #equities $EEM.
Other than shorting $EEM we shorted #copper
Other than shorting $EEM we shorted #copper
12) While in the beginning of 2015, I looked really good in front of the Investment Committee. I spent the first quarter of 2015 by being grilled and questioned on how effective of a hedge #copper was. Lesson: Be patient as price pulls back to the chart pattern boundary.
13) Lesson: work with a team who understands and appreciates the value of technical analysis. Very important. I hope you enjoyed this #thread.

 Read on Twitter


