Defence:
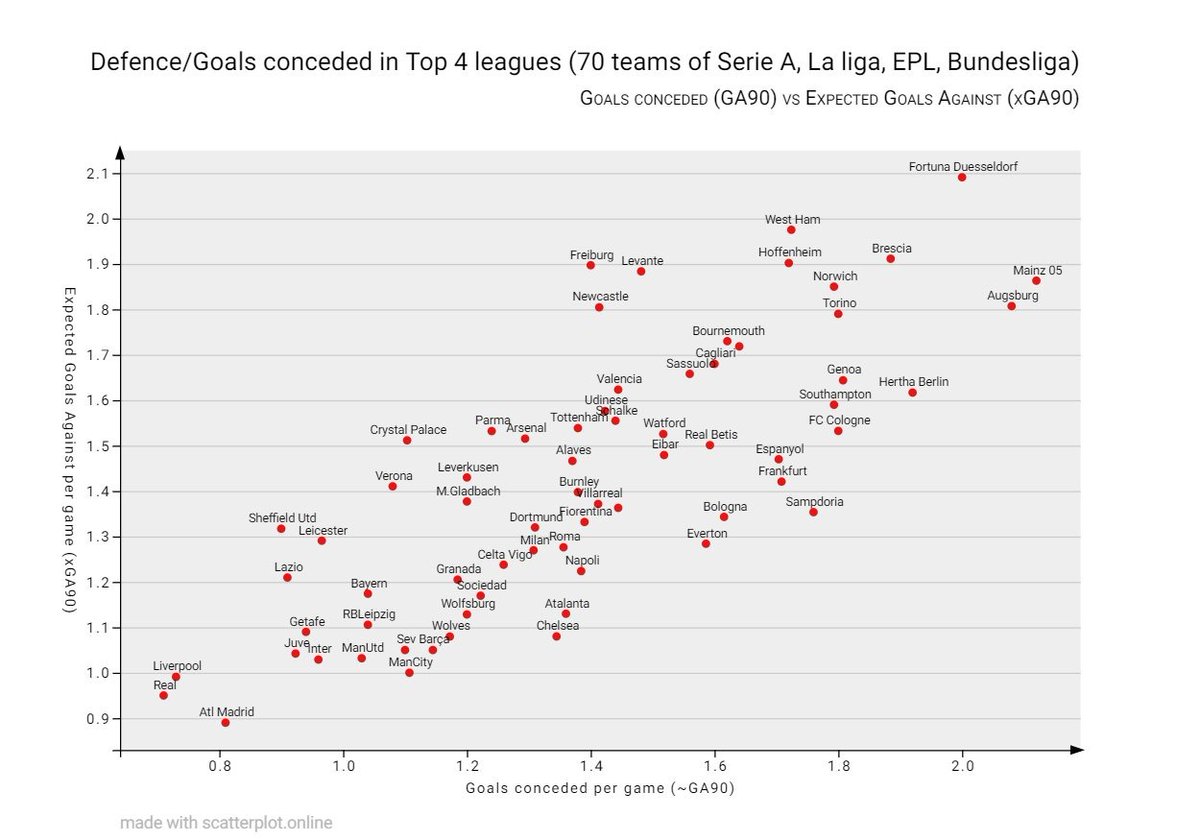
Plot showing 70 teams across Top 4 leagues - number of Goals conceded (actual) in their respective leagues vs Goals against (expected).
RTs and feedback appreciated. Feel free to use the scatter plots.
Plot showing 70 teams across Top 4 leagues - number of Goals conceded (actual) in their respective leagues vs Goals against (expected).
RTs and feedback appreciated. Feel free to use the scatter plots.
In the above plot, teams that are at the bottom left corner (Liverpool, Atletico Madrid and Real) have conceded almost the same number of goals as their xGA per game. They don& #39;t show a wide discrepancy which highlights those 3 are sustainable efficient defensive unit.
Teams who have conceded lower goals per game, but have a high Expected Goals Against (xGA) throughout this season like
• Crystal Palace
• Sheffield United
• Parma
• Verona
are less likely to sustain their form of good defence for longer periods (more than a season).
• Crystal Palace
• Sheffield United
• Parma
• Verona
are less likely to sustain their form of good defence for longer periods (more than a season).
There are some teams who have low expected GA but in realtime have conceded more goals.
• Chelsea
• Atalanta
• Sampdoria
These teams may have conceded goals from low quality chances, individual errors, forced errors etc.
• Chelsea
• Atalanta
• Sampdoria
These teams may have conceded goals from low quality chances, individual errors, forced errors etc.
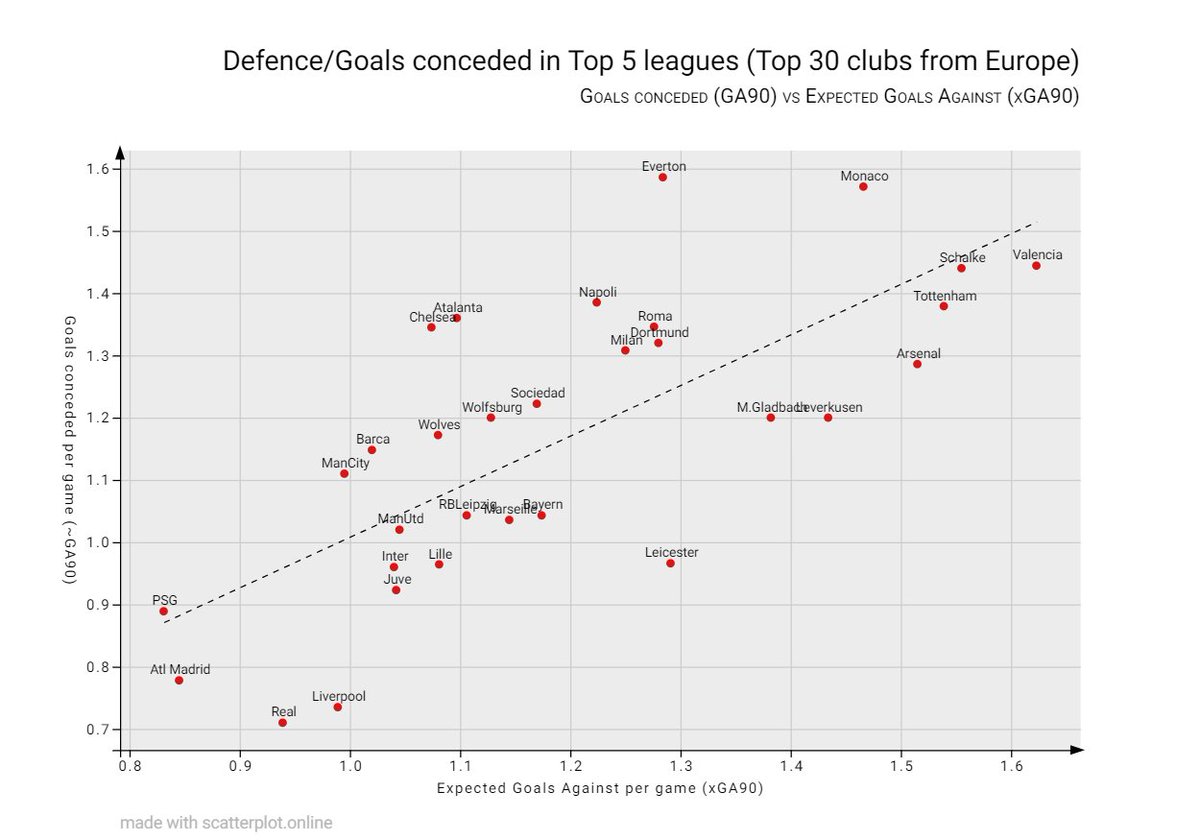
Here& #39;s another plot showing 30 clubs from Europe& #39;s top 5 leagues where the axis have been swapped (expected GA90 in horizontal axis while Goals conceded in realtime in vertical axis)
(This includes top Ligue 1 teams too)
(This includes top Ligue 1 teams too)
Atletico and PSG& #39;s defence performing exceptionally well. They are expected to concede close to 0.8 goals per game and they stick to conceding low number of goals in actual matches.

 Read on Twitter


