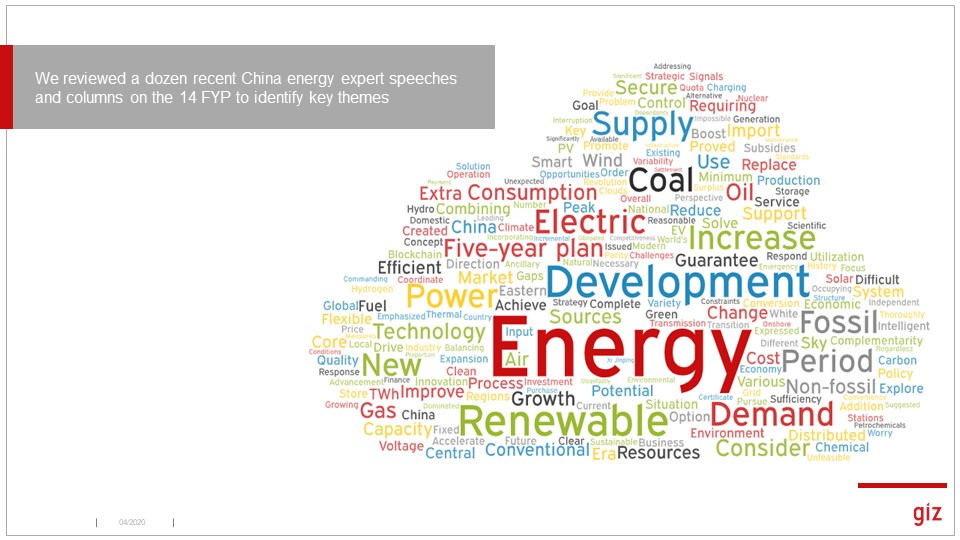
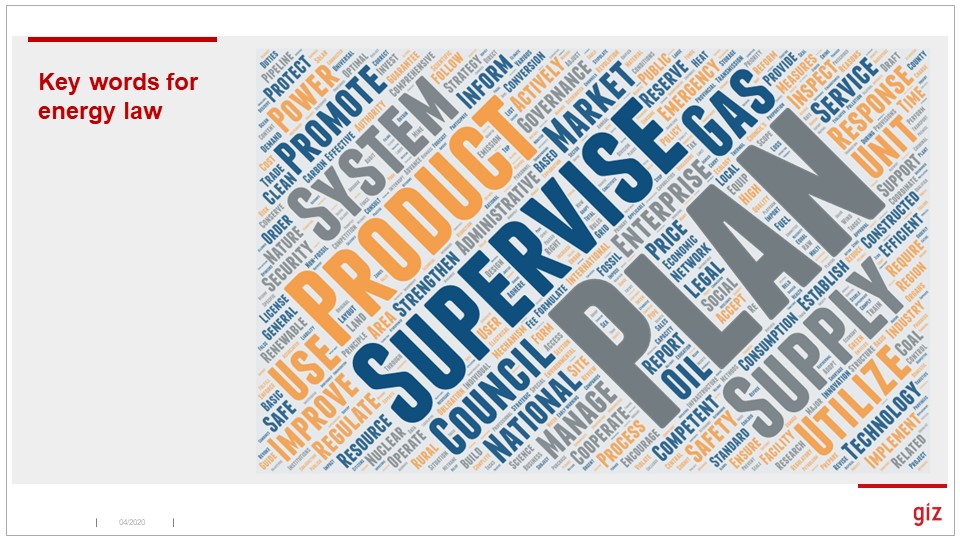
If you can tear your eyes off oil prices and covid for a sec, I have some China energy charts for you! Here& #39;s a word cloud about what key experts are saying about the 14th Five-Year Plan:
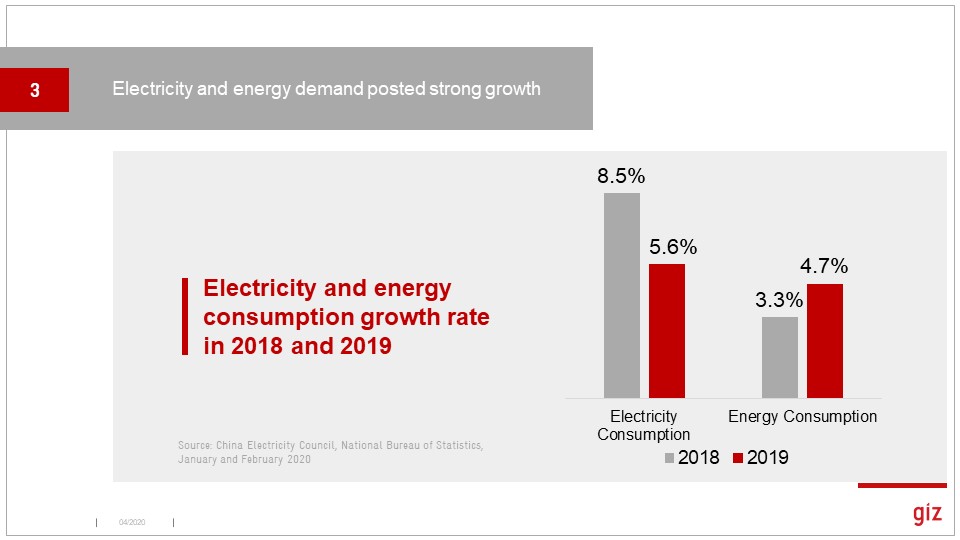
And China consumed a lot more energy, though electricity growth slowed a tad. (Watch for these numbers to fall a lot in 2020!)
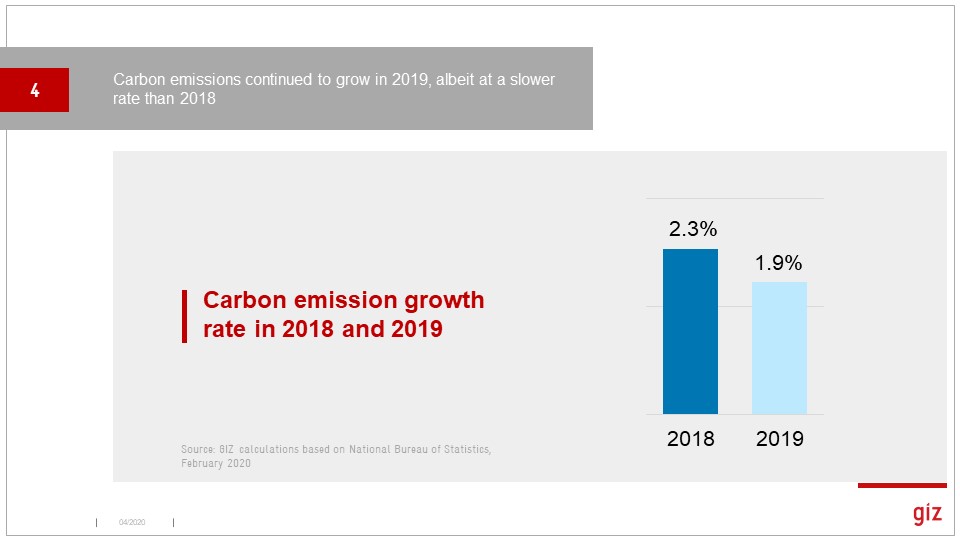
A bit hard to find CO2 emissions numbers given China& #39;s focus on carbon intensity. A calc based on NBS numbers yielded 1.9% growth, while Rhodium pegged it higher.
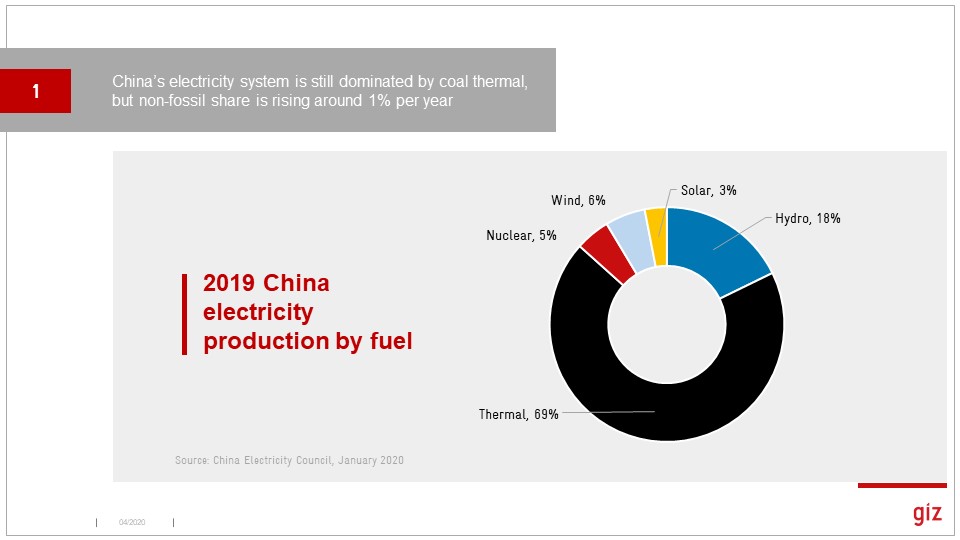
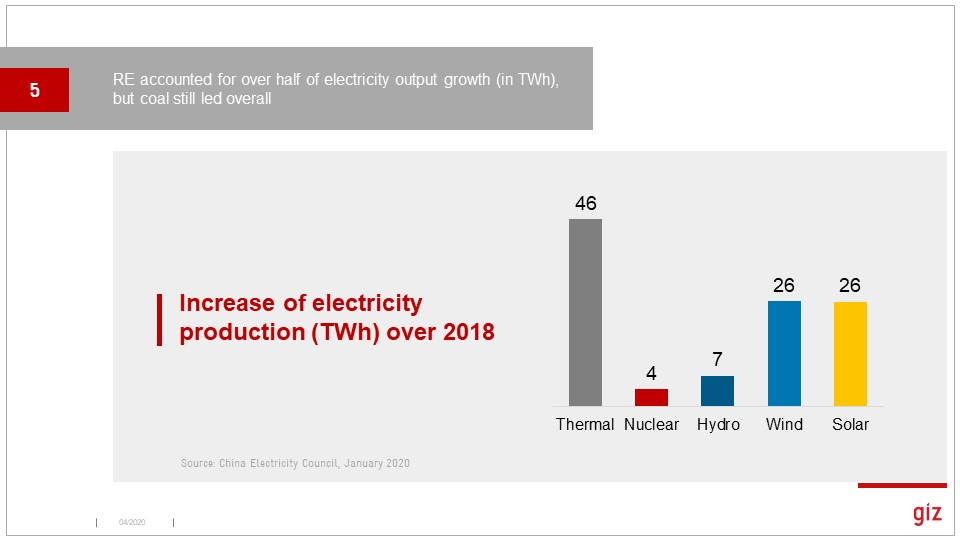
In terms of increased electricity production, low-carbon sources dominated, but coal output still grew more in total. Solar output surged in % terms.
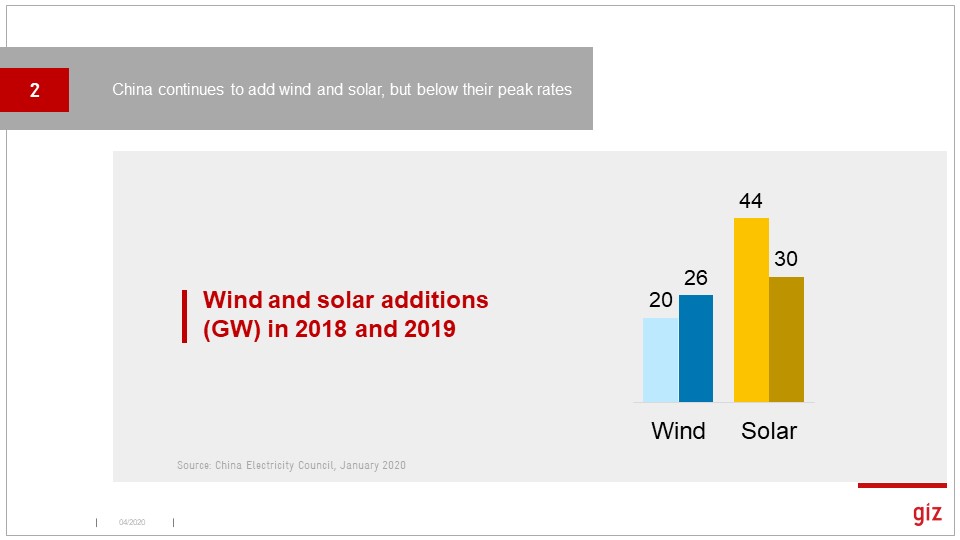
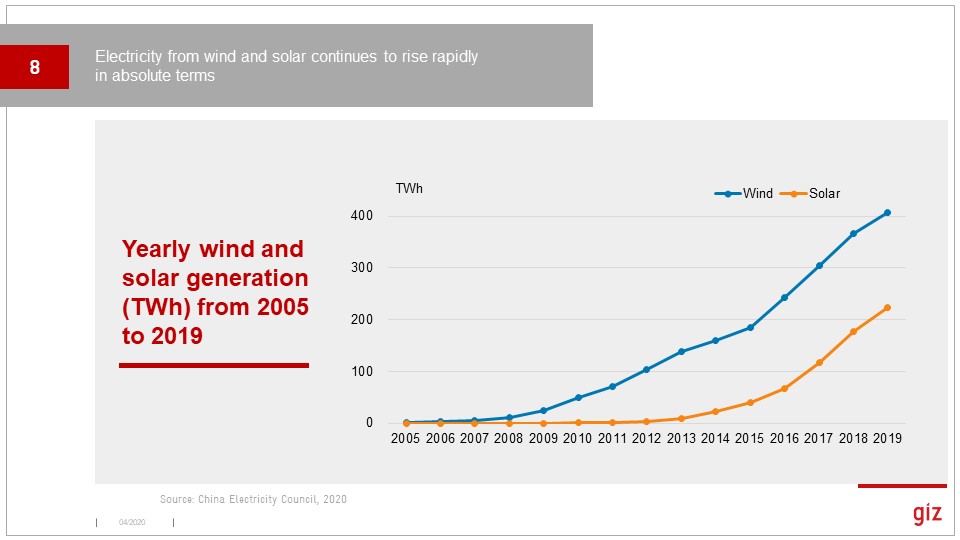
Coming back to the positive, wind and solar output over the longer term shows a very positive trend, but now growing more linearly. Big change from when I came to China in 2010!
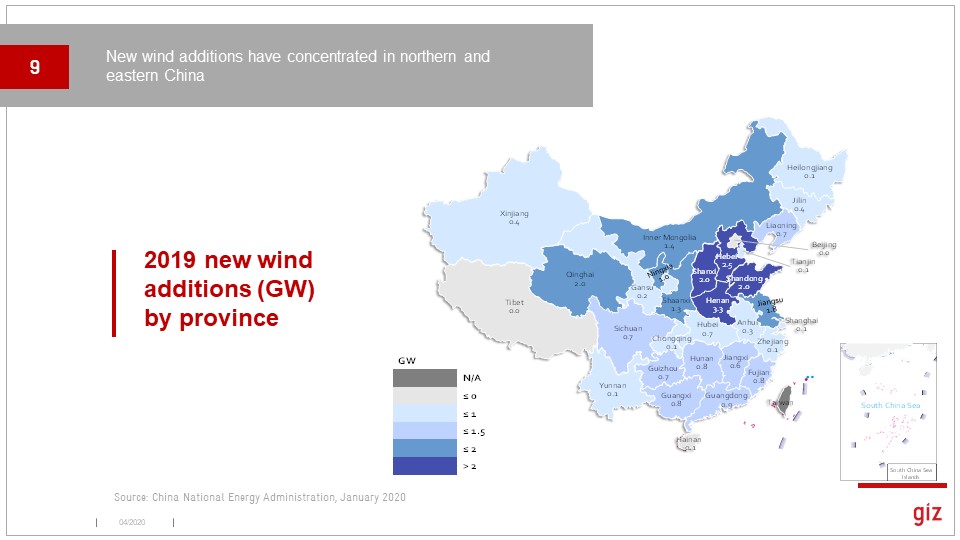
New wind has really shifted to cluster in the provinces right around Beijing. Growth in the early wind provinces has been limited by transmission constraints.
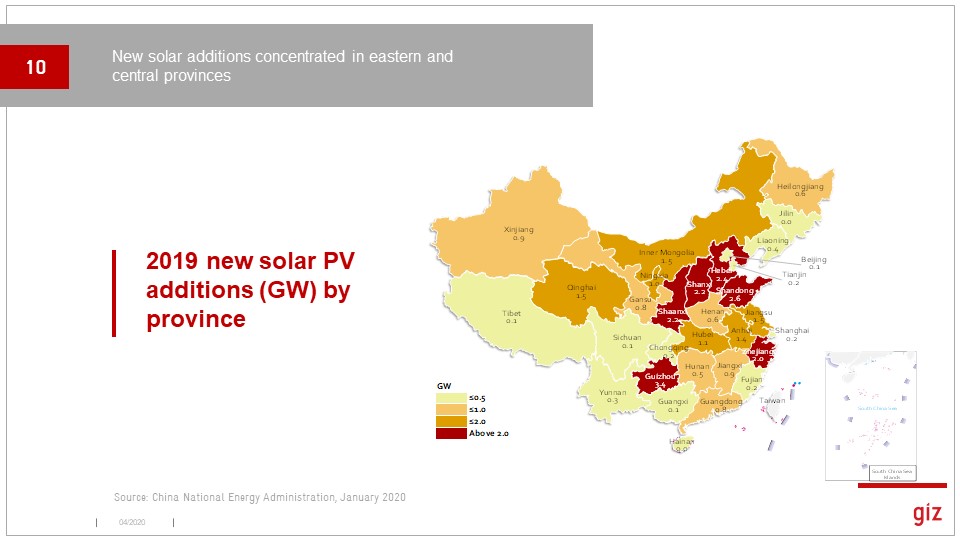
Same for solar PV. Solar has really diversified and a lot of provinces are in the GW club, including Guizhou. Some coastal provinces with good sun may be slowing though?
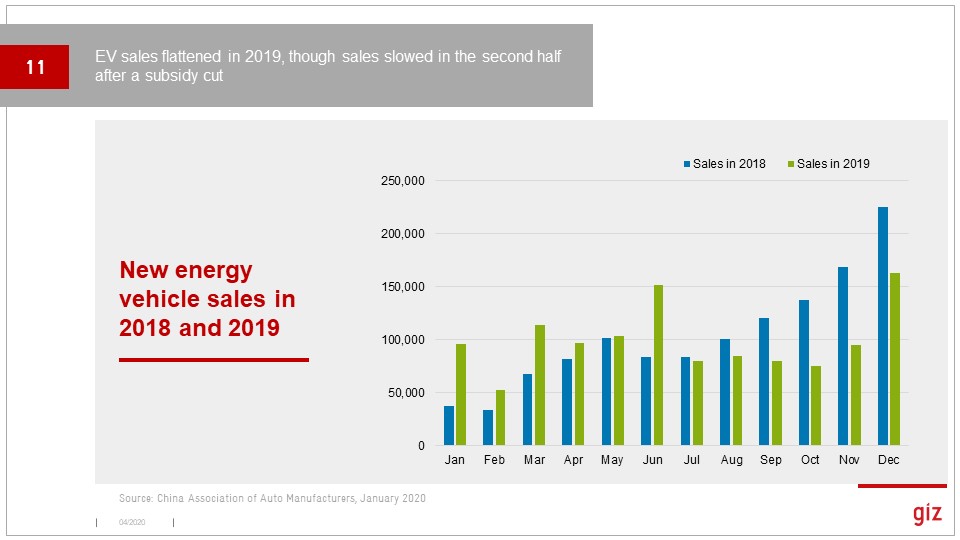
China still leads the world in new EVs sold. Things slowed way down after the subsidy cut mid-2019, sped up in December, then crashed again. Now recovering.
The new Energy Law draft is out, so of course we looked at the word frequency. I was surprised how small some key words were, like "market," "clean," or climate." But it& #39;s a policy, so emphasis on planning makes sense I guess.

 Read on Twitter
![[end] Renewables got about 30% of mentions in the law, coal and oil less than 25%. Lots of good material around distributed energy, and rural renewables, energy storage. [end] Renewables got about 30% of mentions in the law, coal and oil less than 25%. Lots of good material around distributed energy, and rural renewables, energy storage.](https://pbs.twimg.com/media/EWIKzMvUEAI6p3F.jpg)


