If you haven& #39;t used @qiskit& #39;s qsphere, it& #39;s a powerful way of visualizing quantum states. Here is the qsphere showing how Grover& #39;s algorithm works. With each round of the oracle and diffusion operators, you see that the marked state grows in amplitude
THREAD #QuantumComputing
THREAD #QuantumComputing
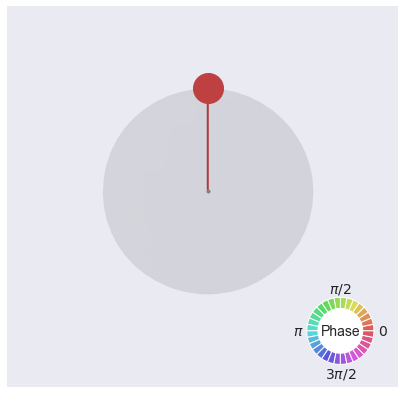
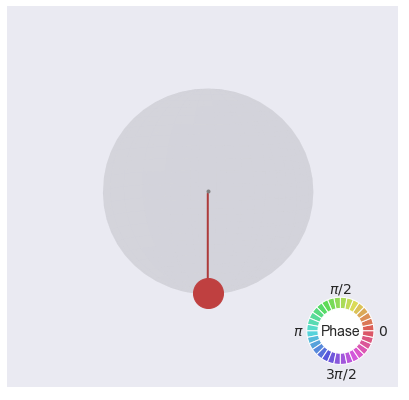
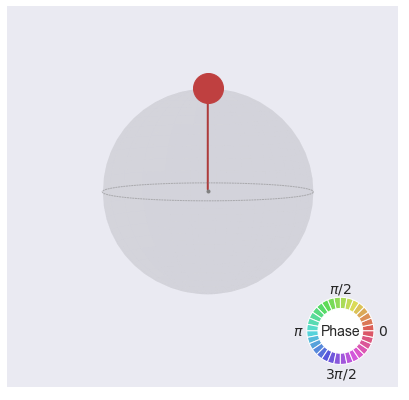
The qsphere contains both amplitude and phase information. In order to fully understand how it works, let& #39;s start simple. For the single-qubit state |0>, this is how it looks
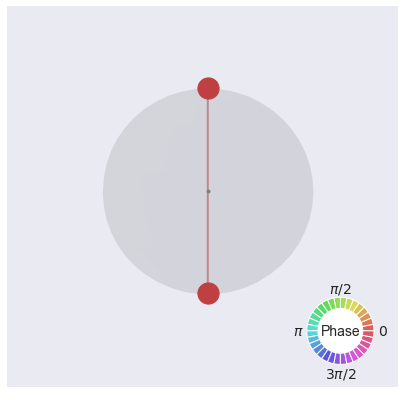
So far, you might be thinking that this is very similar to the Bloch sphere, but check this out. What if you created the state |0> + |1> (with normalization removed for clarity)? Here& #39;s how it looks. Note that the blobs are now only half the size of the previous ones.
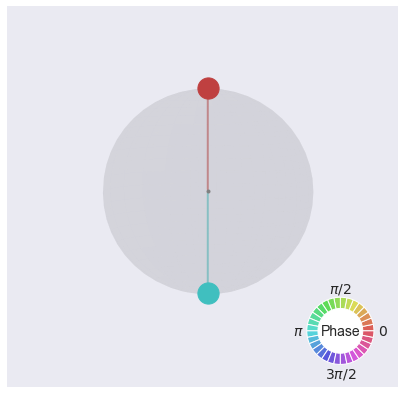
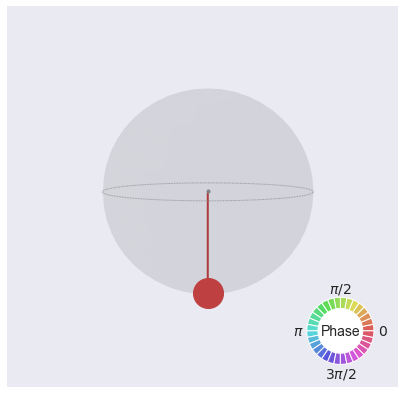
What about the state |0> - |1>? Now there& #39;s a phase of 180 degrees (or pi) between the |0> and |1> states, so here& #39;s how it looks.
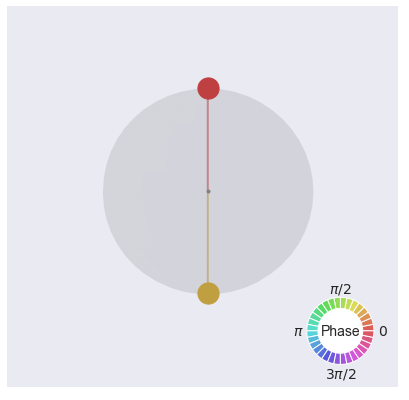
And in fact, if I created a phase of just 45 degrees (or pi/4) between these two states, here& #39;s how it looks. Colors galore!
This is one of the benefits of using the qsphere -- it& #39;s very easy to see both amplitude and phase information. But the other really cool feature of using the qsphere is to visualize the states of multiple qubits, which is something you simply can& #39;t do with the Bloch sphere.
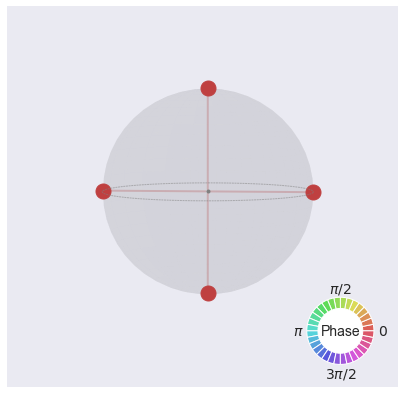
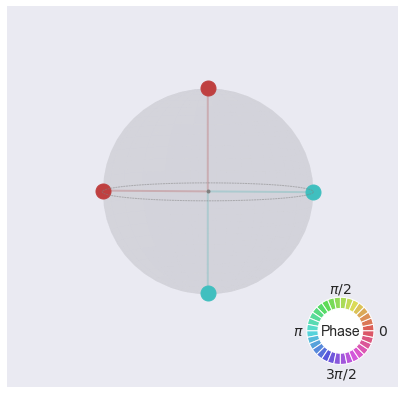
But if I created a superposition of all the two-qubit states |00> + |01> + |10> + |11>? And if I created |00> + |01> - |10> - |11>? Well, here& #39;s how it all looks. The blobs on the left and right in the qspheres are |01> and |10>.
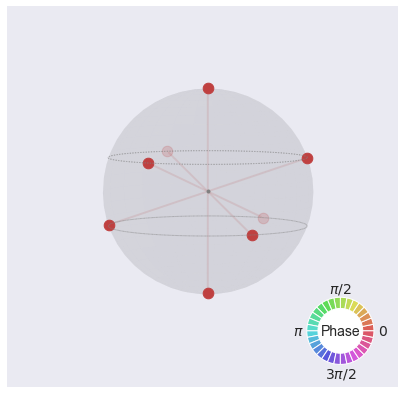
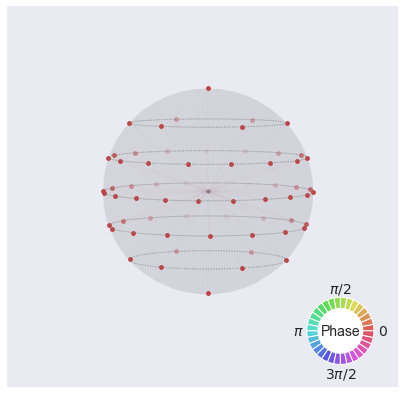
Here& #39;s how an equal superposition of all eight 3-qubit and all sixty-four 6-qubit states looks on the qsphere. Notice how the blobs are getting smaller to signify that an equal superposition means lower amplitudes of the individual states for more qubits
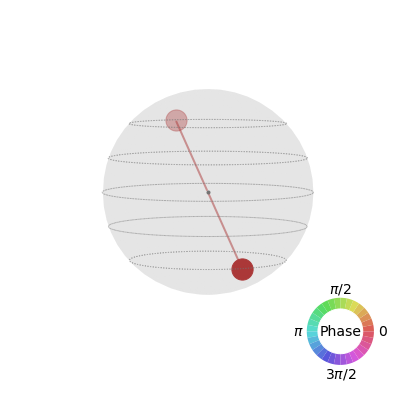
** minor digression** If you& #39;ve ever wondered where the qiskit logo comes from, now you know  https://abs.twimg.com/emoji/v2/... draggable="false" alt="😃" title="Smiling face with open mouth" aria-label="Emoji: Smiling face with open mouth"> Here& #39;s the code:
from qiskit.visualization import plot_state_qsphere
state = [0]*2**6
state[2] = 1; state[61] = 1
plot_state_qsphere(state)
from qiskit.visualization import plot_state_qsphere
state = [0]*2**6
state[2] = 1; state[61] = 1
plot_state_qsphere(state)
The ability to see the phase information can be very powerful. In addition to the Grover example above, here& #39;s a sequence of gates doing QFT followed by inverse-QFT. You can see the creation of states with different phases and the interference that brings it all back clearly

 Read on Twitter
 Here& #39;s the code:from qiskit.visualization import plot_state_qspherestate = [0]*2**6state[2] = 1; state[61] = 1plot_state_qsphere(state)" title="** minor digression** If you& #39;ve ever wondered where the qiskit logo comes from, now you know https://abs.twimg.com/emoji/v2/... draggable="false" alt="😃" title="Smiling face with open mouth" aria-label="Emoji: Smiling face with open mouth"> Here& #39;s the code:from qiskit.visualization import plot_state_qspherestate = [0]*2**6state[2] = 1; state[61] = 1plot_state_qsphere(state)" class="img-responsive" style="max-width:100%;"/>


