Today, the Ministry of Health did another dump of data via their press conference, and note that this data is from the Ministry of Health - the one providing the press releases. Not CARPHA.
There are insane inconsistencies - and let& #39;s start with the epidemiological curve.
(1/n)
There are insane inconsistencies - and let& #39;s start with the epidemiological curve.
(1/n)
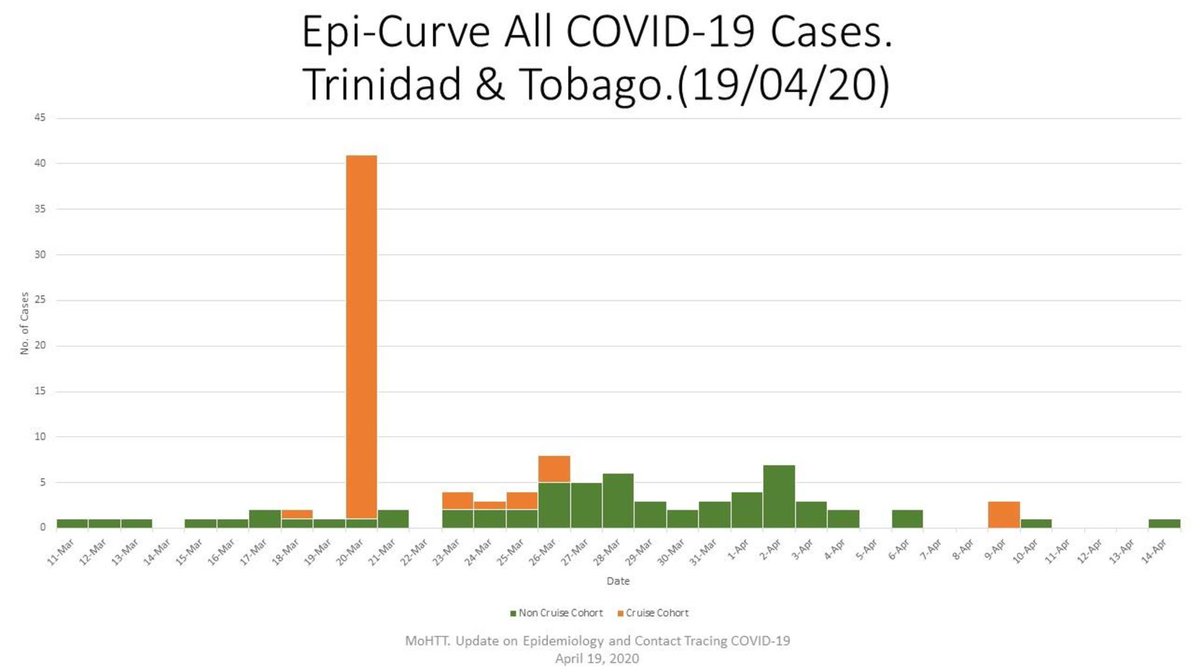
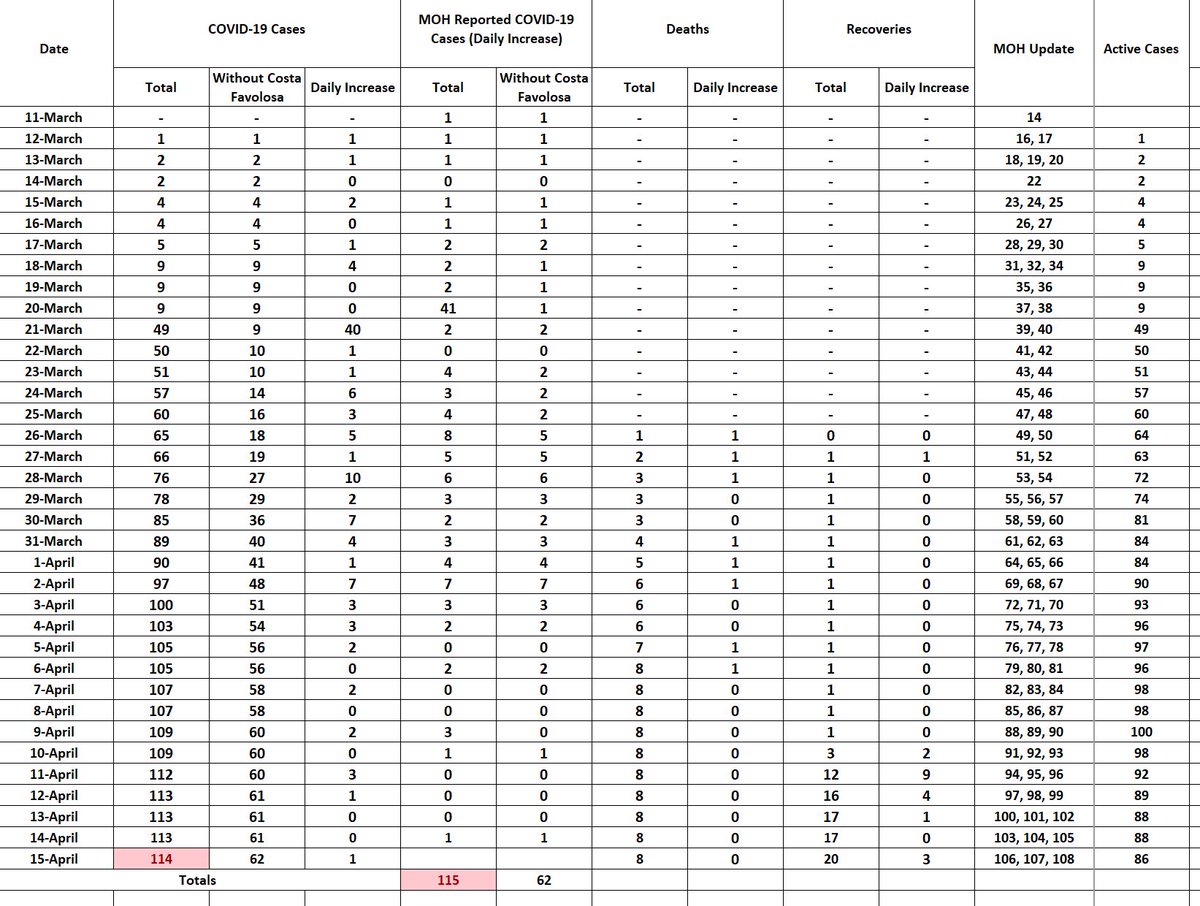
The 1st COVID-19 case, according to this graphic was on March 11th.
TBT to March 12th, when MOH had a big press conference touting transparency, giving a big detailed timeline of events - stating that the positive test result came back on the 12th: https://ttweathercenter.com/breaking-first-covid-19-case-in-tt-ministry-of-health/
(2/n)">https://ttweathercenter.com/breaking-...
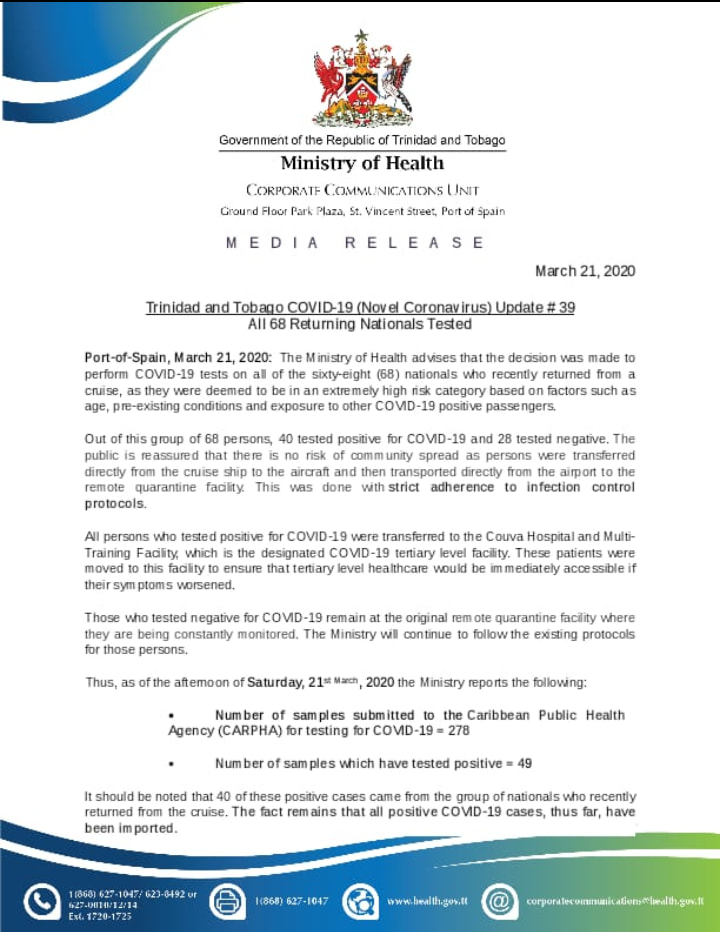
And the Costa Favolosa cases. It inflated our totals, we know that. The first cases (+40) from the cruise ship weren& #39;t announced until March 21st.
Look at the curve again to see when the first one appeared - March 18th.
(3/n)
Look at the curve again to see when the first one appeared - March 18th.
(3/n)
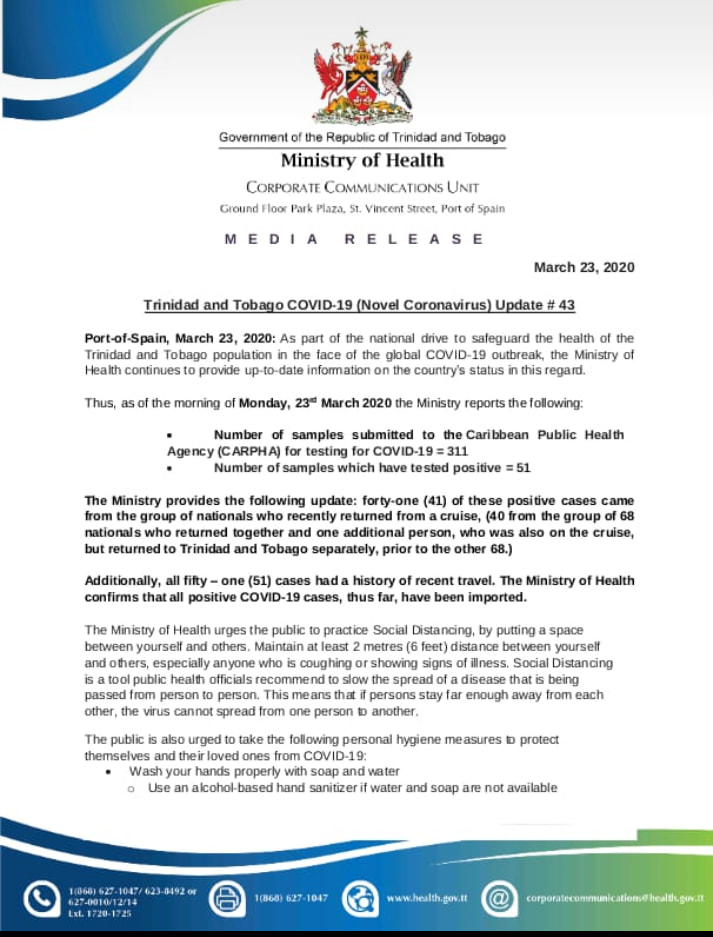
On top of that, it took two days for the Costa Favolosa cases (outside of that 40) to appear on press releases (see below).
Some #transparency.
(4/n)
Some #transparency.
(4/n)
I& #39;ve been tracking the numbers for each press release here: https://ttweathercenter.com/tracking-covid-19-in-tt-96-hours-without-a-new-covid-19-case/
But">https://ttweathercenter.com/tracking-... based on the problematic curve above, we have 115 cases - not the reported 114 cases. Take a look at the red cells to see the different totals between the MOH releases & MOH curve.
(5/n)
But">https://ttweathercenter.com/tracking-... based on the problematic curve above, we have 115 cases - not the reported 114 cases. Take a look at the red cells to see the different totals between the MOH releases & MOH curve.
(5/n)
And what& #39;s mind-boggling is that both sources of data - the press releases and the epidemiological curve come from the same source - the Ministry of Health.
And now the Demographic Data. Which is even more insane.
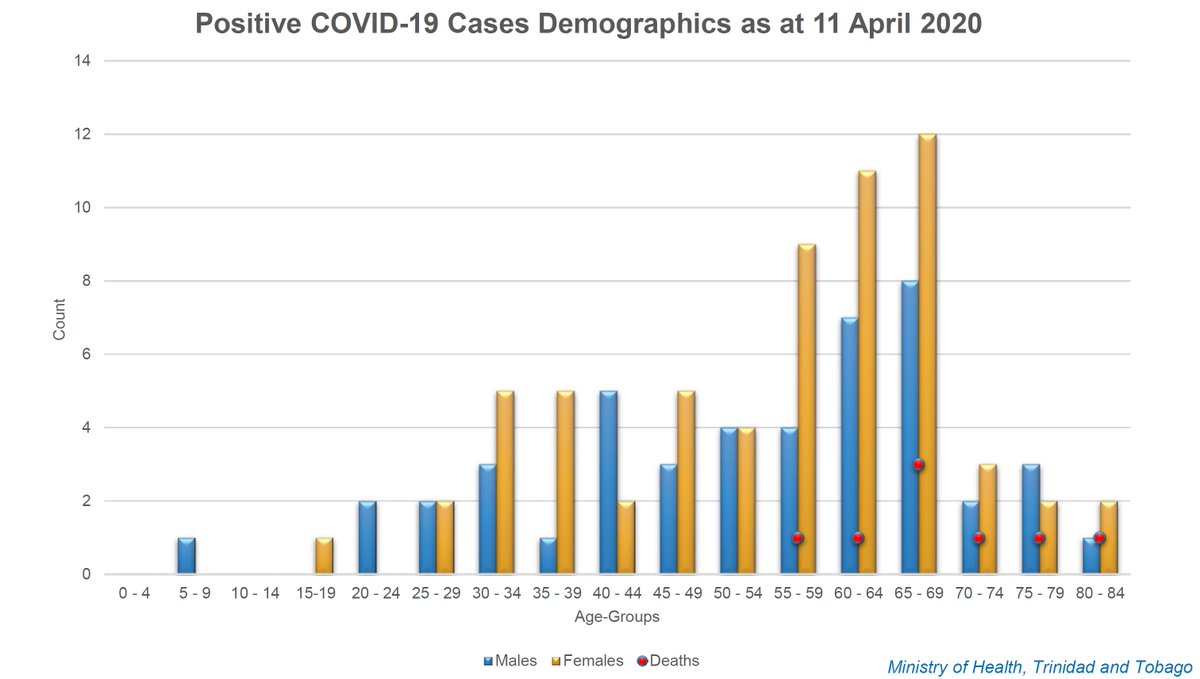
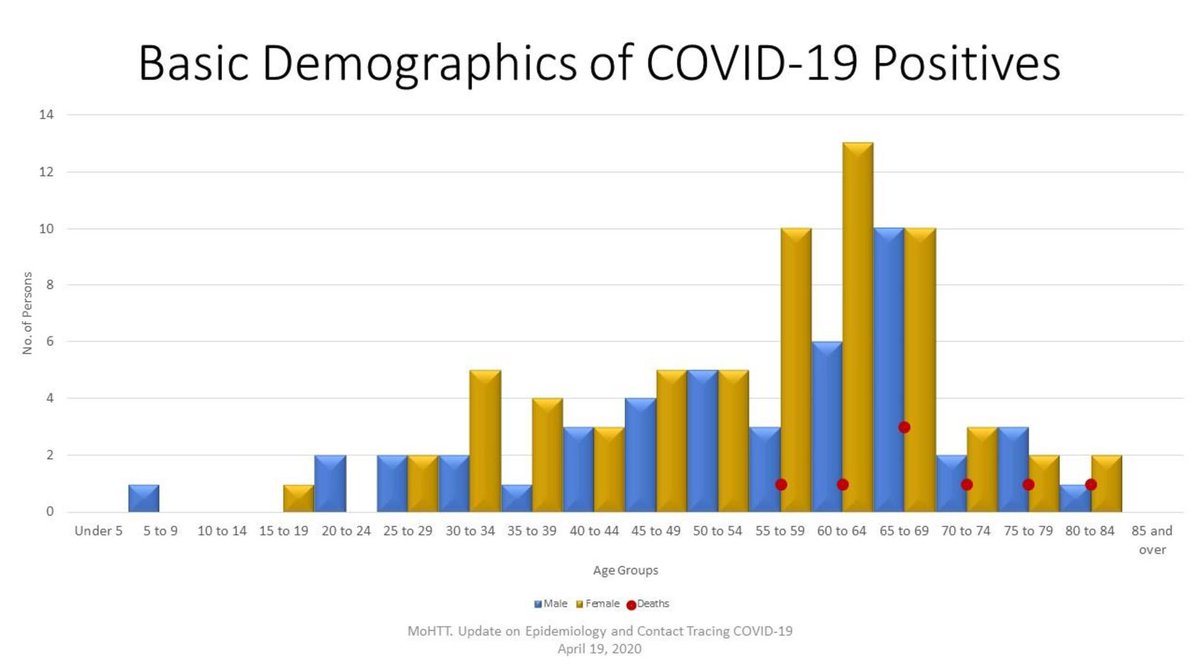
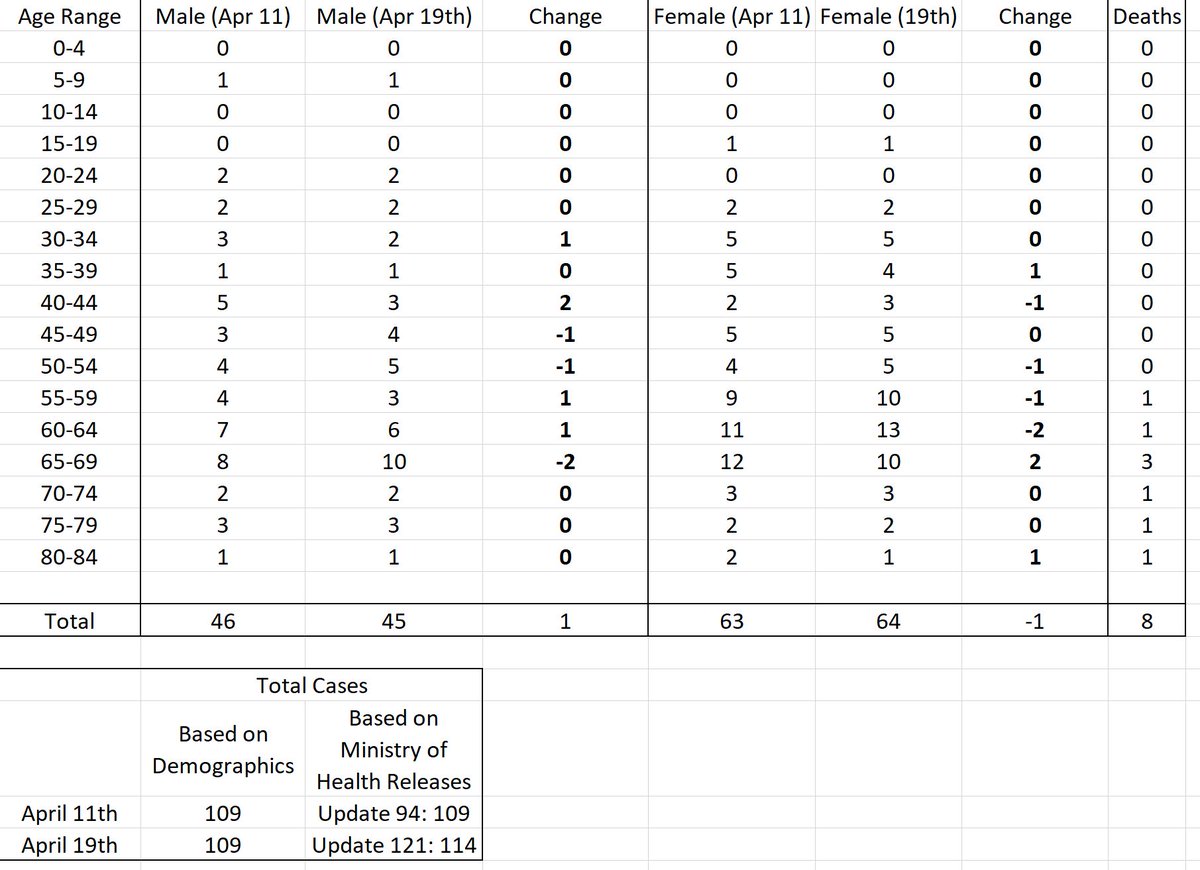
April 11th (109 cases) vs April 19th (114 cases)
(6/n)
And now the Demographic Data. Which is even more insane.
April 11th (109 cases) vs April 19th (114 cases)
(6/n)
In the press conference today, Dr. Avery Hinds, Technical Director in the Epidemiology Division at the Ministry of Health, said the demographic data represented ALL patients until today - meaning discharged, deceased, etc.
But the numbers again ain& #39;t adding up.
(7/n)
But the numbers again ain& #39;t adding up.
(7/n)
Unless COVID-19 is causing transitions in age AND sex in Caura, Couva & Grande - wtf is going on here. And I find it rhel hard to believe so many of them had birthdays.
On top of that, the data for April 11th matched the reported total, but for April 19th - it did not.
(8/n)
On top of that, the data for April 11th matched the reported total, but for April 19th - it did not.
(8/n)
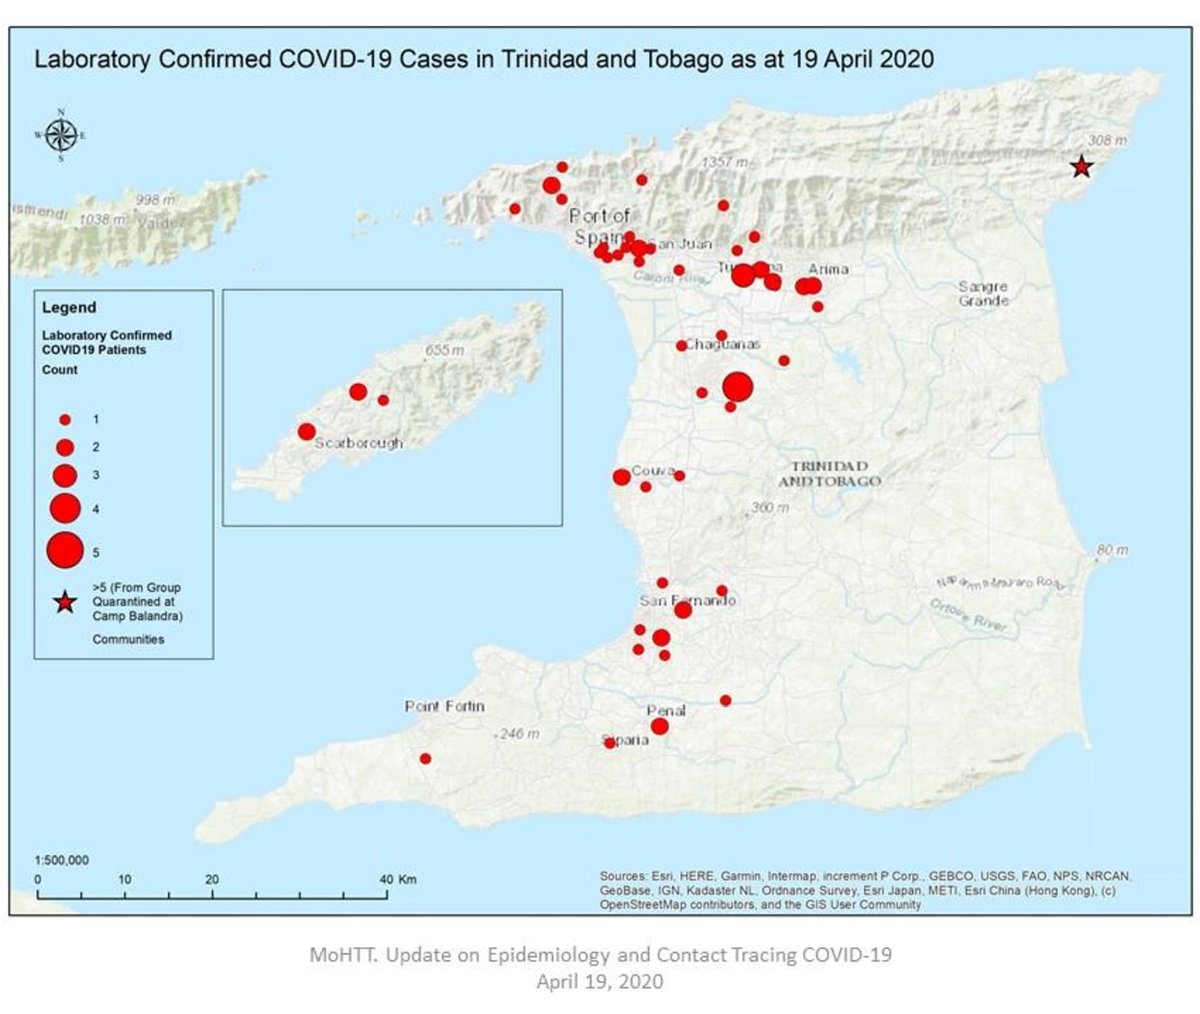
And I done get on the bad side of the Ministry of Health GIS Unit, the UWI GIS Unit and Minister of Health for reproducing their maps and making it useful for the public - https://ttweathercenter.com/covid-19-in-tt-one-month-later/
Seems">https://ttweathercenter.com/covid-19-... like they got their stuff together - that data added up to 114
(9/n)
Seems">https://ttweathercenter.com/covid-19-... like they got their stuff together - that data added up to 114
(9/n)
Now why post all of this. I getting rhel sick of the media tryna ask questions concerning the data and the following happens:
- Public - "Allyuh want the government to fail"
- MOH - "Patient confidentiality" or "CARPHA!!!!"
(10/n)
- Public - "Allyuh want the government to fail"
- MOH - "Patient confidentiality" or "CARPHA!!!!"
(10/n)

 Read on Twitter