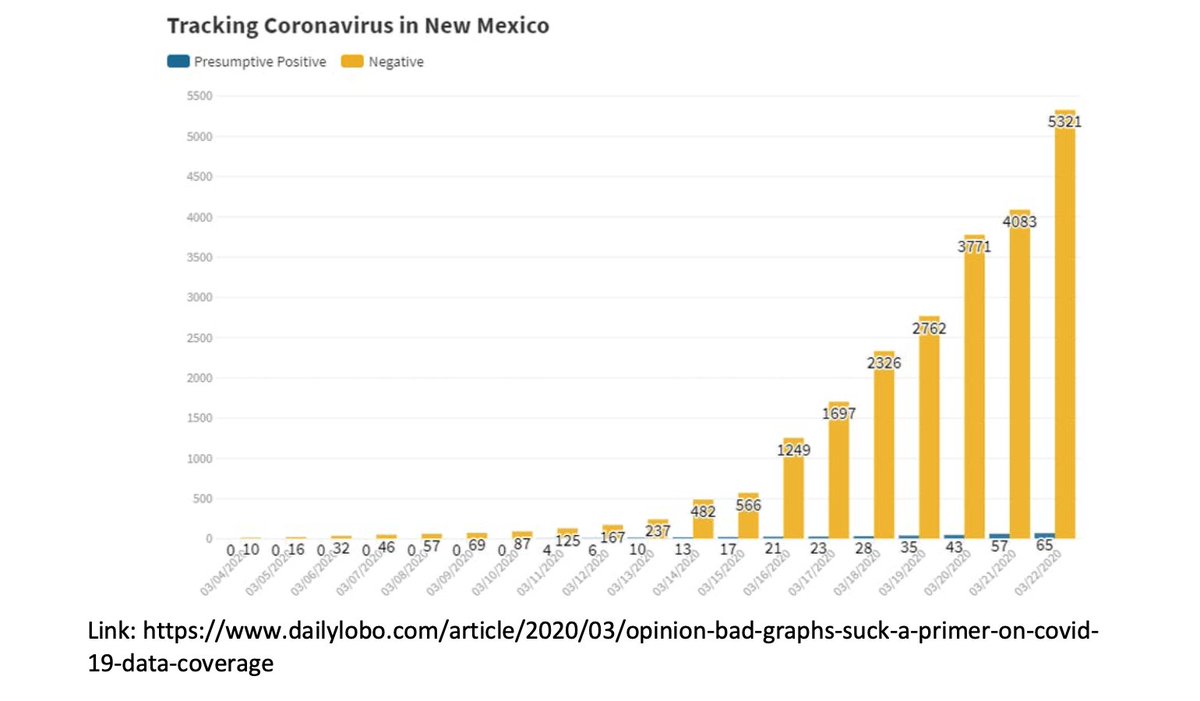
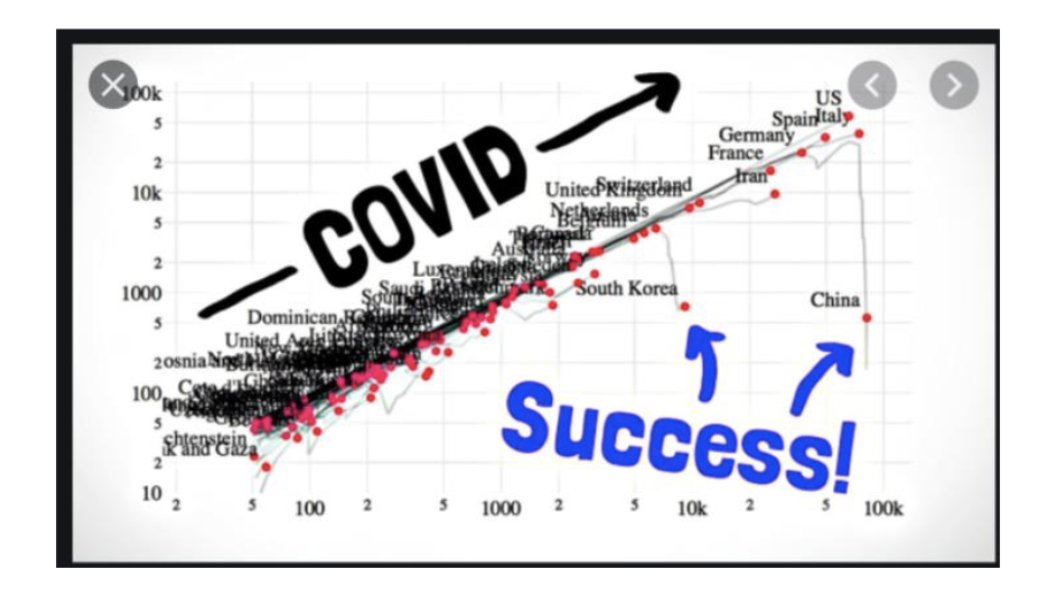
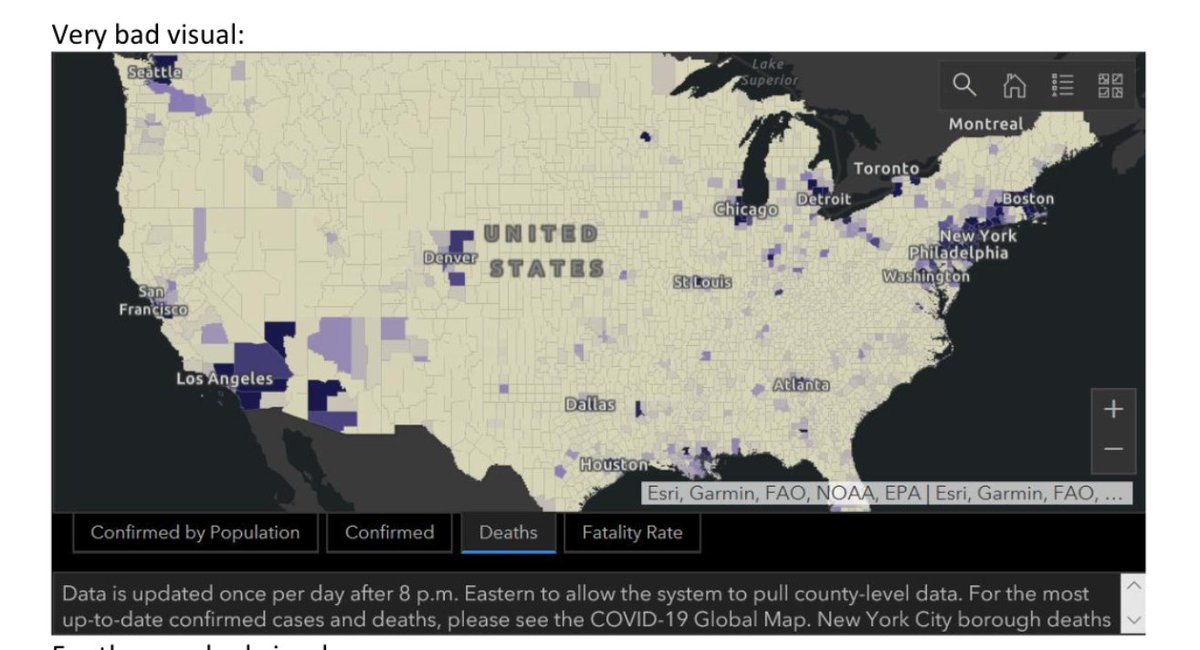
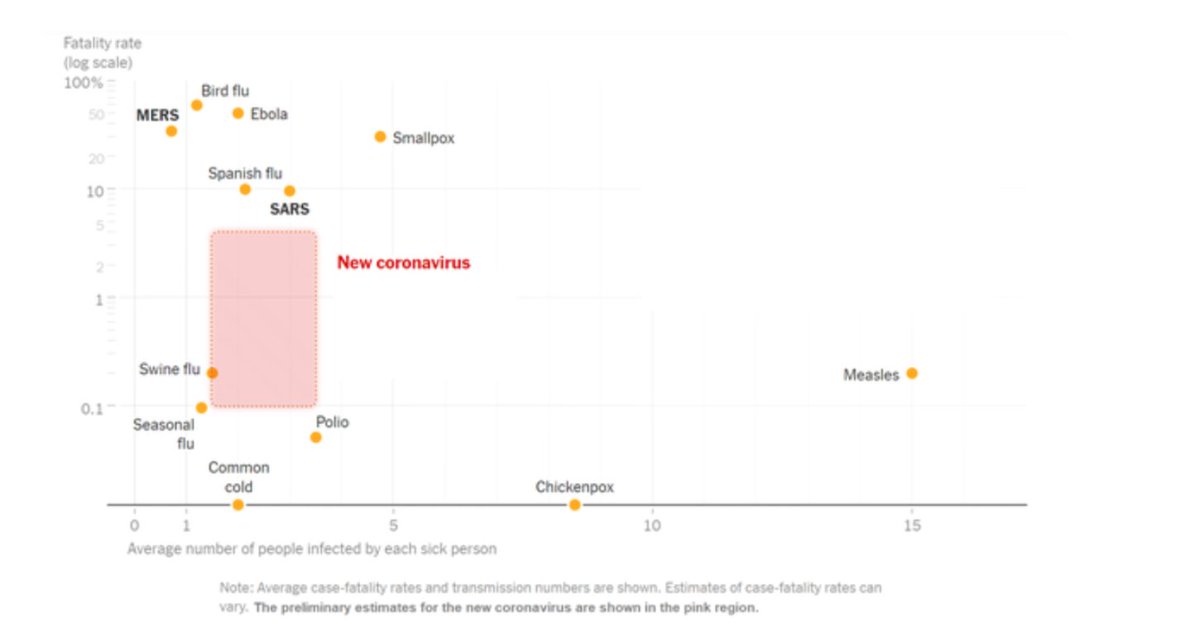
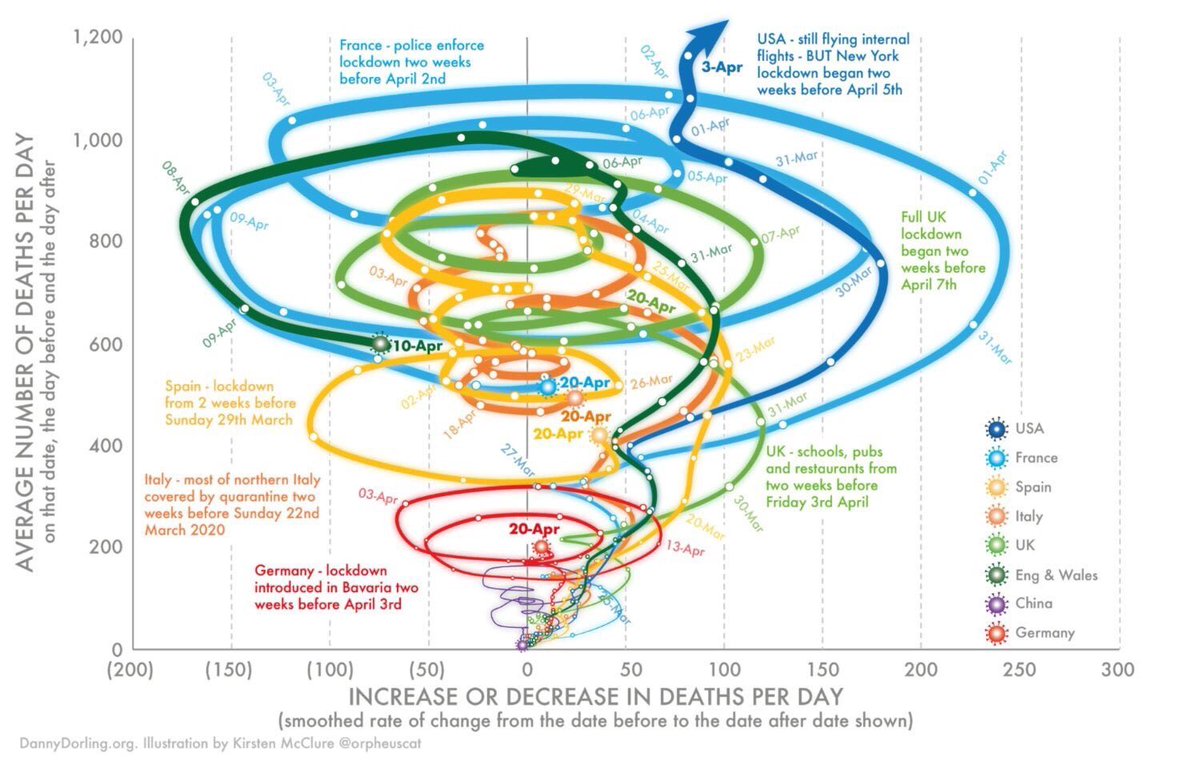
My students have been collecting bad COVID-19 graphs and I love them so far so I am going to post them in this thread
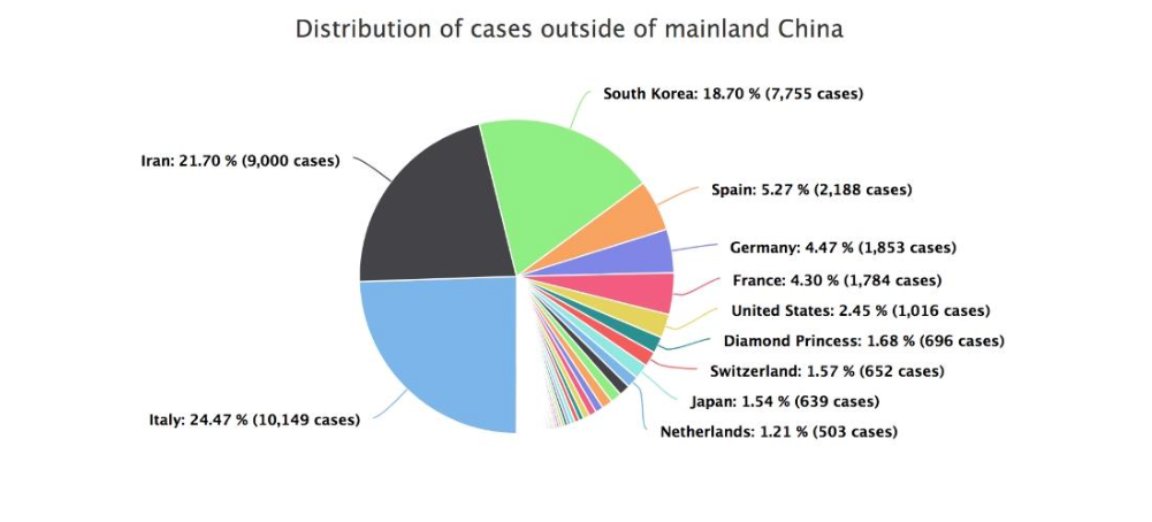
graphs like this are why scientists hate pie charts. this graph won& #39;t photocopy well, and there are too many slices to be able to clearly read.I am intrigued by the fact a single cruise ship is as big a slice as Switzerland is, though. the data in this is outdated, but still, wow
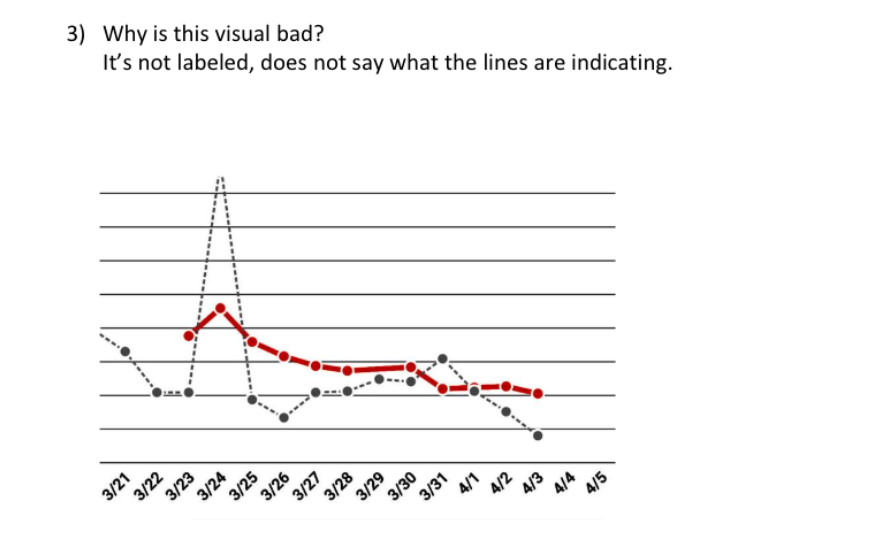
if you don& #39;t label your axis or provide a legend, how are we supposed to know what& #39;s happening? also, it& #39;s only ~sometimes a good idea to contrast two lines of data. sometimes it& #39;s better to make two graphs. I can& #39;t say if it& #39;s a good idea here because I don& #39;t know what this is
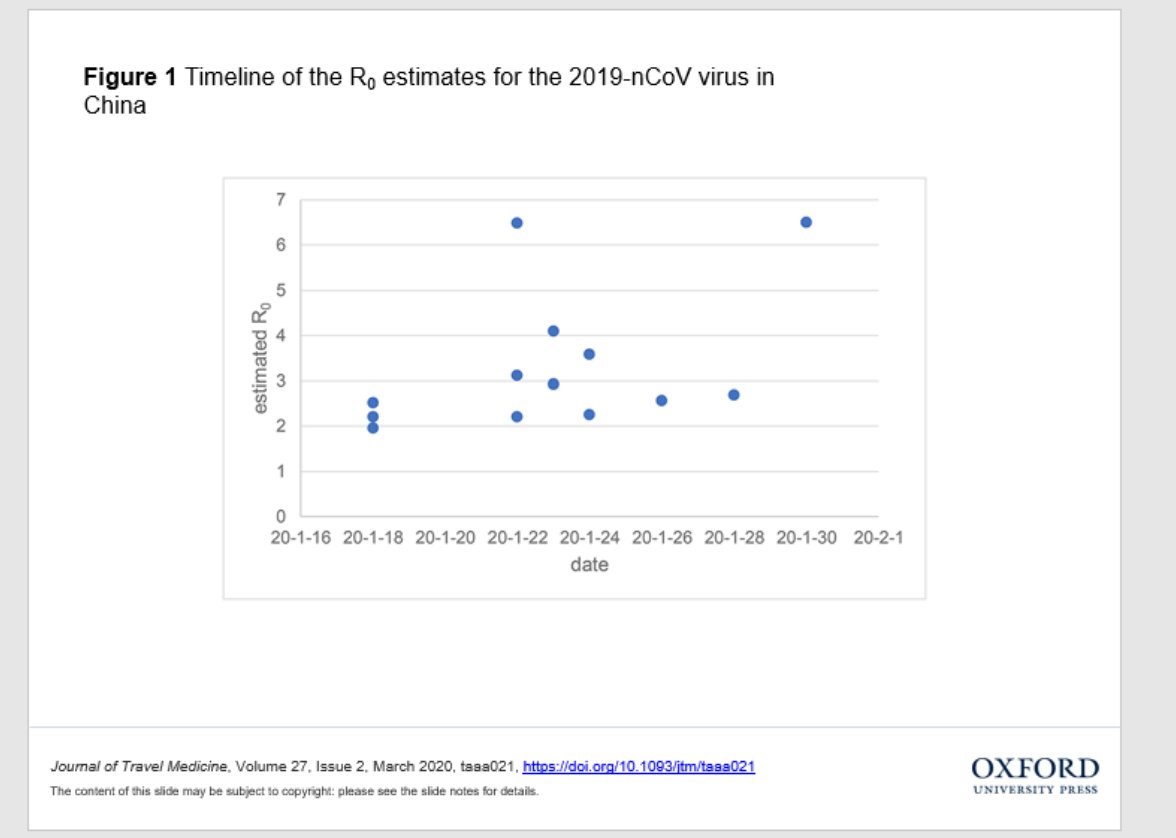
we choose to present things in graphs instead of tables when the visualization makes it easier for our audience to see a pattern. do you see a pattern here? I don& #39;t.
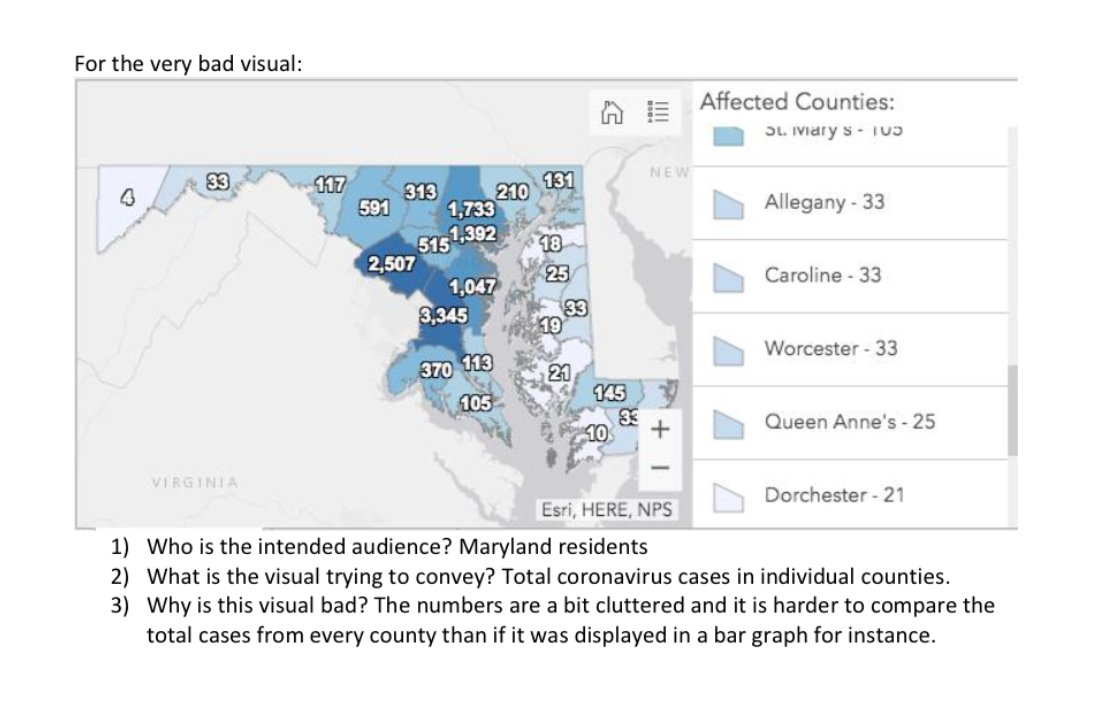
this won& #39;t photocopy well, but it& #39;s also quite cluttered. if you were going to put this on TV? there are better ways to do this.
I will add more as they turn their assignments in and I grade them!
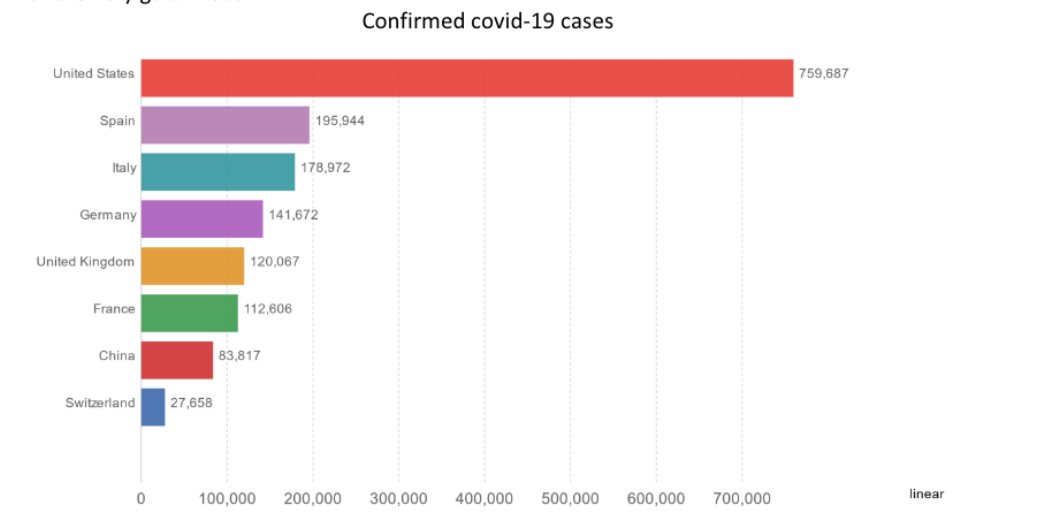
This graph appears to show a trend and it& #39;s easy to follow... except the data isn& #39;t particularly meaningful because every country has a different population. It would be ~better if the graph showed cases per 100K people, but still not perfect since testing rates vary.
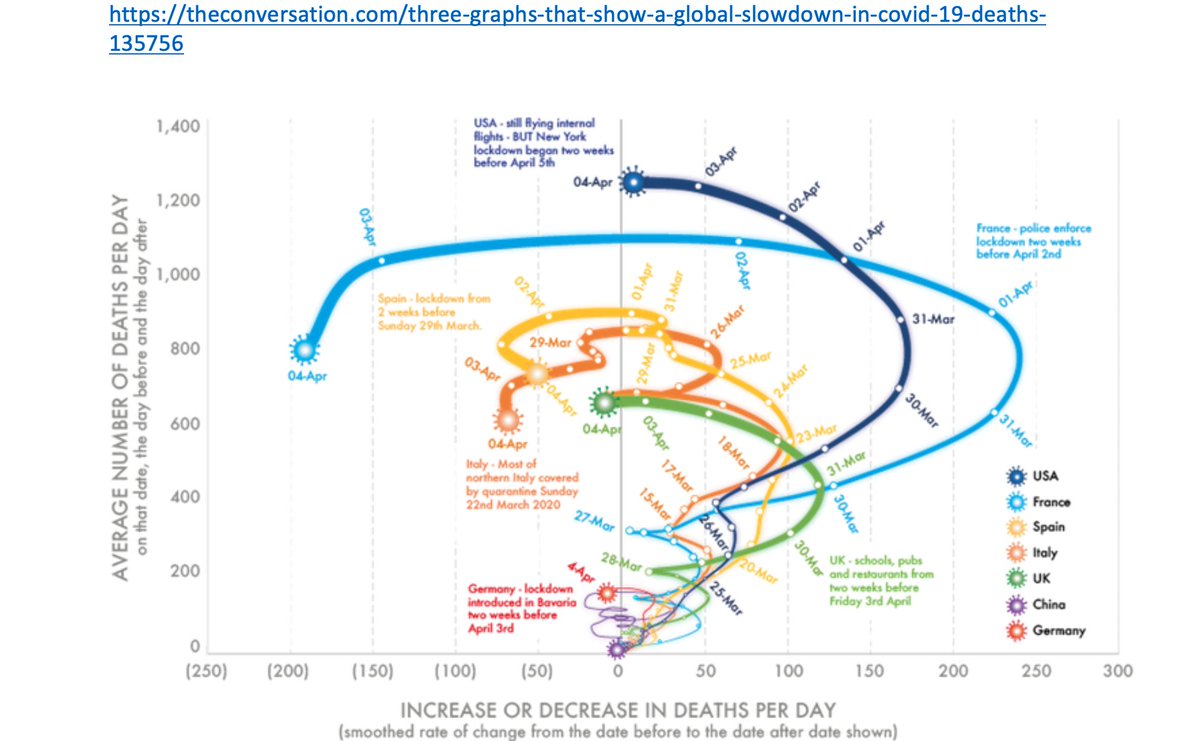
This is overwhelming to look at and the spots overlap in ways that obscure the data. Apparently zooming in is possible, but you want visuals to be QUICKLY readable. No one should have to squint or study or hurt their brains trying to figure them out.
QUICK SCICOMM TUTORIAL
Good visuals:
1) are easy to read
2) provide meaningful, unambiguous data
3) are tailored to an audience & purpose
4) do a better job at communicating information than words/tables alone
5) don& #39;t distort data
6) don& #39;t contain more or less info than needed
Good visuals:
1) are easy to read
2) provide meaningful, unambiguous data
3) are tailored to an audience & purpose
4) do a better job at communicating information than words/tables alone
5) don& #39;t distort data
6) don& #39;t contain more or less info than needed
The number of positive tests is not meaningful in the absence of 1) populations 2) testing availability
Of COURSE big populations have big numbers. & There are no +& #39;s w/o tests
To be meaningful, this would need to be per 100K people with estimates for availability of testing
Of COURSE big populations have big numbers. & There are no +& #39;s w/o tests
To be meaningful, this would need to be per 100K people with estimates for availability of testing
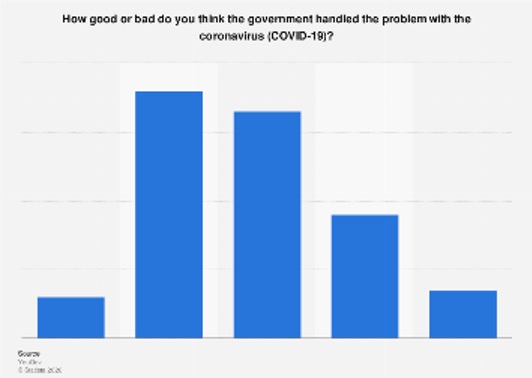
Lets forget for a moment that there are no axis labels and we don& #39;t actually know what these bars mean. How tf do you get five bars from "good or bad"?????
In the first tweet I said "bad graphs" and I should specify the assignment was "bad graphs and visuals" because these aren& #39;t all ~graphs per se
I don& #39;t even know where to start with this one.
It& #39;s Florida... but that& #39;s the whole Southeastern US. What do the dots mean? Why are there different colors? Is that important somehow? Why is there a bar graph next to the map? Is that new cases in the whole US? Or just Florida?
It& #39;s Florida... but that& #39;s the whole Southeastern US. What do the dots mean? Why are there different colors? Is that important somehow? Why is there a bar graph next to the map? Is that new cases in the whole US? Or just Florida?
I& #39;m going to go on the record as not liking any visual that compares a lack of cases in counties that may not be testing to the # of cases in counties that are testing as if that means anything.
Also, like, the unnecessary chaos here. Does this tell us anything but population?
Also, like, the unnecessary chaos here. Does this tell us anything but population?
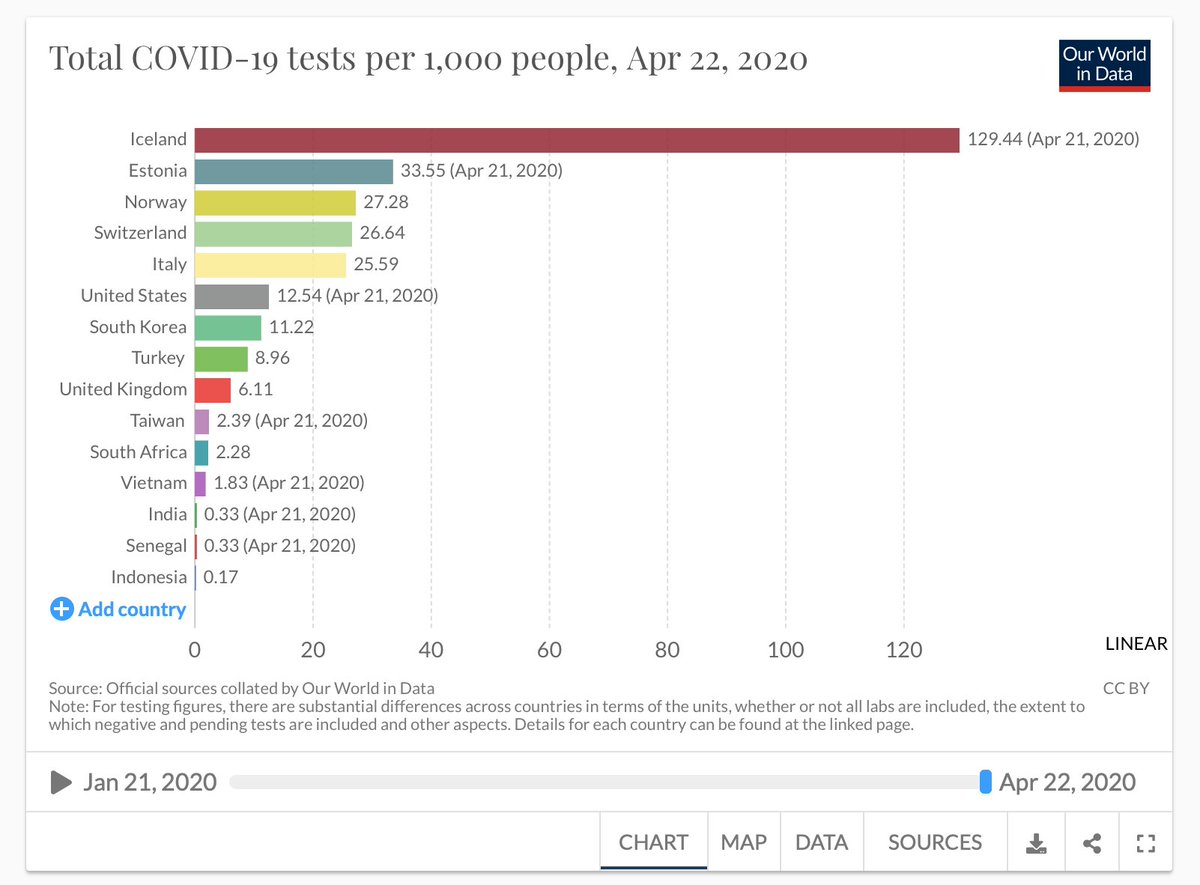
I actually have seen some good graphs, too. In the midst of this thread of terrible graphs, I just want you to know good ones are possible. I have seen several good ones from https://ourworldindata.org"> https://ourworldindata.org . Meaningful, clear ones that include context
This one is not one of the good ones, though.
 https://abs.twimg.com/emoji/v2/... draggable="false" alt="👏🏻" title="Applaus-Zeichen (heller Hautton)" aria-label="Emoji: Applaus-Zeichen (heller Hautton)">use
  https://abs.twimg.com/emoji/v2/... draggable="false" alt="👏🏻" title="Applaus-Zeichen (heller Hautton)" aria-label="Emoji: Applaus-Zeichen (heller Hautton)">legends
  https://abs.twimg.com/emoji/v2/... draggable="false" alt="👏🏻" title="Applaus-Zeichen (heller Hautton)" aria-label="Emoji: Applaus-Zeichen (heller Hautton)">please
 https://abs.twimg.com/emoji/v2/... draggable="false" alt="👏🏻" title="Applaus-Zeichen (heller Hautton)" aria-label="Emoji: Applaus-Zeichen (heller Hautton)">
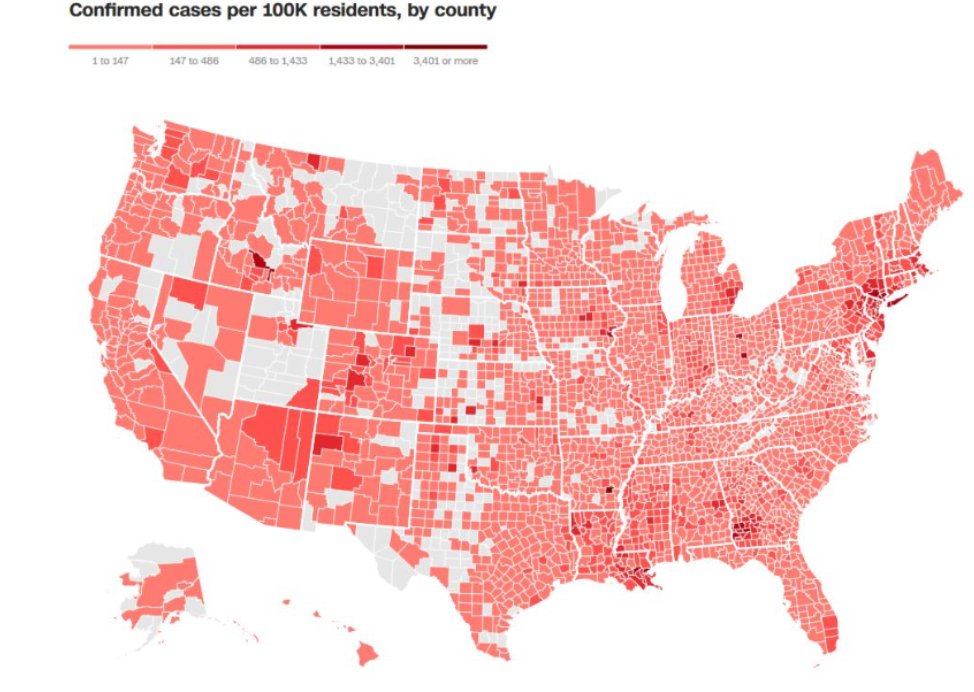
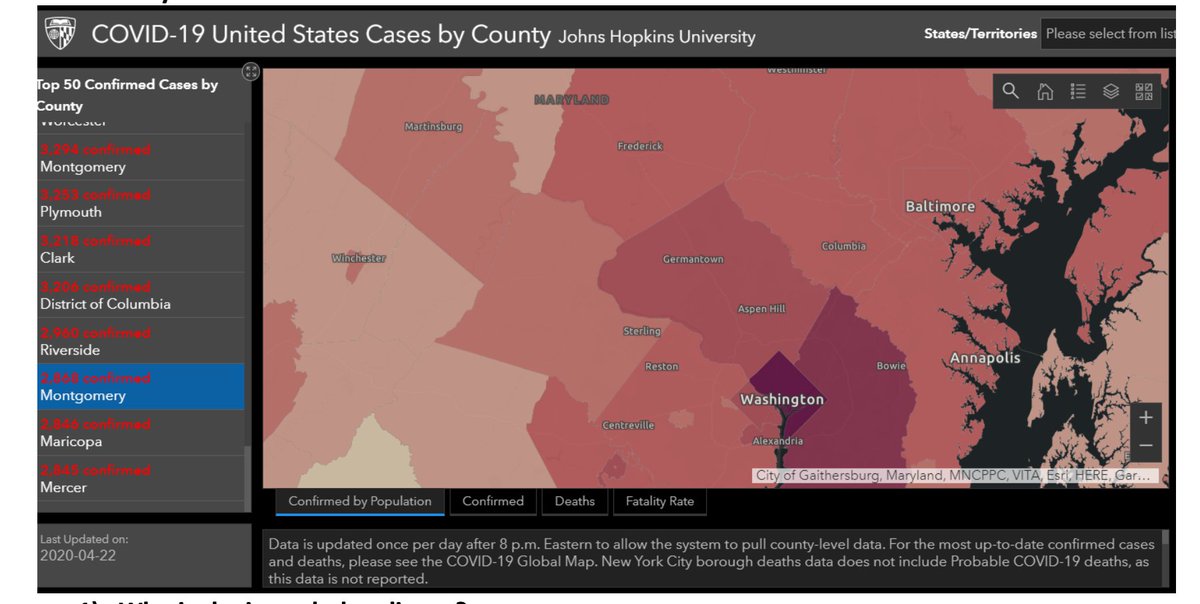
As far as maps go, I don& #39;t hate this one. But here is the thing
Most maps only tell us where people live. And it& #39;s the PEOPLE that matter.
One thing a lot of scientists/data-people do wrong when it comes to graphs is they don& #39;t adjust to their audience. That last graph might be FINE if it& #39;s the sort you& #39;re used to looking at. But if you& #39;re not? For public-facing graphs, you need to adjust.
Cherry picking data that isn& #39;t meaningful just to push an agenda makes me angry. This graph is COMPLETELY not meaningful because of COURSE countries less affected--or countries hiding true numbers, or with better management--will not have the same sorts of lockdowns. FURTHERMORE
Let& #39;s look at what happened to Sweden after their non-lockdown. (This is another GOOD graph. Shoutout to https://ourworldindata.org"> https://ourworldindata.org ; I am becoming a big fan of y& #39;all)
So, graphs like this can be useful. But I& #39;m still not a big fan. Every country has a different population--and every population is different. Raw number of deaths doesn& #39;t tell us very much if you& #39;re comparing the number of deaths in a small country against a big one.
I had to look at this three times before I realized there were two sets of data in this graph. My student suggested a form change from bar graph to line graph would improve this and I don& #39;t disagree.
My student just wrote underneath a graph, "if anyone could explain to me what is happening here I would be so grateful" and lmao what a mood
Just gon leave this here
https://twitter.com/rodolfoalmd/status/1255203098764730369?s=21">https://twitter.com/rodolfoal... https://twitter.com/rodolfoalmd/status/1255203098764730369">https://twitter.com/rodolfoal...
https://twitter.com/rodolfoalmd/status/1255203098764730369?s=21">https://twitter.com/rodolfoal... https://twitter.com/rodolfoalmd/status/1255203098764730369">https://twitter.com/rodolfoal...
don’t  https://abs.twimg.com/emoji/v2/... draggable="false" alt="👏🏻" title="Applaus-Zeichen (heller Hautton)" aria-label="Emoji: Applaus-Zeichen (heller Hautton)">distort
 https://abs.twimg.com/emoji/v2/... draggable="false" alt="👏🏻" title="Applaus-Zeichen (heller Hautton)" aria-label="Emoji: Applaus-Zeichen (heller Hautton)">data
 https://abs.twimg.com/emoji/v2/... draggable="false" alt="👏🏻" title="Applaus-Zeichen (heller Hautton)" aria-label="Emoji: Applaus-Zeichen (heller Hautton)">for
 https://abs.twimg.com/emoji/v2/... draggable="false" alt="👏🏻" title="Applaus-Zeichen (heller Hautton)" aria-label="Emoji: Applaus-Zeichen (heller Hautton)">your
 https://abs.twimg.com/emoji/v2/... draggable="false" alt="👏🏻" title="Applaus-Zeichen (heller Hautton)" aria-label="Emoji: Applaus-Zeichen (heller Hautton)">agenda
 https://abs.twimg.com/emoji/v2/... draggable="false" alt="👏🏻" title="Applaus-Zeichen (heller Hautton)" aria-label="Emoji: Applaus-Zeichen (heller Hautton)">
https://twitter.com/charleststella/status/1261633629702111232?s=21">https://twitter.com/charlests... https://twitter.com/CharlesTStella/status/1261633629702111232">https://twitter.com/CharlesTS...
https://twitter.com/charleststella/status/1261633629702111232?s=21">https://twitter.com/charlests... https://twitter.com/CharlesTStella/status/1261633629702111232">https://twitter.com/CharlesTS...
You are all my students now and I am going to add what you send me to this thread
Like this one. Read the replies (I know, you normally never should but this is an EXCEPTION) because there is a fascinating discussion about malice versus incompetence and how this happened. H/t @Lyndo12, thanks for sending me this disaster lol
https://twitter.com/andishehnouraee/status/1284237474831761408?s=21">https://twitter.com/andishehn... https://twitter.com/andishehnouraee/status/1284237474831761408">https://twitter.com/andishehn...
https://twitter.com/andishehnouraee/status/1284237474831761408?s=21">https://twitter.com/andishehn... https://twitter.com/andishehnouraee/status/1284237474831761408">https://twitter.com/andishehn...
how DNA is like inductors  https://abs.twimg.com/emoji/v2/... draggable="false" alt="🙃" title="Auf den Kopf gestelltes Gesicht" aria-label="Emoji: Auf den Kopf gestelltes Gesicht">
https://twitter.com/thoughtsofaphd/status/1286006022788841474?s=21">https://twitter.com/thoughtso... https://twitter.com/thoughtsofaphd/status/1286006022788841474">https://twitter.com/thoughtso...
https://twitter.com/thoughtsofaphd/status/1286006022788841474?s=21">https://twitter.com/thoughtso... https://twitter.com/thoughtsofaphd/status/1286006022788841474">https://twitter.com/thoughtso...
included without comment
https://twitter.com/itsyabitsjace/status/1249708176242507778?s=21">https://twitter.com/itsyabits... https://twitter.com/itsyabitsjace/status/1249708176242507778">https://twitter.com/itsyabits...
https://twitter.com/itsyabitsjace/status/1249708176242507778?s=21">https://twitter.com/itsyabits... https://twitter.com/itsyabitsjace/status/1249708176242507778">https://twitter.com/itsyabits...
this one makes me feel embarrassed for all of us tbh
https://twitter.com/littlechambers/status/1290635729983471622?s=21">https://twitter.com/littlecha... https://twitter.com/littlechambers/status/1290635729983471622">https://twitter.com/littlecha...
https://twitter.com/littlechambers/status/1290635729983471622?s=21">https://twitter.com/littlecha... https://twitter.com/littlechambers/status/1290635729983471622">https://twitter.com/littlecha...
This one is not COVID but about 7 of you tagged me with it and it is very good (bad)
Two big (lol) errors:
1) y axis truncation
2) width/area variance of figures distorts data
https://twitter.com/kejames/status/1291555426706874369?s=21">https://twitter.com/kejames/s... https://twitter.com/kejames/status/1291555426706874369">https://twitter.com/kejames/s...
Two big (lol) errors:
1) y axis truncation
2) width/area variance of figures distorts data
https://twitter.com/kejames/status/1291555426706874369?s=21">https://twitter.com/kejames/s... https://twitter.com/kejames/status/1291555426706874369">https://twitter.com/kejames/s...
We have a winner for the “someone make me a good map” challenge and it is @KylaPadbury
https://twitter.com/kylapadbury/status/1292340150182141954?s=21">https://twitter.com/kylapadbu... https://twitter.com/KylaPadbury/status/1292340150182141954">https://twitter.com/KylaPadbu...
https://twitter.com/kylapadbury/status/1292340150182141954?s=21">https://twitter.com/kylapadbu... https://twitter.com/KylaPadbury/status/1292340150182141954">https://twitter.com/KylaPadbu...
1) it has a clear audience (Twitter) and clear purpose
2) it made me laugh
3) it shows us something OTHER than population
2) it made me laugh
3) it shows us something OTHER than population
I am just gon randomly include non COVID ones now
I laughed at this one because Heather & I had just been talking about nonbinary gender & how hers manifests, which is a little different than other people’s & some of these actually aren’t bad for her, but it’s a ridiculous representation of ~all enbies
https://twitter.com/ciarkents/status/1303009539650760708?s=21">https://twitter.com/ciarkents... https://twitter.com/ciarkents/status/1303009539650760708">https://twitter.com/ciarkents...
https://twitter.com/ciarkents/status/1303009539650760708?s=21">https://twitter.com/ciarkents... https://twitter.com/ciarkents/status/1303009539650760708">https://twitter.com/ciarkents...
The one blue pirate leg one is @L_Historienne, her gender is “one blue pirate leg”

 Read on Twitter



 use https://abs.twimg.com/emoji/v2/... draggable="false" alt="👏🏻" title="Applaus-Zeichen (heller Hautton)" aria-label="Emoji: Applaus-Zeichen (heller Hautton)">legends https://abs.twimg.com/emoji/v2/... draggable="false" alt="👏🏻" title="Applaus-Zeichen (heller Hautton)" aria-label="Emoji: Applaus-Zeichen (heller Hautton)">pleasehttps://abs.twimg.com/emoji/v2/... draggable="false" alt="👏🏻" title="Applaus-Zeichen (heller Hautton)" aria-label="Emoji: Applaus-Zeichen (heller Hautton)">" title="This one is not one of the good ones, though. https://abs.twimg.com/emoji/v2/... draggable="false" alt="👏🏻" title="Applaus-Zeichen (heller Hautton)" aria-label="Emoji: Applaus-Zeichen (heller Hautton)">use https://abs.twimg.com/emoji/v2/... draggable="false" alt="👏🏻" title="Applaus-Zeichen (heller Hautton)" aria-label="Emoji: Applaus-Zeichen (heller Hautton)">legends https://abs.twimg.com/emoji/v2/... draggable="false" alt="👏🏻" title="Applaus-Zeichen (heller Hautton)" aria-label="Emoji: Applaus-Zeichen (heller Hautton)">pleasehttps://abs.twimg.com/emoji/v2/... draggable="false" alt="👏🏻" title="Applaus-Zeichen (heller Hautton)" aria-label="Emoji: Applaus-Zeichen (heller Hautton)">" class="img-responsive" style="max-width:100%;"/>


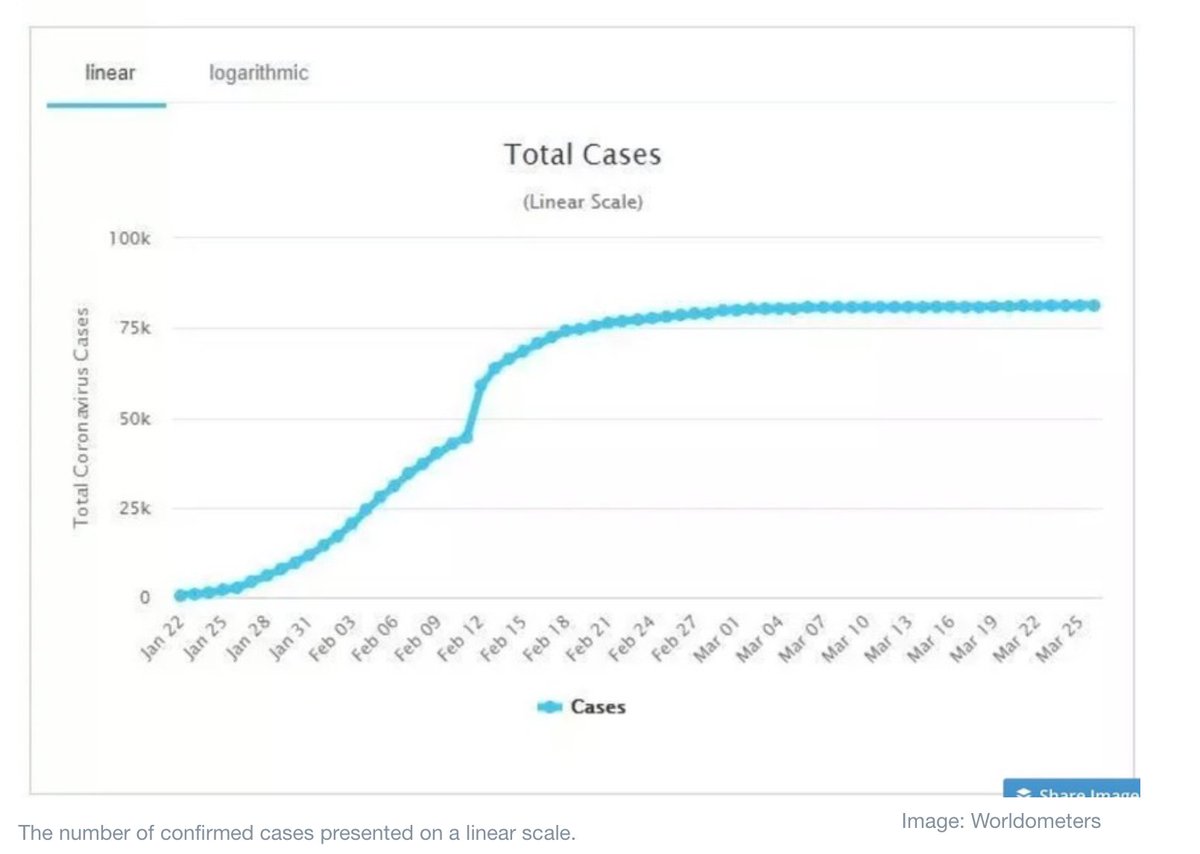
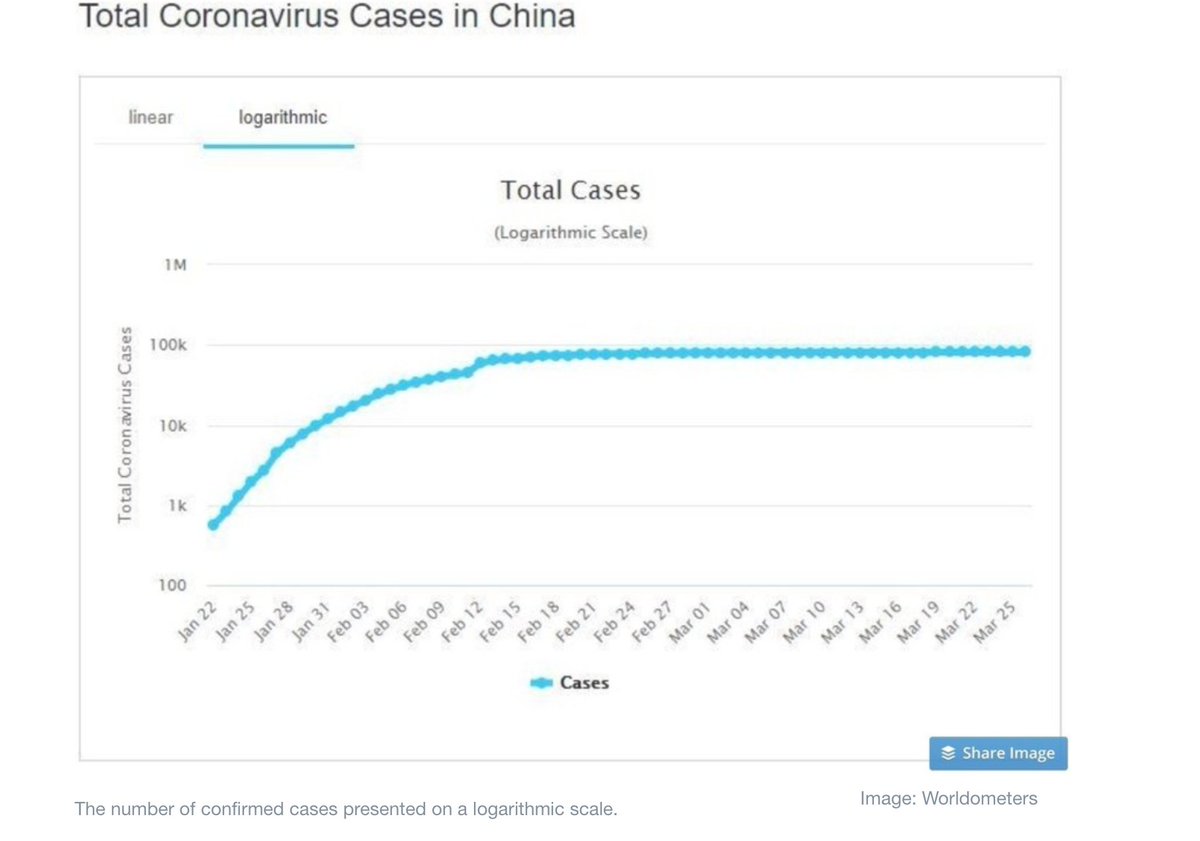
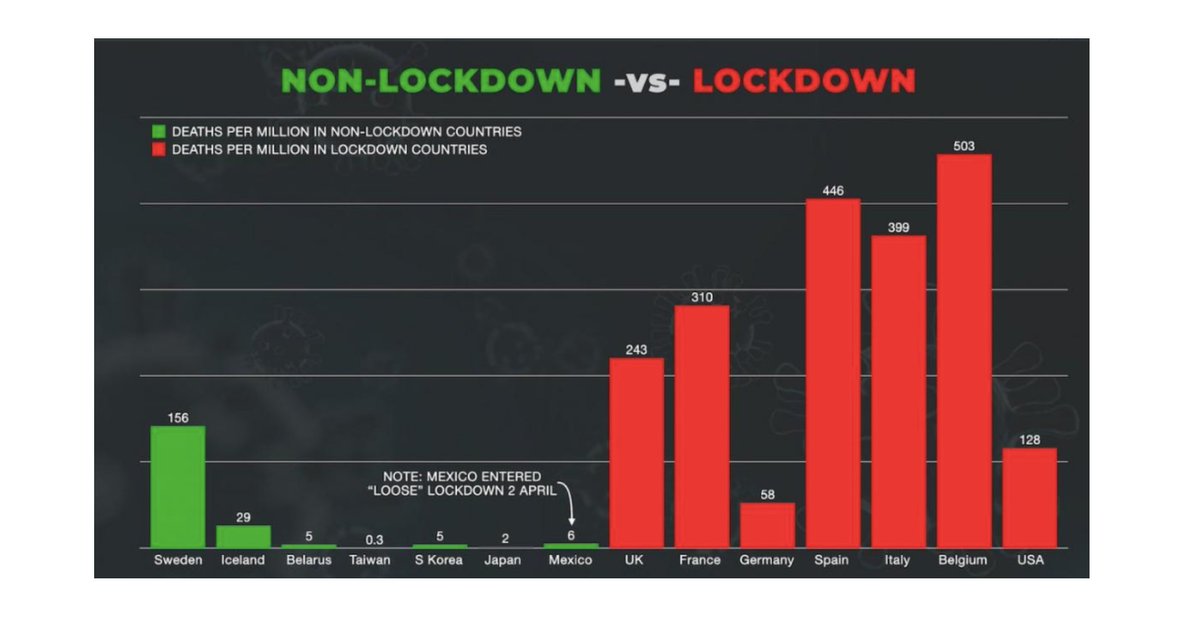
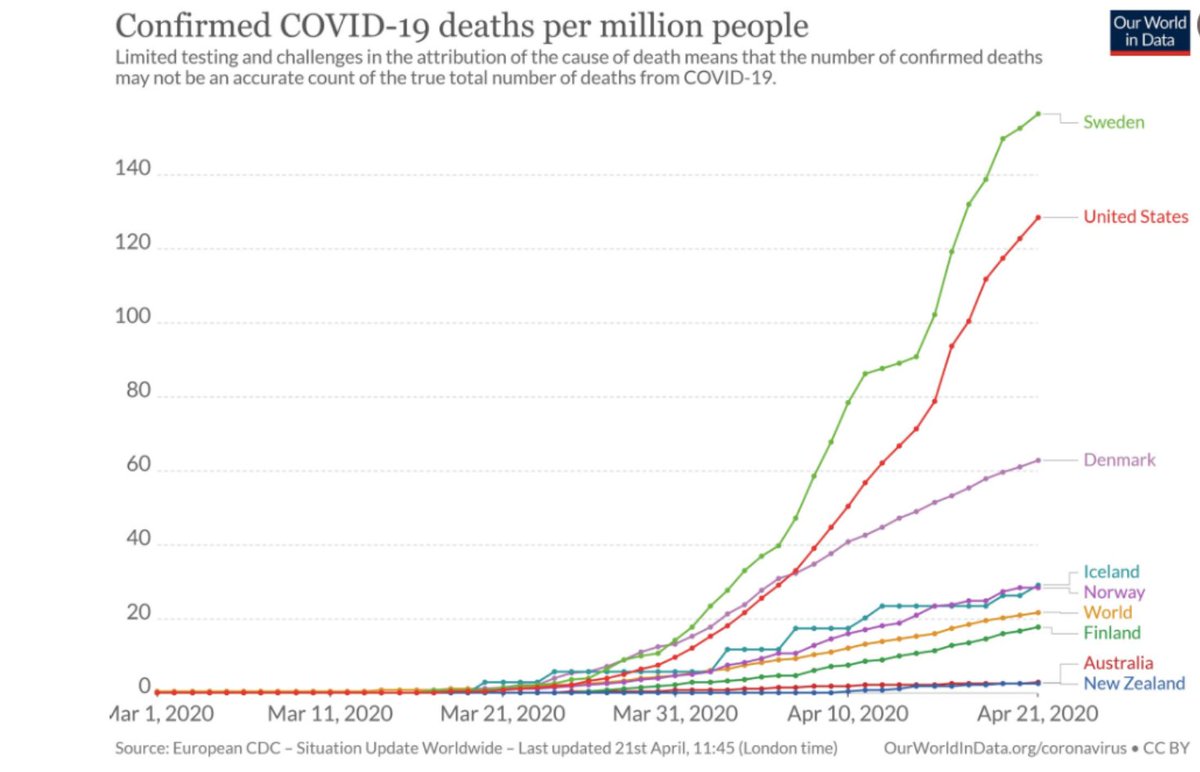


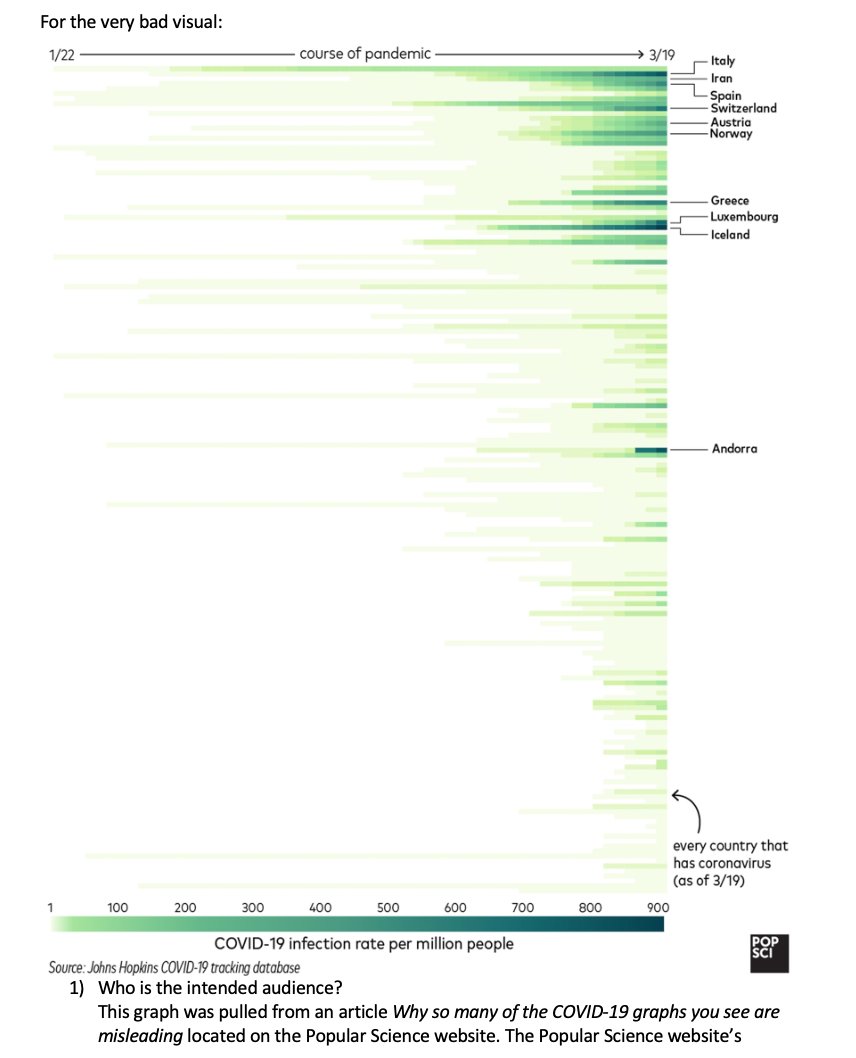
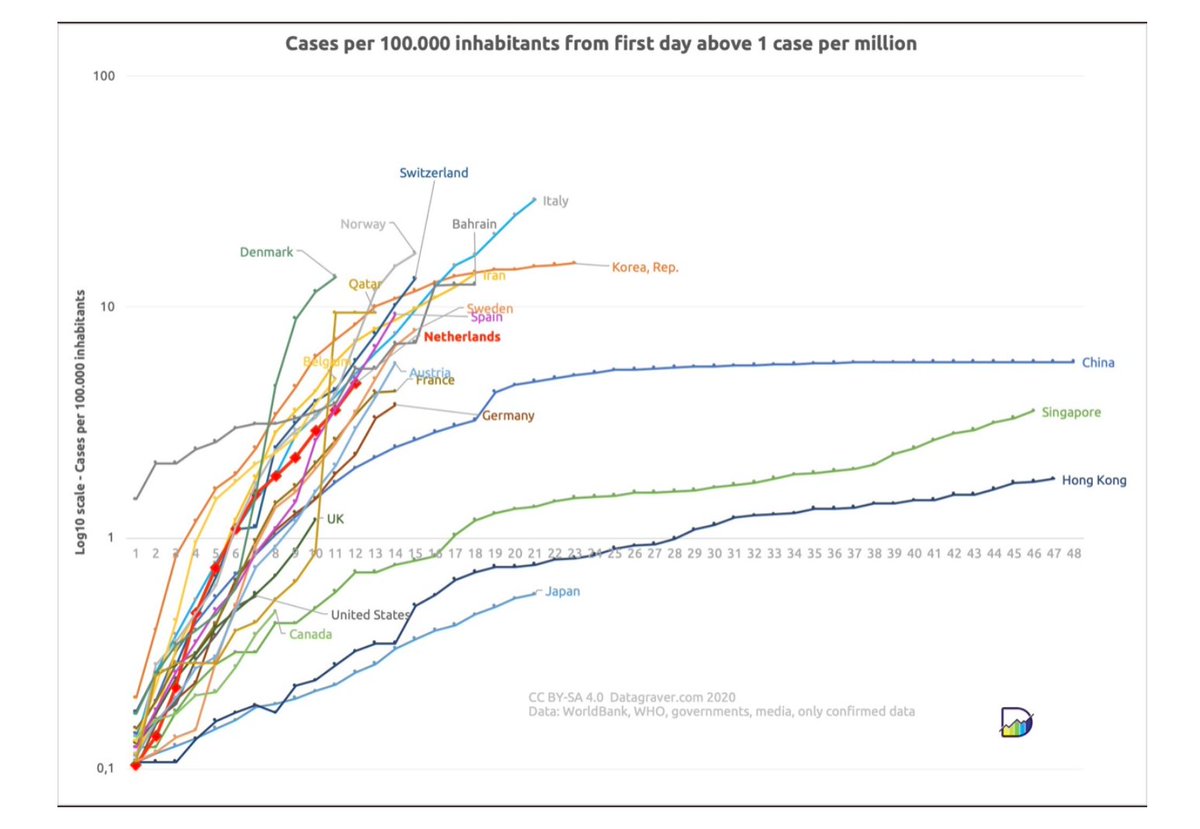 don& #39;t https://abs.twimg.com/emoji/v2/... draggable="false" alt="👏🏻" title="Applaus-Zeichen (heller Hautton)" aria-label="Emoji: Applaus-Zeichen (heller Hautton)"> use https://abs.twimg.com/emoji/v2/... draggable="false" alt="👏🏻" title="Applaus-Zeichen (heller Hautton)" aria-label="Emoji: Applaus-Zeichen (heller Hautton)"> logarithmic https://abs.twimg.com/emoji/v2/... draggable="false" alt="👏🏻" title="Applaus-Zeichen (heller Hautton)" aria-label="Emoji: Applaus-Zeichen (heller Hautton)">scaleshttps://abs.twimg.com/emoji/v2/... draggable="false" alt="👏🏻" title="Applaus-Zeichen (heller Hautton)" aria-label="Emoji: Applaus-Zeichen (heller Hautton)">forhttps://abs.twimg.com/emoji/v2/... draggable="false" alt="👏🏻" title="Applaus-Zeichen (heller Hautton)" aria-label="Emoji: Applaus-Zeichen (heller Hautton)"> lay https://abs.twimg.com/emoji/v2/... draggable="false" alt="👏🏻" title="Applaus-Zeichen (heller Hautton)" aria-label="Emoji: Applaus-Zeichen (heller Hautton)">audiences https://abs.twimg.com/emoji/v2/... draggable="false" alt="👏🏻" title="Applaus-Zeichen (heller Hautton)" aria-label="Emoji: Applaus-Zeichen (heller Hautton)">" title="https://abs.twimg.com/emoji/v2/... draggable="false" alt="👏🏻" title="Applaus-Zeichen (heller Hautton)" aria-label="Emoji: Applaus-Zeichen (heller Hautton)"> don& #39;t https://abs.twimg.com/emoji/v2/... draggable="false" alt="👏🏻" title="Applaus-Zeichen (heller Hautton)" aria-label="Emoji: Applaus-Zeichen (heller Hautton)"> use https://abs.twimg.com/emoji/v2/... draggable="false" alt="👏🏻" title="Applaus-Zeichen (heller Hautton)" aria-label="Emoji: Applaus-Zeichen (heller Hautton)"> logarithmic https://abs.twimg.com/emoji/v2/... draggable="false" alt="👏🏻" title="Applaus-Zeichen (heller Hautton)" aria-label="Emoji: Applaus-Zeichen (heller Hautton)">scaleshttps://abs.twimg.com/emoji/v2/... draggable="false" alt="👏🏻" title="Applaus-Zeichen (heller Hautton)" aria-label="Emoji: Applaus-Zeichen (heller Hautton)">forhttps://abs.twimg.com/emoji/v2/... draggable="false" alt="👏🏻" title="Applaus-Zeichen (heller Hautton)" aria-label="Emoji: Applaus-Zeichen (heller Hautton)"> lay https://abs.twimg.com/emoji/v2/... draggable="false" alt="👏🏻" title="Applaus-Zeichen (heller Hautton)" aria-label="Emoji: Applaus-Zeichen (heller Hautton)">audiences https://abs.twimg.com/emoji/v2/... draggable="false" alt="👏🏻" title="Applaus-Zeichen (heller Hautton)" aria-label="Emoji: Applaus-Zeichen (heller Hautton)">" class="img-responsive" style="max-width:100%;"/>

