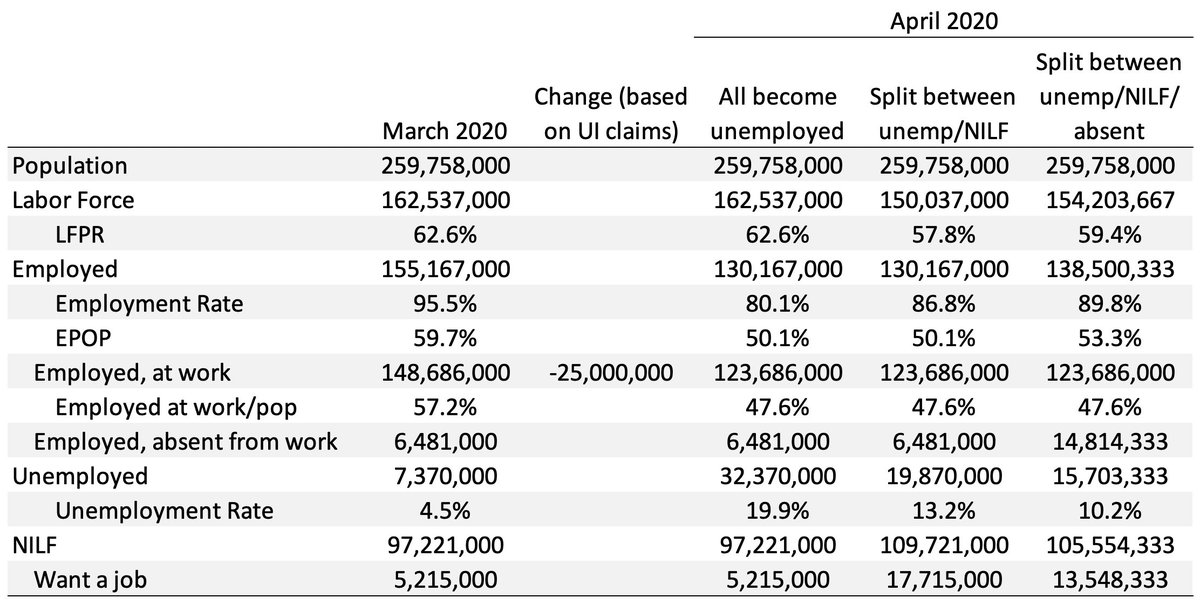
If you are producing or consuming unemployment rate forecasts for April, know that these have to answer both an economic question (how many people stopped working?) and a measurement question (which labor force status are they in now?). Please be careful and clear about both.
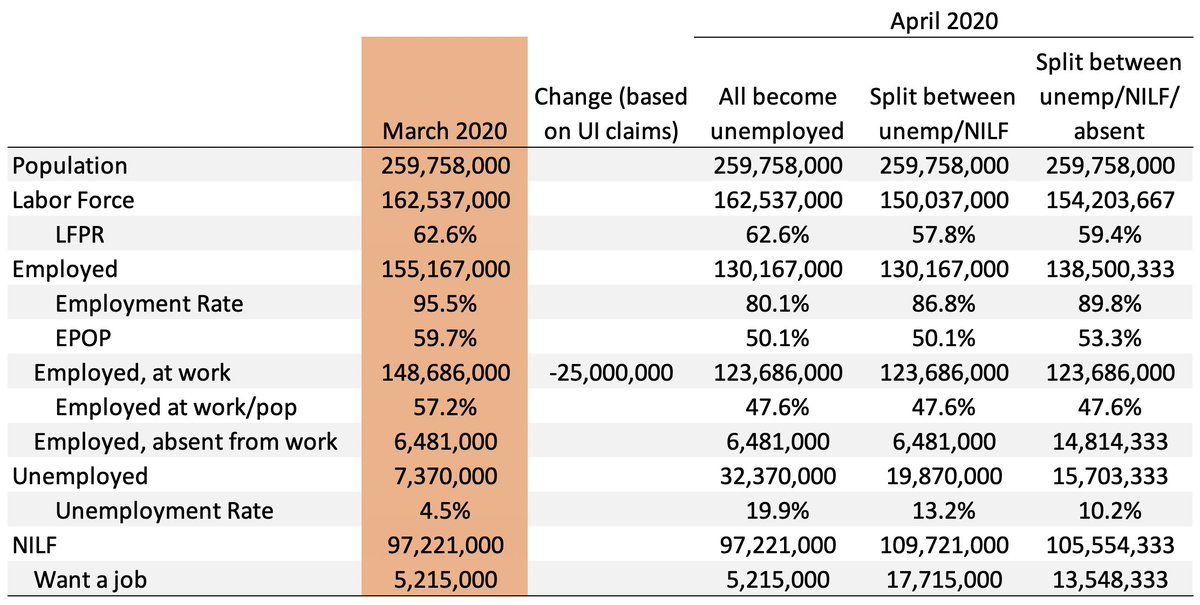
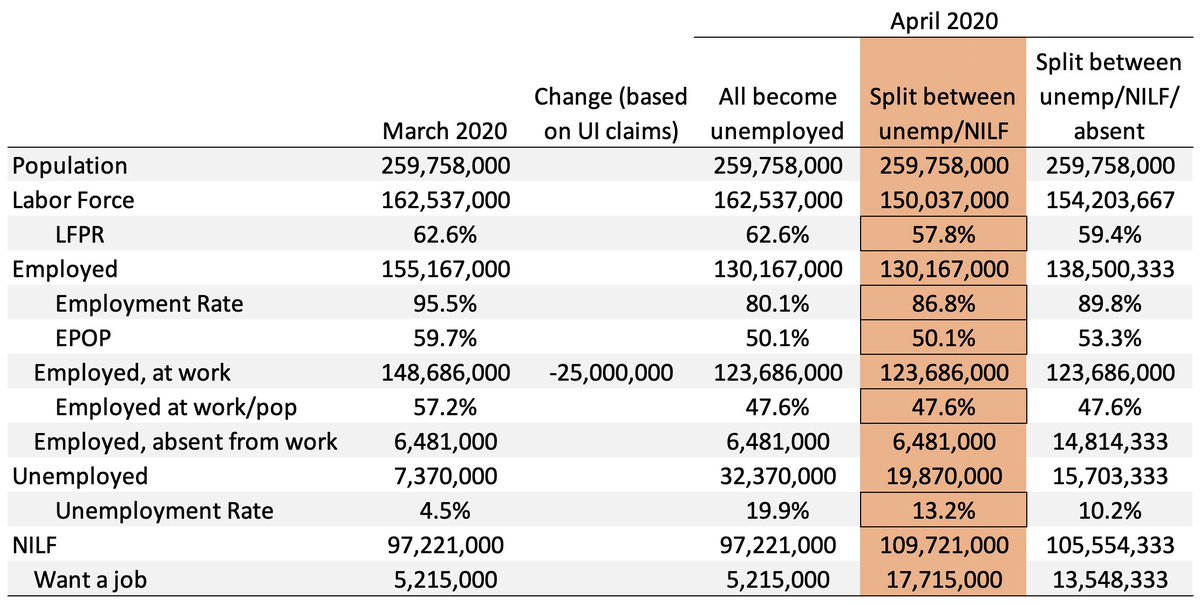
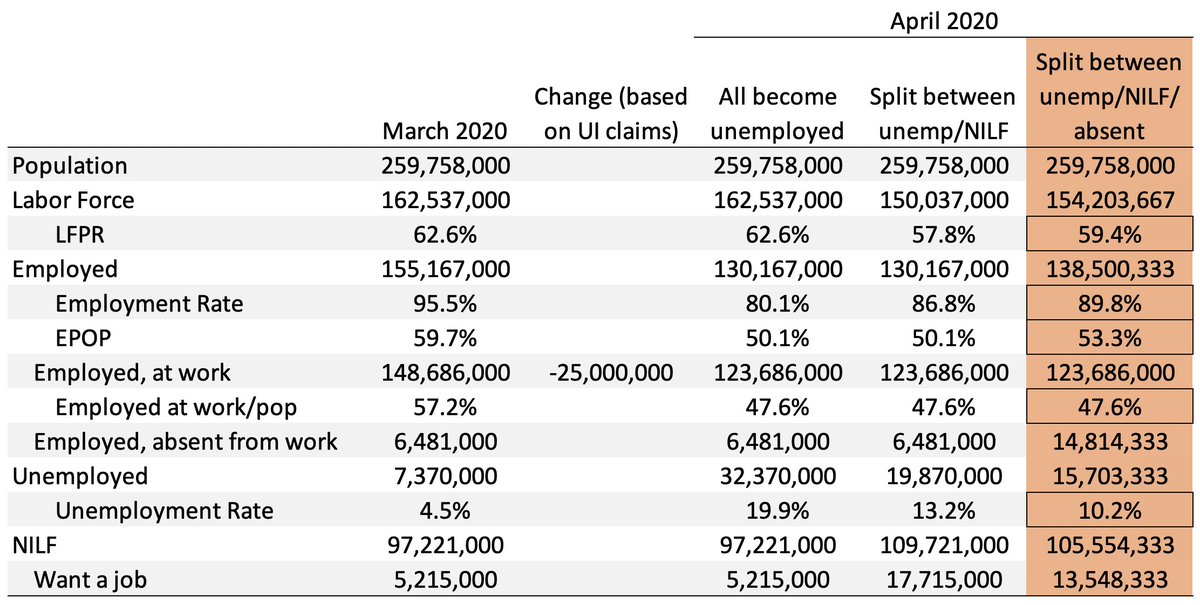
The first column of this table shows what we know about the labor in March These are the not seasonally adjusted numbers from last months jobs report, plus a tabulation I did of employed but absent from work in the public use microdata.
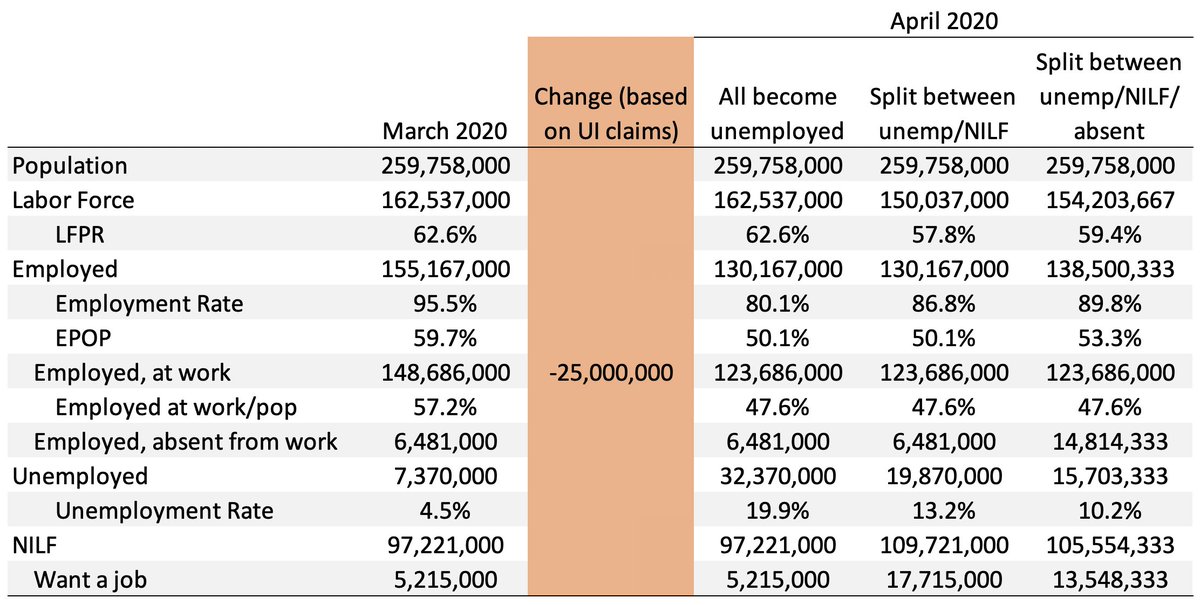
The 2nd col is what we know about how things have changed since then, based on UI claims. We have about 20 million new claims over the last 4 weeks. This week is the reference week for the April CPS, so lets include it and assume about the same number of claims as last week.
A couple more points about this:
1. 25 million is probably an underestimate of the changes so far, since not everyone files for UI immediately. Scale it up if you want, this is just for illustrative purposes.
1. 25 million is probably an underestimate of the changes so far, since not everyone files for UI immediately. Scale it up if you want, this is just for illustrative purposes.
2. We don& #39;t know which category people who stop working go into just from UI claims, just that they aren& #39;t working anymore (this number excludes the type of UI you can get while still working). As such, I& #39;ve taken these people out of "employed, at work" only.
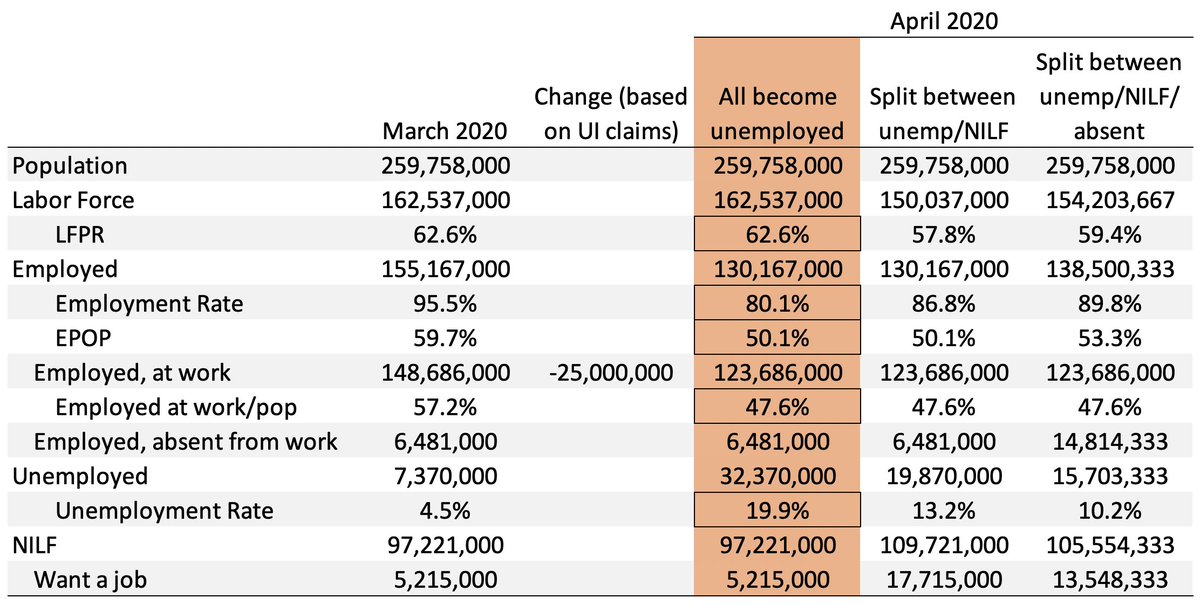
What happens to the unemployment rate depends on what labor force status people who stopped working end up having in April. If you assume they will all show up as unemployed (column 3), the unemployment rate goes up to almost 20% with these numbers.
But this assumption is guaranteed to be wrong. You are unemployed if you 1) are temporarily laid off, or 2) don& #39;t have a job but want one and are available and searching for one. Applying for UI has nothing to do with it, and many people won& #39;t meet these conditions bc of COVID.
Comparing March to February, about half of the reduction in employment showed up as increased unemployment, and about half showed up as reduced labor force participation. Column 4 shows what happens if that holds in April, too: the unemployment rate increases much less, to 13.2%
But even that doesn& #39;t capture all the possibilities. The March increase in unemployment was roughly matched by an increase in people showing up as employed but absent from work due to COVID. These people stopped working, but were still counted as employed.
The people who stopped working between February and March showed up split roughly evenly between unemployed, NILF, and employed but absent. Column 5 shows what happens if that holds again in April: the unemployment rate rises to "only" 10.2%.
Critically, the same number of people have stopped working in all three of these scenarios, but the unemployment rate ends up somewhere between 10% and 20% depending on what assumptions are made about how they respond to the CPS this month. Those assumptions are doing a lot here!
In my view, the thing we have the best chance of forecasting well is the number of people who have stopped working since last month (i.e. employed, at work). We have very little idea how they will be distributed across other statuses in April.
BLS was aware of the "employed, but absent" issue in March (it often happens after major natural disasters), and they issued instructions to surveyors to try to make sure people like this were counted as on temporary layoff (i.e. unemployed). They had only partial success.
Will they have better luck in April? Will people interpret and respond to survey questions the same way they did in March? Or will they think of their situation differently given subsequent events? I have no idea, and I don& #39;t think you do, either.
So forecasting the unemployment rate necessarily involves making assumptions about this that won& #39;t/can& #39;t have much empirical support. That& #39;s fine - do what you gotta do! But please make sure you& #39;re clear about what assumptions go into the forecast you& #39;re producing/consuming.
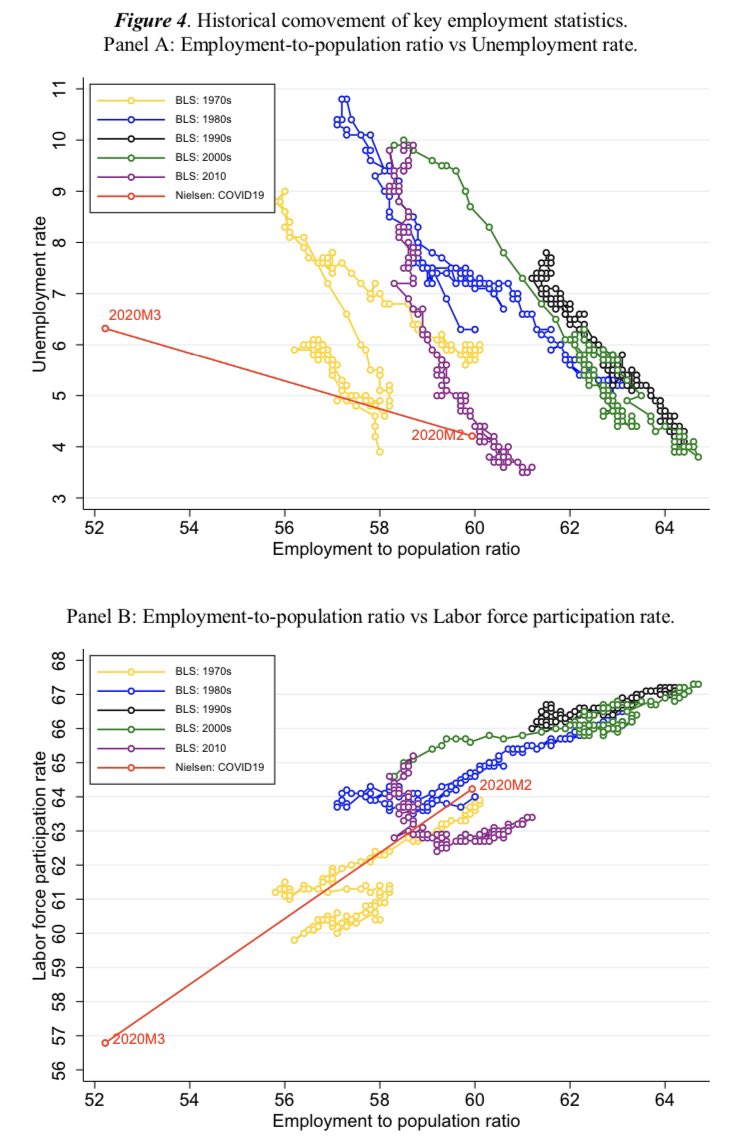
These estimates in the Coibion et al NBER paper out today suggest relatively little movement into unemployment, lots of movement out of the labor force https://www.nber.org/papers/w27017.pdf">https://www.nber.org/papers/w2...
Caveat: this is based on two yes/no questions meant to capture the high-level distinction between unemployment and non-participation, not the same survey instrument as BLS uses for the CPS. Don’t know that I expect this to matter in a specific way, but it’s worth noting.
Thanks to @ElizaForsythe, I now do expect this to matter in a specific way: not counting people on temporary layoff as unemployed will understate flows into unemployment and overstate flows out of the labor force https://twitter.com/ElizaForsythe/status/1252234004067016705?s=20">https://twitter.com/ElizaFors...

 Read on Twitter