Two more days of COVID data wooooo
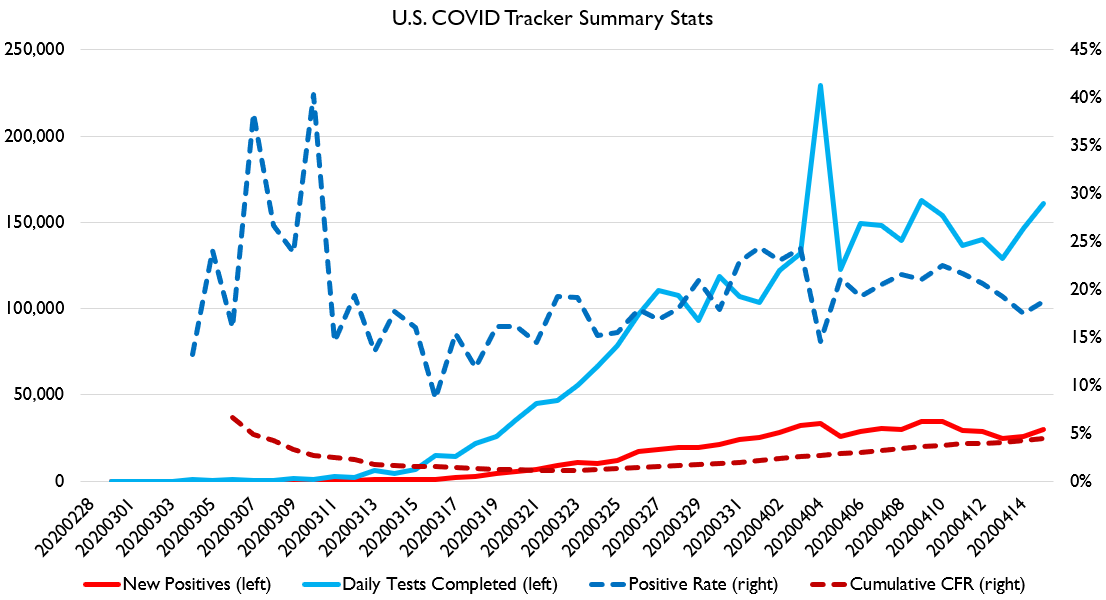
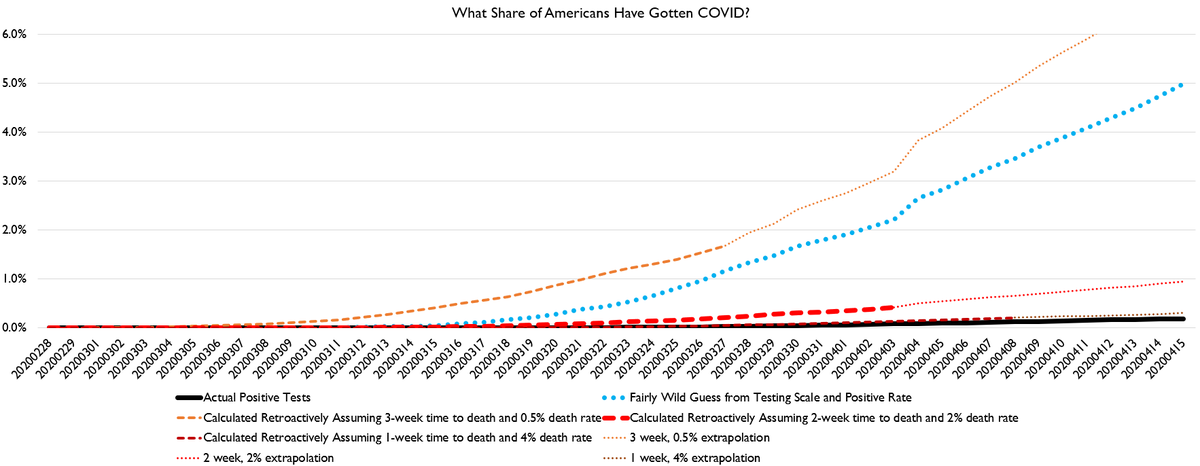
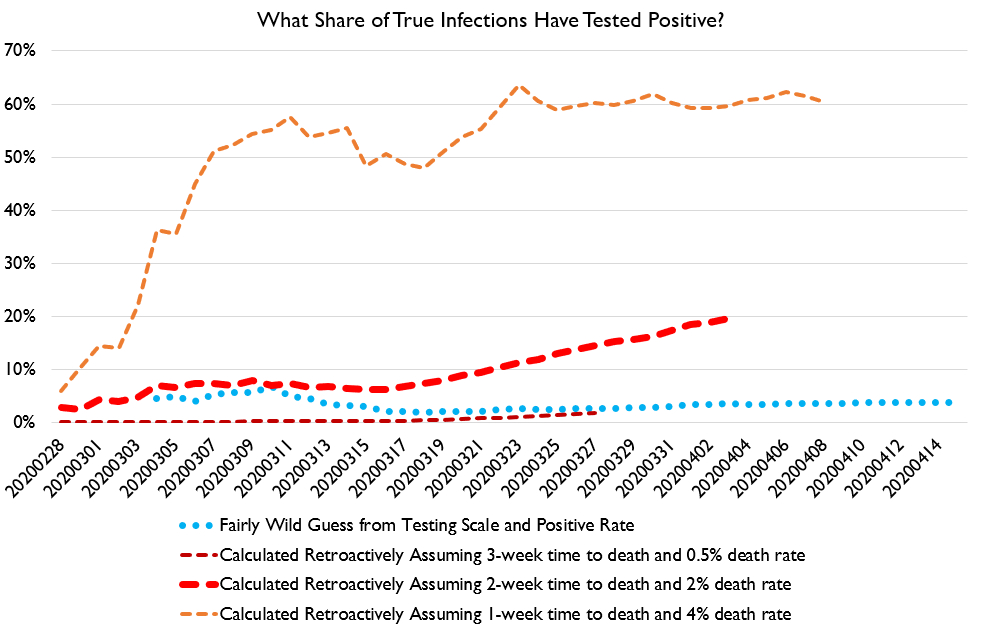
And what it shows is that your nice pretty epidemic charts are Mega Super Dumb. Here& #39;s our basic US chart:
And what it shows is that your nice pretty epidemic charts are Mega Super Dumb. Here& #39;s our basic US chart:
Tests up, positive cases flat, estimated new cases up, CFR up. New case counts aren& #39;t peaking or troughing. They& #39;re just.... going.
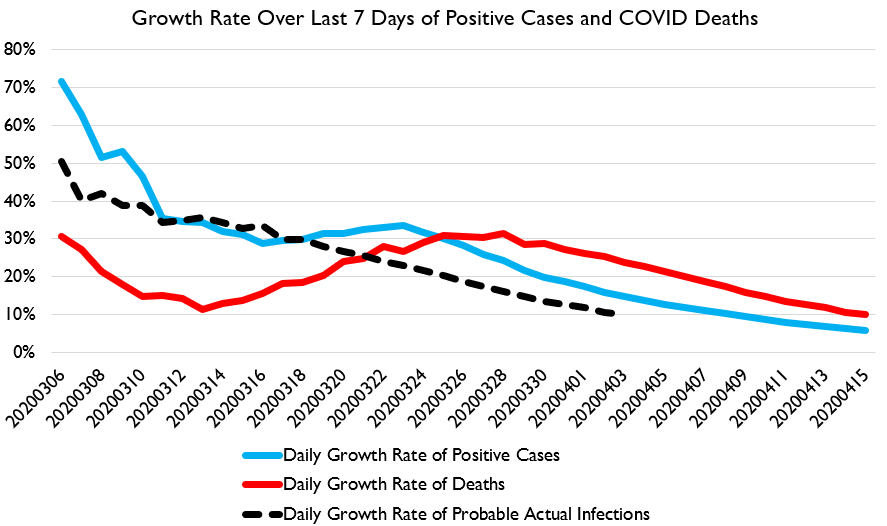
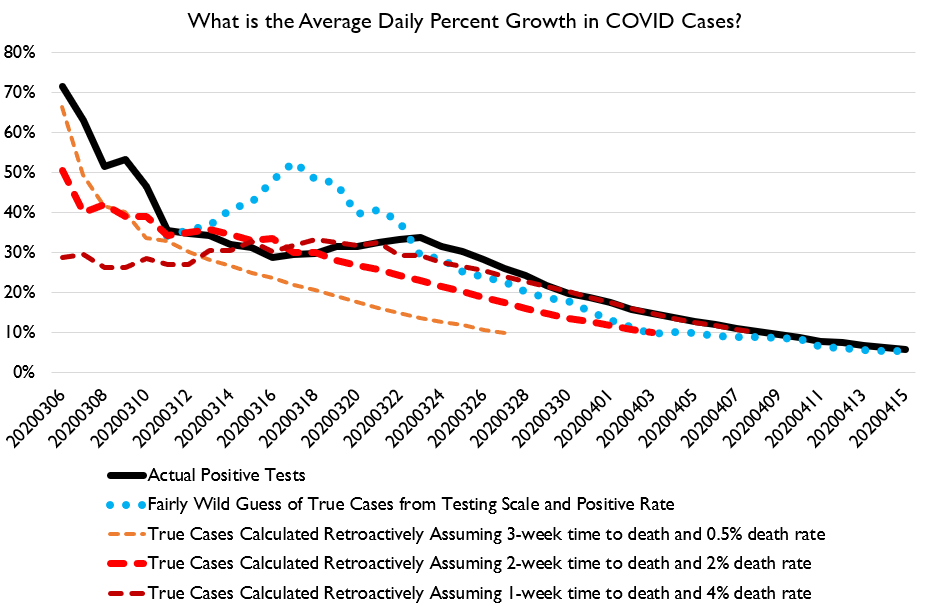
Our curve-flattening graphs show that the curve continues to flatten, however let me note that the decline factor is declining, i.e. we& #39;re seeing a regression towards a >0% daily growth asymptote, consistent with a roughly linear increase in cases and deaths.
Gonna be a solid troll by mother nature if a simple linear model ends up being the best fit.
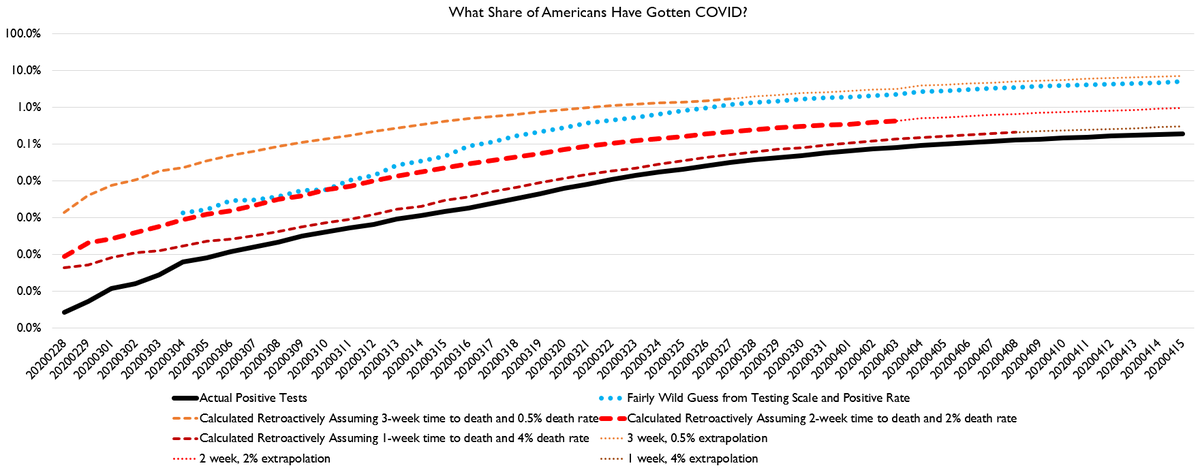
In terms of the population-wide attack rate, looks like it& #39;s somewhere between 0.9% and 6% right now. Obviously, some counties may still be at ~0%, and some counties may be at like 25%. Huge local variation is likely.
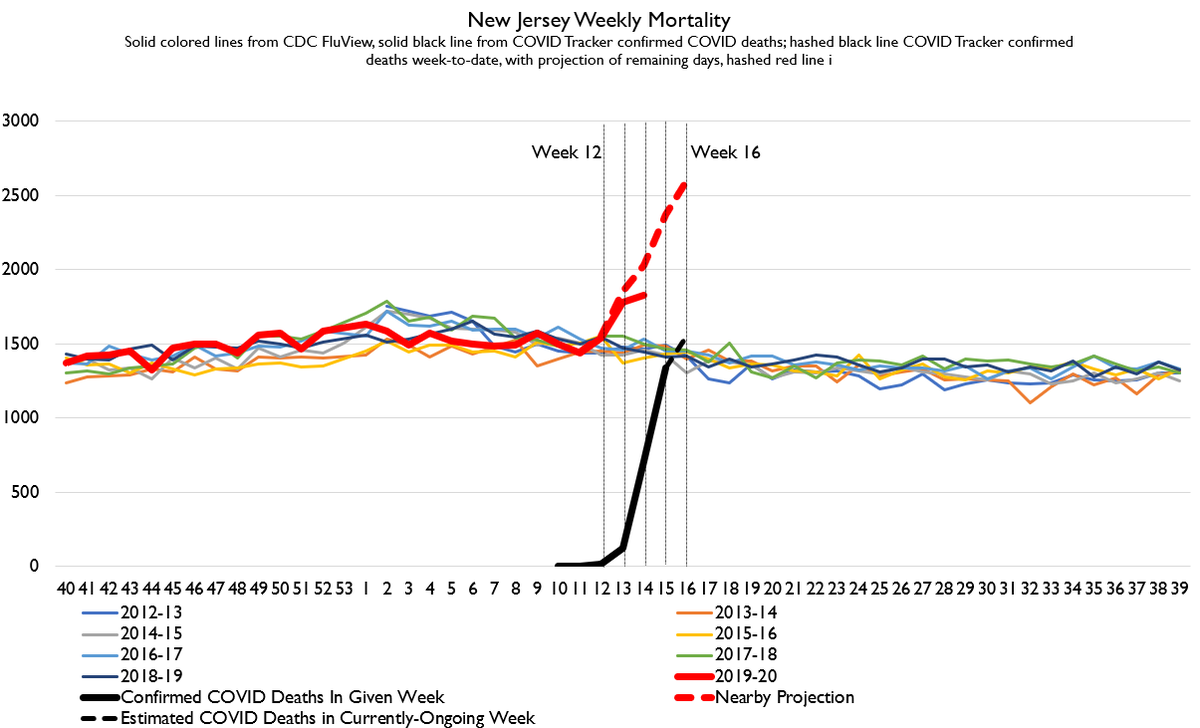
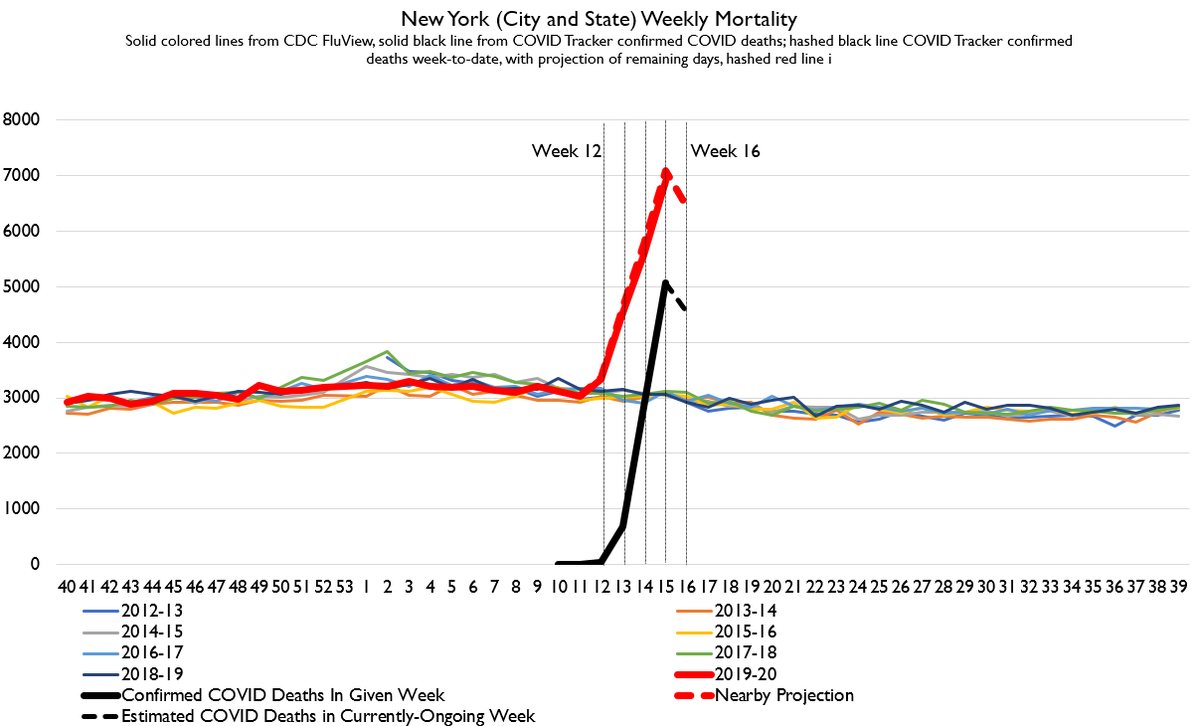
Here& #39;s the latest crude death models I& #39;m running for NY and NJ. Looking very rough still, and latest data updates made things worse, not better. We should get a data update on crude mortality on Friday around noon Eastern I think.
I was hoping that we would have new Hong Kong data on February death figures and another week of sentinel surveillance data by now, but alas we do not, so that& #39;s the update for the day.
Okay, Hong Kong posted their weekly disease surveillance data.
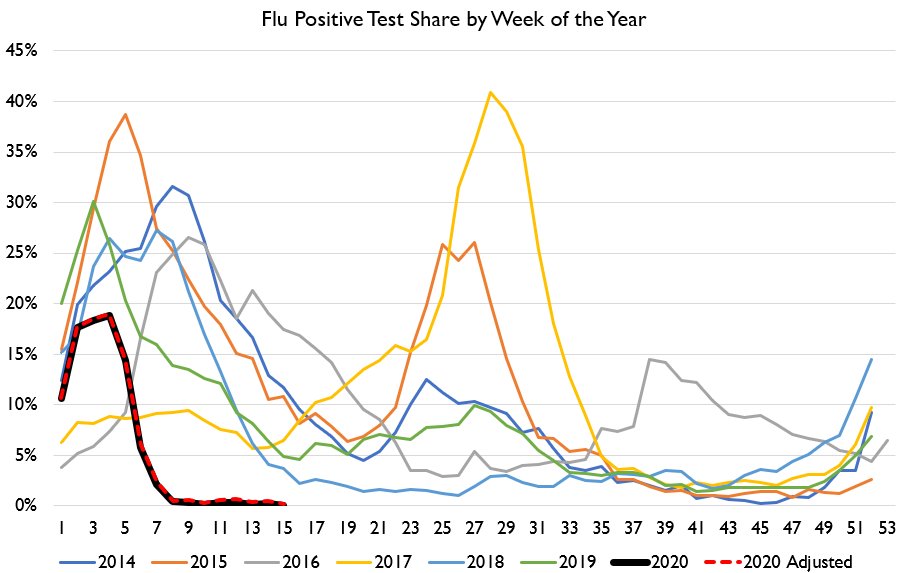
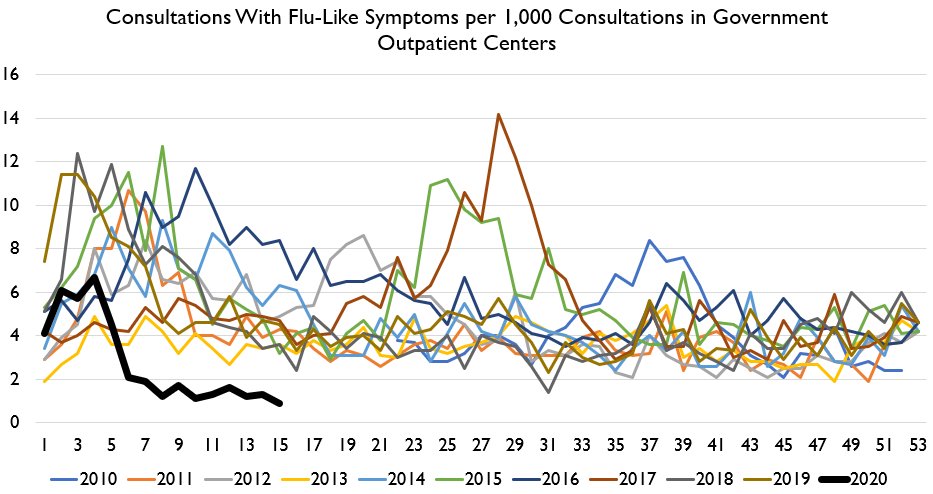
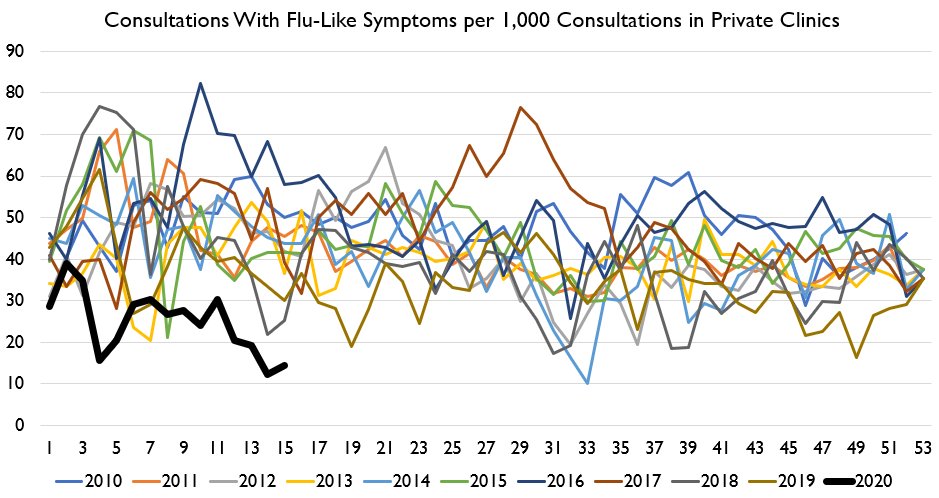
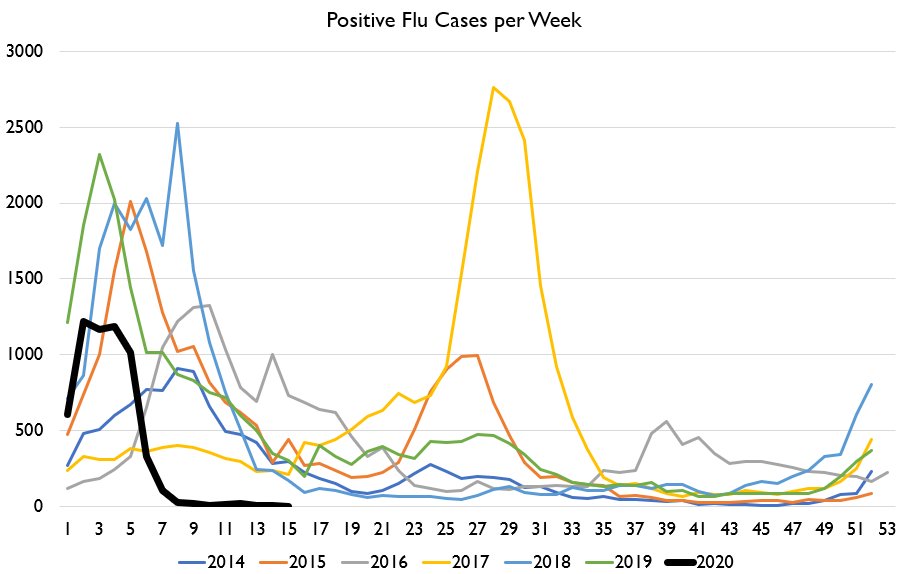
Looks like the flu is down even more, which tbh I didn& #39;t even know was possible. Flu lab tests managed to identify *only one* case of influenza in Hong Kong last week. ILI-symptoms getting rarer by the week.
Looks like the flu is down even more, which tbh I didn& #39;t even know was possible. Flu lab tests managed to identify *only one* case of influenza in Hong Kong last week. ILI-symptoms getting rarer by the week.
Now, granted, flu test volume is way down too. But given the very low rate of ILI symptoms, that probably isn& #39;t because they were avoiding vital testing.
I should note that diagnosed fevers are at unusually low levels in monitored retirement facilities, and also that ILI symptoms are down in emergency room visitors and among Chinese medicine practitioners.
By literally any metric flu- and pneumonia in Hong Kong is being smashed.
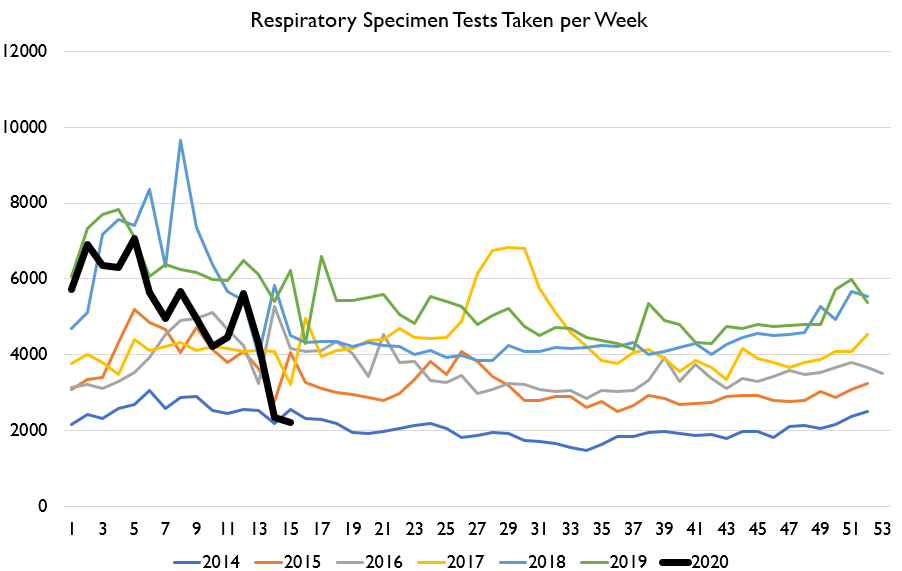
Now unfortunately testing of a lot of other respiratoyr diseases has been suspended to free up capacity for COVID testing. BUT, testing for mycoplasma pneumoniae has continued.
Now unfortunately testing of a lot of other respiratoyr diseases has been suspended to free up capacity for COVID testing. BUT, testing for mycoplasma pneumoniae has continued.
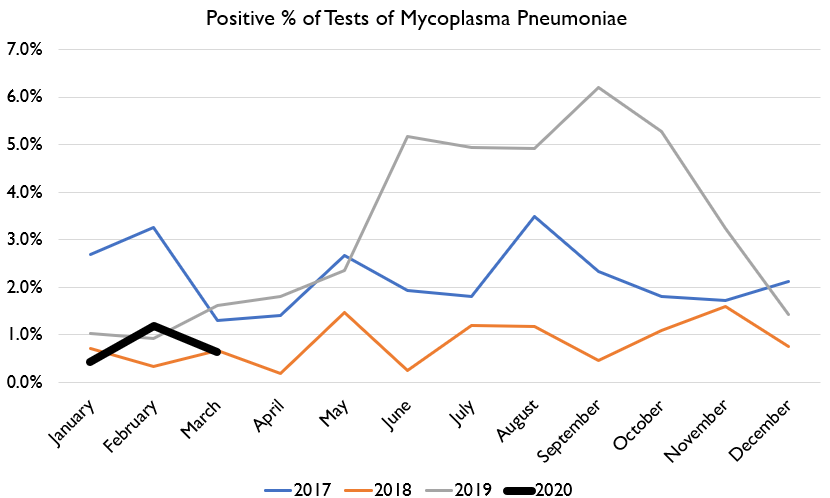
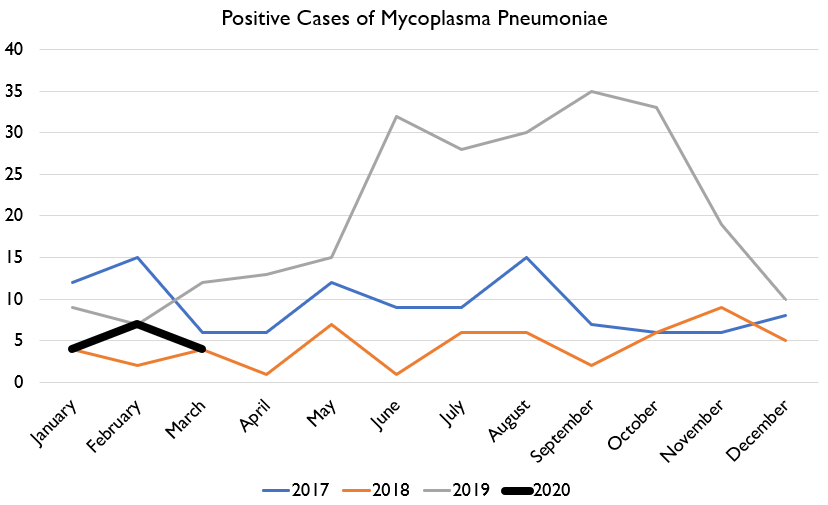
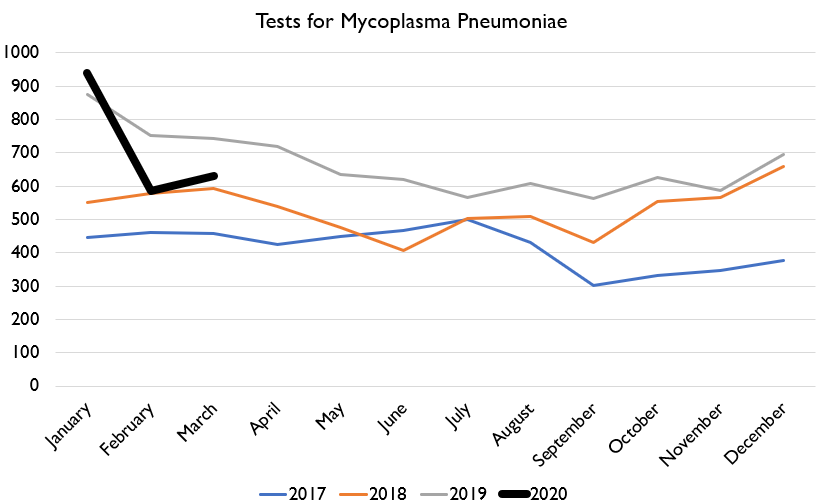
So what do tests for this bacterial pneumonia show?
Tests have been a bit higher than typical, while cases have been a bit lower, such that % of tests coming back positive have come in quite low, despite a large outbreak last year.
Tests have been a bit higher than typical, while cases have been a bit lower, such that % of tests coming back positive have come in quite low, despite a large outbreak last year.
So for this unrelated condition but still spread-through-respiratory-droplets condition, we see quite good health conditions. This is all consistent with a real improvement in the health of Hong Kong people.
Tests for GI and pinkeye still show churn, but recall last week I showed that lab tests for GI stuff showed a big decline in actual confirmable cases. So the % of consultations is probably from a declining base.
It& #39;ll be interesting to see what the next monthly report on notifiable diseases said. February came in really good for HK; will be very encouraging if March does too. Also of course keeping an eye out for February birth/death data.
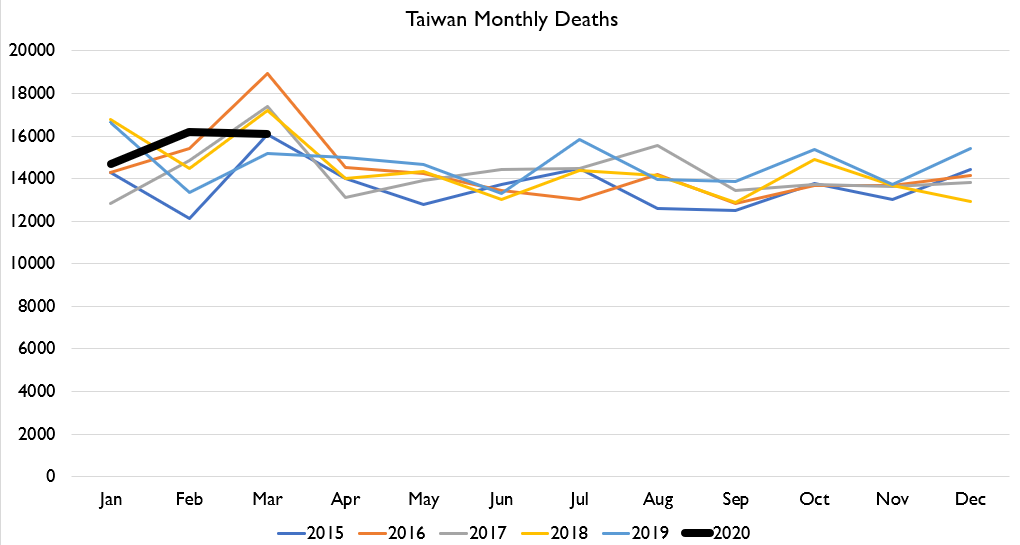
FWIW, here& #39;s Taiwan& #39;s monthly deaths thru March. COmparing 2020 to 2019 is a bit tricky since Chinese New Year timing is a big deal for mortality trends. Nearest recent date for that is 2017, but that was a long time ago death-wise in terms of calculating excess.
So if you assume that the Jan-Jan and Feb-Feb difference between 2017 and 2020 is basically a change in the underlying population but seasonality should be similar due to similar CNY timing, then Taiwan& #39;s March 2020 deaths look QUITE low.

 Read on Twitter