How India is testing? #Covid_19india
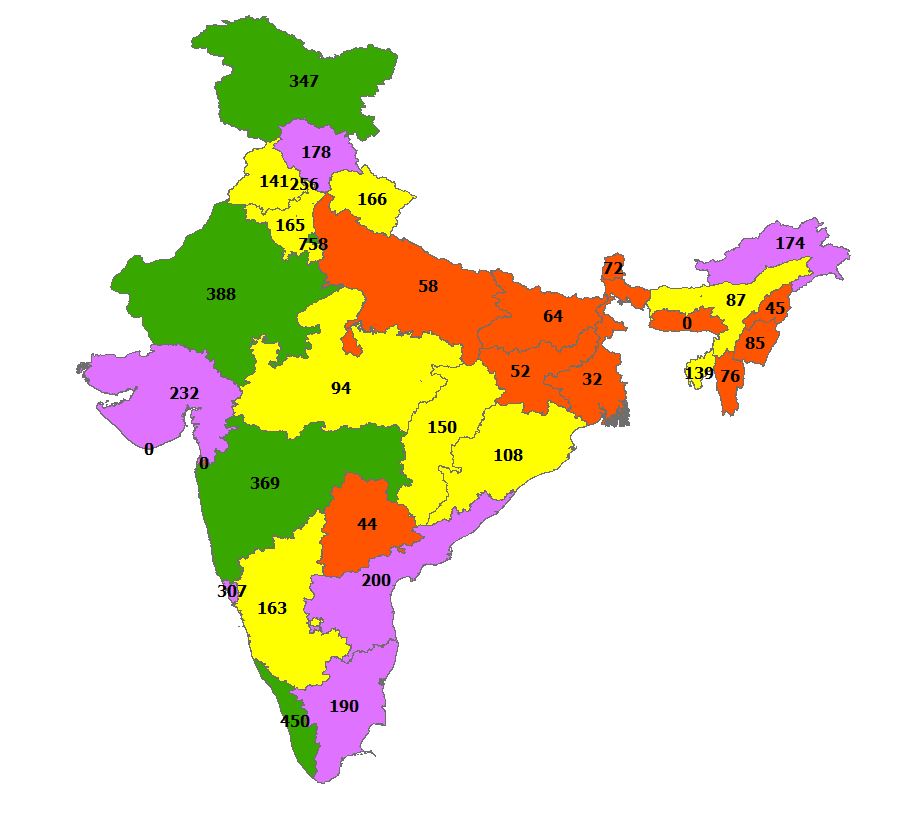
Update as of 14th April on the GIS platform
National average - 170 people per million
RED - 50% below NA
YELLOW - 50% to100% below NA
LILAC - 100% to 200% above NA
GREEN -200% above NA
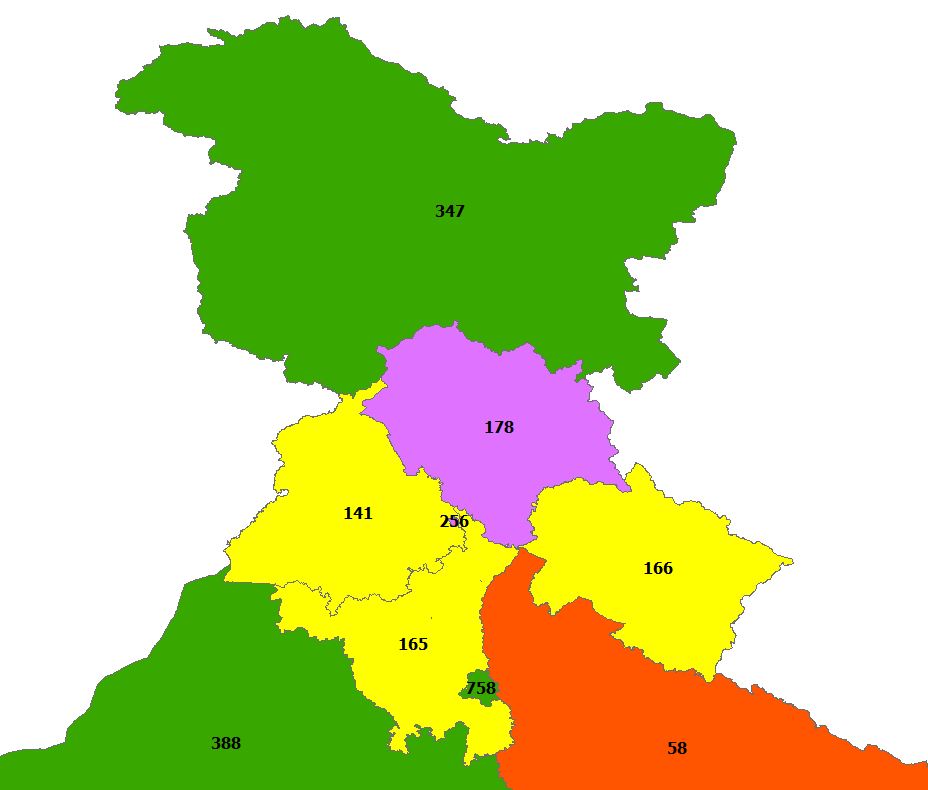
Update as of 14th April on the GIS platform
National average - 170 people per million
RED - 50% below NA
YELLOW - 50% to100% below NA
LILAC - 100% to 200% above NA
GREEN -200% above NA
Look at the top. The value shown there is applicable for J&K.
I did not have a shape file for J&K and Ladak separately. So used J&K value.
No more cumulative testing numbers are coming from Ladak, so I left Ladak for the time being
I did not have a shape file for J&K and Ladak separately. So used J&K value.
No more cumulative testing numbers are coming from Ladak, so I left Ladak for the time being
Also Telengana data is of 26th March. They are not published their testing figures after that.
UP figure belongs to 13/04
UP figure belongs to 13/04
After ages, I tried my hand in my GIS skills, I learnt from National Remote Sensing Centre, ISRO, Hyderabad. That was long back in 2004. After an hour with the software, I tamed the software ;)
I will fine tune this map with adding Ladak, during the next update

 Read on Twitter


