I put together some data on provincial Covid cases/capita as I couldn& #39;t find what I wanted online. There are some surprising results (which I don& #39;t know if people realized or not), but NL was the WORST province in Canada per capita for >2 weeks after the Caul& #39;s cluster (1/8)
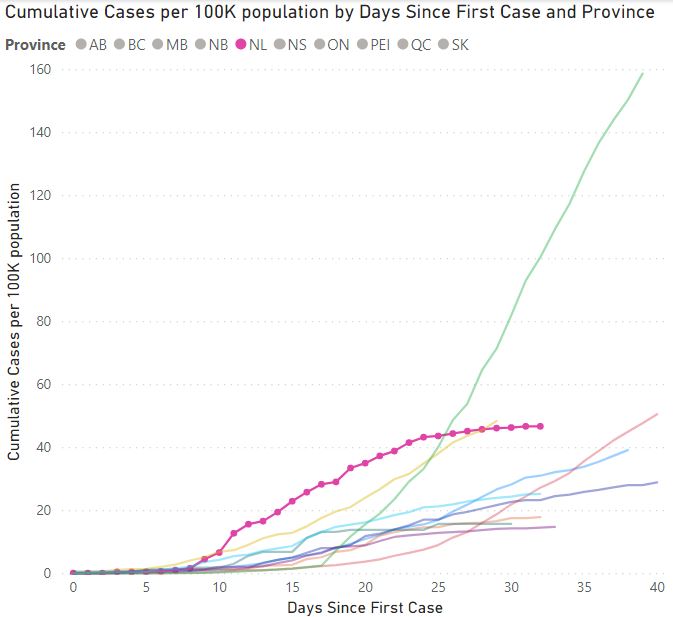
Below is a graph showing the total cases per 100k population. The x axis is showing the days since the first case was discovered for each province. You can see just how bad NL was, singled out in purple (2/8)
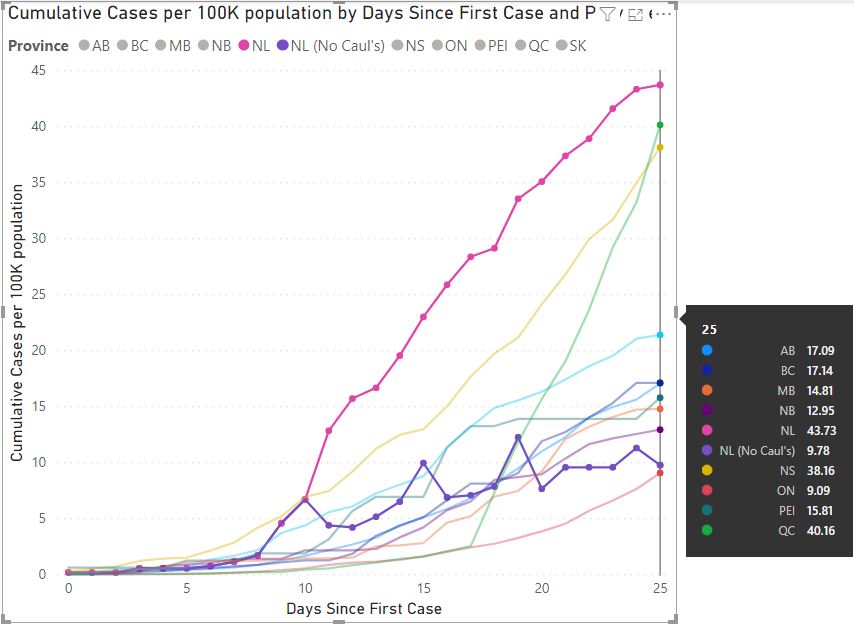
As has been a hot topic for the last month, I wanted to see how we looked without the Caul& #39;s cluster. It ends up swinging our cases/100k from being the second worst province in Canada to having the lowest cases of any province, based on todays data (3/8)
Note the data is a little odd for the & #39;no Caul& #39;s& #39; graph, as the cases/100k goes down with passage of time. This is because when an update is given on the Caul& #39;s cases, I can& #39;t look back in time and classify on which days Caul& #39;s cases were infected. (4/8)
Caul& #39;s is hugely significant. 25 days since first case discovery (April 7th), if we compare NL to all other provinces, Caul& #39;s was the difference between us being the worst in the country at 43.73 cases/100k to the second best at just 9.78 cases/100k. ON was a hair lower (5/8)
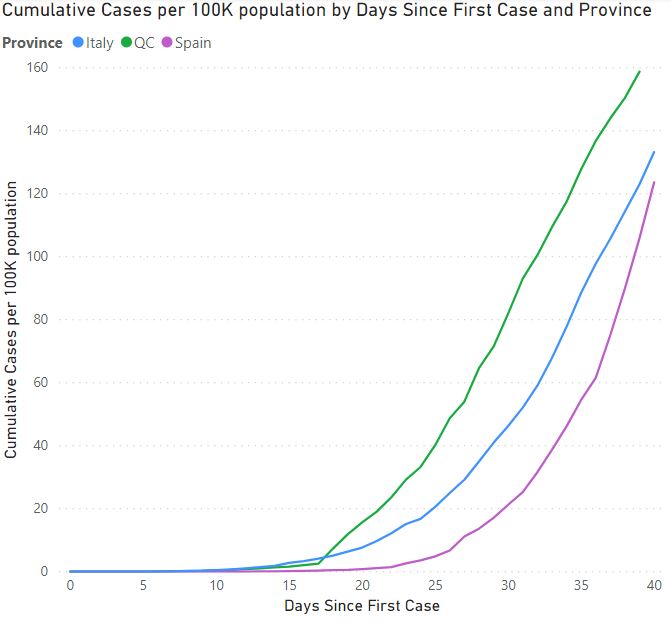
Next, I don& #39;t understand how QC can possibly be talking about relaxing restrictions. Based on the numbers, they are worse than both Spain and Italy, which as we know are getting hammered. QC is essentially a vertical shift of their curves (6/8)
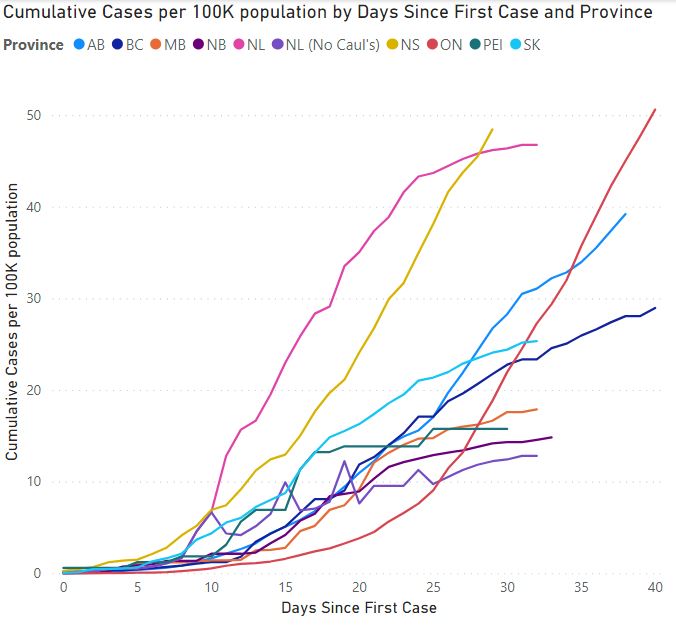
Trimming out QC as they are skewing data, NL was climbing rapidly until the last week. The graph suggests the actions taken are helping. Other provinces that look to be slowing their growth are MB, NB, PEI, SK, while NS, QC, ON measures look to have little effect thus far (7/8)
Tagging a few people that are active on the Covid graphs and in case you are interested!
Below is a link to an intereactive dashboard as well (works best on laptop): https://app.powerbi.com/view?r=eyJrIjoiOTFjZjNhOTctMDRlZi00NGIxLWE4MzctNDMwY2YzZmNlMzk1IiwidCI6IjkwYjc0OTA5LWQzMWItNGY1NC1iOWMzLWQ3MjljOGQ4NGZmMiJ9
https://app.powerbi.com/view... href="https://twitter.com/EddieSheerr">@EddieSheerr @BairdTom @pauldurdle
#covid19 #nlpoli #covid19nfld
(8/8)
Below is a link to an intereactive dashboard as well (works best on laptop): https://app.powerbi.com/view?r=eyJrIjoiOTFjZjNhOTctMDRlZi00NGIxLWE4MzctNDMwY2YzZmNlMzk1IiwidCI6IjkwYjc0OTA5LWQzMWItNGY1NC1iOWMzLWQ3MjljOGQ4NGZmMiJ9
#covid19 #nlpoli #covid19nfld
(8/8)

 Read on Twitter


