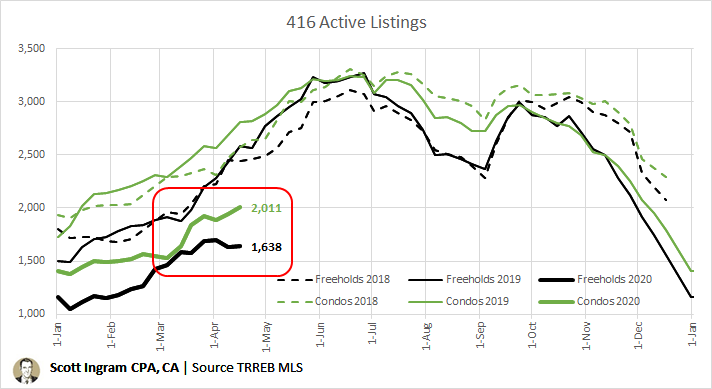
Tuesday: weekly thread looking live at 416 active listings (inventory). Four things to note on first chart:  https://abs.twimg.com/emoji/v2/... draggable="false" alt="👀" title="Eyes" aria-label="Emoji: Eyes">
1) Norm is to rise strongly into June
2) Freeholds have flattened while condos still growing a bit
3) Inventory still low compared to recent years
thread continues... /1
1) Norm is to rise strongly into June
2) Freeholds have flattened while condos still growing a bit
3) Inventory still low compared to recent years
thread continues... /1
Condo inventory got so low in beginning of March was almost same as freehold. Can see diverged since. /2
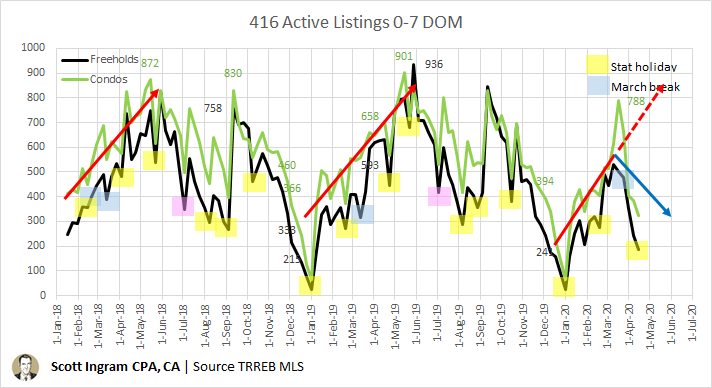
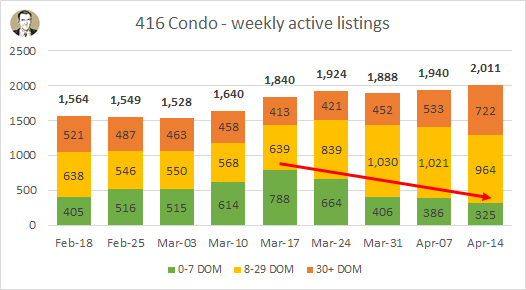
This chart is subset of all active listings that are 1 week or less old. Again can see pattern is to rise slowly into early June. This year the regular pattern diverted last month (blue line) and we& #39;re seeing a lot less new listings. /3
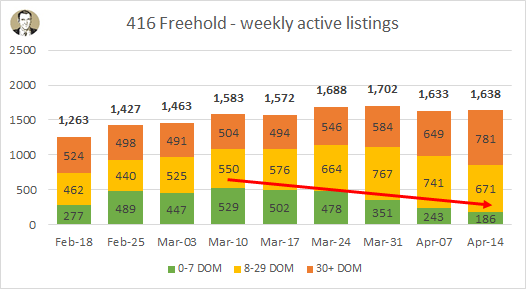
This is 5th week in a row that Freehold "fresh" listings (green) have declined. The other aging bands have grown in this time, especially 30+ days on market (DOM). /4
For 416 Condos it& #39;s the 4th week in a row of less fresh (0-7 DOM) listings. Total condo listings in last 4 weeks are 9.3%, whil https://abs.twimg.com/emoji/v2/... draggable="false" alt="⬆️" title="Upwards arrow" aria-label="Emoji: Upwards arrow">e Freeholds only
  https://abs.twimg.com/emoji/v2/... draggable="false" alt="⬆️" title="Upwards arrow" aria-label="Emoji: Upwards arrow">4.2% in same period. /5
I took my weekly look at 416 sales transactions yesterday. Condos and Freeholds both down about 75% over same week last year. Here& #39;s that thread, ICYMI:
https://twitter.com/areacode416/status/1249732073444777988">https://twitter.com/areacode4... /6
https://twitter.com/areacode416/status/1249732073444777988">https://twitter.com/areacode4... /6
With inventory remaining stable (or slowly  https://abs.twimg.com/emoji/v2/... draggable="false" alt="⬆️" title="Upwards arrow" aria-label="Emoji: Upwards arrow">), and sales
  https://abs.twimg.com/emoji/v2/... draggable="false" alt="⬇️" title="Downwards arrow" aria-label="Emoji: Downwards arrow">, that means months-of-inventory (MOI) is going to rise
 https://abs.twimg.com/emoji/v2/... draggable="false" alt="⬆️" title="Upwards arrow" aria-label="Emoji: Upwards arrow">. [MOI = Active listings / sales]
It represents number of moths would take to sell current inventory at current pace of sales. /7
It represents number of moths would take to sell current inventory at current pace of sales. /7
If demand strong relative to supply you have a tight market and inventory sells quickly (seller& #39;s market). That& #39;s when you see a lot of bidding wars and high YoY price growth. If lots of supply and/or slow sales then inventory is turning over slowly (buyer& #39;s market). /8
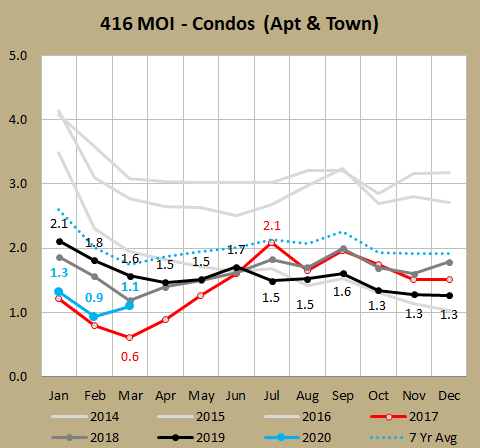
Let& #39;s look back at 2017 (red line). Remember how wild the first few months of the year were? See MOI got as low as 0.6 in March? That& #39;s not just a seller& #39;s market - that& #39;s an EXTREME seller& #39;s market. Then April had gov& #39;t measures that cooled the market and you see MOI rising. /9
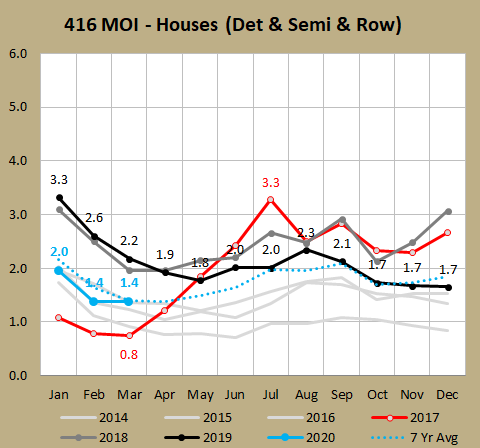
In March with that 0.6 MOI average condo prices were  https://abs.twimg.com/emoji/v2/... draggable="false" alt="⬆️" title="Upwards arrow" aria-label="Emoji: Upwards arrow">31% YoY. Here& #39;s a look at freehold MOI. It got down to 0.8 MOI, extremely low. March avg freehold prices were
  https://abs.twimg.com/emoji/v2/... draggable="false" alt="⬆️" title="Upwards arrow" aria-label="Emoji: Upwards arrow">33% YoY. See how when the market cooled starting in April that MOI rose to 3.3 in July? /10
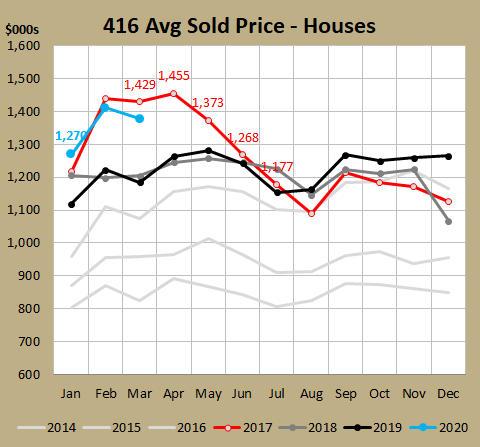
Well notice that prices went the OPPOSITE direction, i.e. as MOI rose, average prices fell. (Note average - not everyone& #39;s home fell by that amount, a lot has to do with mix of sales which went towards cheaper stuff.) /11
And even though a lot of people (I& #39;d say most) think that a "balanced market" (i.e. doesn& #39;t favour buyers or sellers) is in the 4-6 month range, prices clearly  https://abs.twimg.com/emoji/v2/... draggable="false" alt="⬇️" title="Downwards arrow" aria-label="Emoji: Downwards arrow"> even though MOI only rose as high as 3.3, which is still technically in seller& #39;s territory. /12
I think not just ABSOLUTE NUMBER you have to watch, but also the DIRECTION the MOI number is heading and HOW QUICKLY it& #39;s moving. 2017 moved quickly. /13
So what?  https://abs.twimg.com/emoji/v2/... draggable="false" alt="👉" title="Right pointing backhand index" aria-label="Emoji: Right pointing backhand index">Well MOI is on the rise again is so what (due to listings staying same but sales falling quickly).
Freehold MOI: Feb 1.4, Mar 1.4, today https://abs.twimg.com/emoji/v2/... draggable="false" alt="2⃣" title="Keycap digit two" aria-label="Emoji: Keycap digit two">.
 https://abs.twimg.com/emoji/v2/... draggable="false" alt="5⃣" title="Keycap digit five" aria-label="Emoji: Keycap digit five">
Condo MOI: Feb 0.9, Mar 1.1, today https://abs.twimg.com/emoji/v2/... draggable="false" alt="2⃣" title="Keycap digit two" aria-label="Emoji: Keycap digit two">.
 https://abs.twimg.com/emoji/v2/... draggable="false" alt="1⃣" title="Keycap digit one" aria-label="Emoji: Keycap digit one">
Condos have been below 2.000 in 47 of last 49 months so that& #39;s a big change. /14
Freehold MOI: Feb 1.4, Mar 1.4, today
Condo MOI: Feb 0.9, Mar 1.1, today
Condos have been below 2.000 in 47 of last 49 months so that& #39;s a big change. /14
So keep your  https://abs.twimg.com/emoji/v2/... draggable="false" alt="👀" title="Eyes" aria-label="Emoji: Eyes"> out for that
  https://abs.twimg.com/emoji/v2/... draggable="false" alt="⬆️" title="Upwards arrow" aria-label="Emoji: Upwards arrow"> in MOI in the final April stats (might end up something like 2.8 and 2.4). And keep an eye on average prices. /15

 Read on Twitter
 1) Norm is to rise strongly into June2) Freeholds have flattened while condos still growing a bit3) Inventory still low compared to recent yearsthread continues... /1" title="Tuesday: weekly thread looking live at 416 active listings (inventory). Four things to note on first chart: https://abs.twimg.com/emoji/v2/... draggable="false" alt="👀" title="Eyes" aria-label="Emoji: Eyes">1) Norm is to rise strongly into June2) Freeholds have flattened while condos still growing a bit3) Inventory still low compared to recent yearsthread continues... /1" class="img-responsive" style="max-width:100%;"/>
 e Freeholds only https://abs.twimg.com/emoji/v2/... draggable="false" alt="⬆️" title="Upwards arrow" aria-label="Emoji: Upwards arrow">4.2% in same period. /5" title="For 416 Condos it& #39;s the 4th week in a row of less fresh (0-7 DOM) listings. Total condo listings in last 4 weeks are 9.3%, whilhttps://abs.twimg.com/emoji/v2/... draggable="false" alt="⬆️" title="Upwards arrow" aria-label="Emoji: Upwards arrow">e Freeholds only https://abs.twimg.com/emoji/v2/... draggable="false" alt="⬆️" title="Upwards arrow" aria-label="Emoji: Upwards arrow">4.2% in same period. /5" class="img-responsive" style="max-width:100%;"/>
 31% YoY. Here& #39;s a look at freehold MOI. It got down to 0.8 MOI, extremely low. March avg freehold prices were https://abs.twimg.com/emoji/v2/... draggable="false" alt="⬆️" title="Upwards arrow" aria-label="Emoji: Upwards arrow">33% YoY. See how when the market cooled starting in April that MOI rose to 3.3 in July? /10" title="In March with that 0.6 MOI average condo prices were https://abs.twimg.com/emoji/v2/... draggable="false" alt="⬆️" title="Upwards arrow" aria-label="Emoji: Upwards arrow">31% YoY. Here& #39;s a look at freehold MOI. It got down to 0.8 MOI, extremely low. March avg freehold prices were https://abs.twimg.com/emoji/v2/... draggable="false" alt="⬆️" title="Upwards arrow" aria-label="Emoji: Upwards arrow">33% YoY. See how when the market cooled starting in April that MOI rose to 3.3 in July? /10" class="img-responsive" style="max-width:100%;"/>
