Carbon cycle feedbacks are a large – but under-appreciated – source of uncertainty the future climate. Including these uncertainties could result in up to 25% more warming than in the main IPCC projections, as @richardabetts and I explore at @CarbonBrief https://www.carbonbrief.org/analysis-how-carbon-cycle-feedbacks-could-make-global-warming-worse">https://www.carbonbrief.org/analysis-...
The main IPCC warming projections currently include a best-estimate of carbon cycle feedbacks, but do not include the large uncertainties in this estimate. Two separate experiments – C4MIP and the PPE – try and estimate the range of possible feedbacks. 2/13
This figure shows possible CO2 concentrations that might occur under each RCP. Bars represent the range of estimates, while each individual model is represented by a dot. Standard RCP concentrations for 2100, as used in IPCC AR5, are shown by horizontal black lines. 3/13
While the average of the carbon cycle feedback estimates is reasonably close to the standard RCP concentrations, there are some much higher possible concentration outcomes under the same emissions scenario of carbon cycle feedbacks are on the high end of the range. 4/13
For example, under the highest available carbon-cycle feedback estimate in the literature a "current policies"-type RCP6.0-related emissions scenario could result in 2100 atmospheric CO2 concentrations equal to those in the RCP8.5 concentration scenario. 5/13
Its worth emphasizing that the highest-end carbon cycle feedback estimates are not particularly likely – but the uncertainties introduced by carbon cycle feedbacks should be taken into account in assessing climate risk associated with various emissions scenarios. 6/13
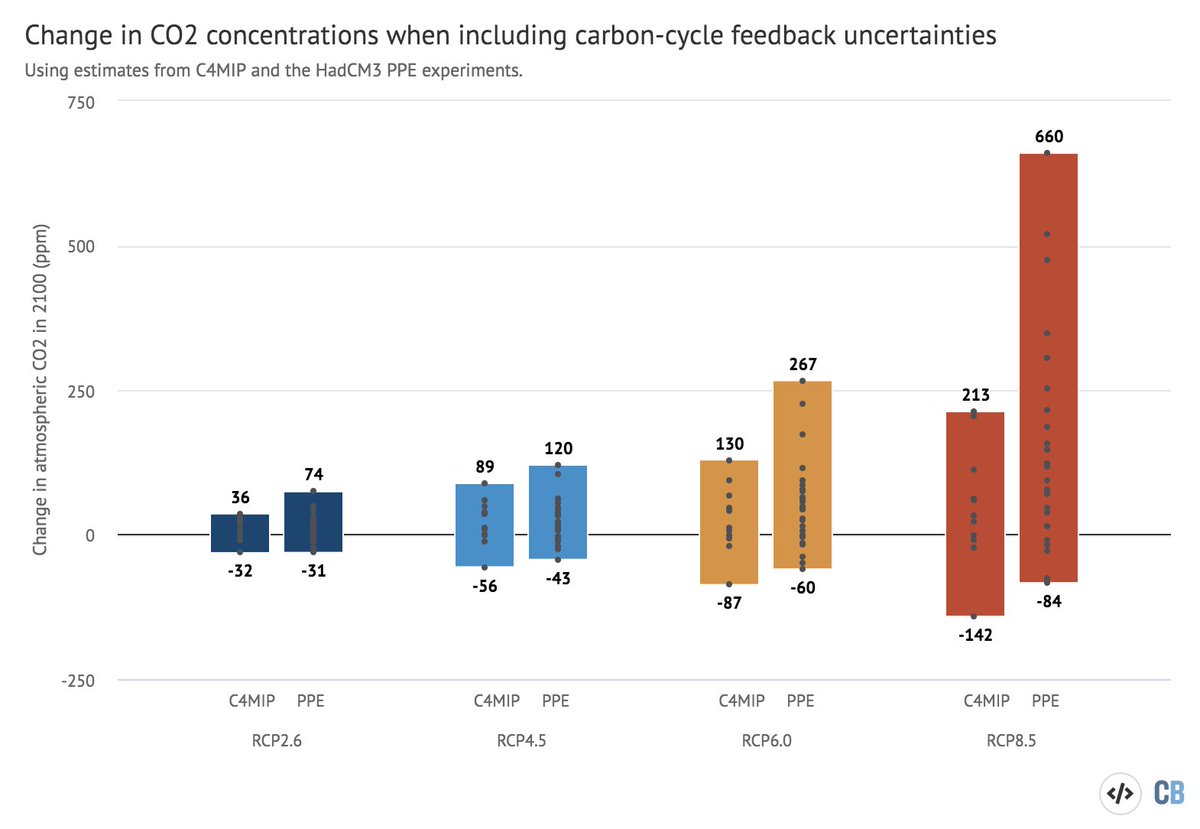
Here is another way of looking at the impact of carbon cycle feedbacks on CO2 concentrations: this figure shows the difference from standard concentration-driven RCP runs in 2100 (rather than total 2100 CO2 concentrations). 7/13
Here we see that including carbon cycle feedback uncertainties would have a modest impact on RCP2.6 – leading to -32 to +74 PPM by 2100 – but a much larger impact on the higher-end emission scenarios. In RCP8.5 it could increase CO2 by 660 PPM in the singly highest estimate! 8/13
We can also examine how these carbon cycle feedback uncertainties impact the standard IPCC future warming projections. To do this we simulated what would happen to each of the CMIP5 models using all of the different carbon cycle feedback estimates in C4MIP and the PPE. 9/13
The first bar in this figure shows the standard CMIP5 runs (with each black dot representing a model). The second bar is all CMIP5 models simulated with all C4MIP carbon cycle feedback estimates. The bar is CMIP5 models with all PPE feedback estimates. 10/13
The average estimated future warming when carbon cycle feedbacks are included is not changes much. Similarly, the lower end of the range of possible future warming only declines modestly. However, the high-end increases quite a bit – around 25% more than in IPCC projections 11/13
One takeaway is that carbon cycle feedback uncertainties are important in assessing future warming, and they should be included more prominently in future assessments of warming projections rather than simply using a single best-estimate. 12/13
There are also drivers of carbon cycle feedbacks still not included in (some) models. Some of these like permafrost melt will contribute to higher CO2, while others like nitrogen cycle changes will reduce CO2. This is an important area for more scientific research. 13/13
It is even possible that carbon-cycle feedbacks could allow a more moderate emissions scenario – such as that associated with RCP6.0 – to reach concentrations found in the very-high-end RCP8.5 scenario, but only in the highest of all available carbon-cycle feedback estimates. 14/
More broadly, this provides yet another reason for policymakers to support ambitious mitigation pathways, as the possibility of very-high warming outcomes may be underestimated in many assessments that do not currently account for carbon cycle feedback uncertainties. 15/

 Read on Twitter


