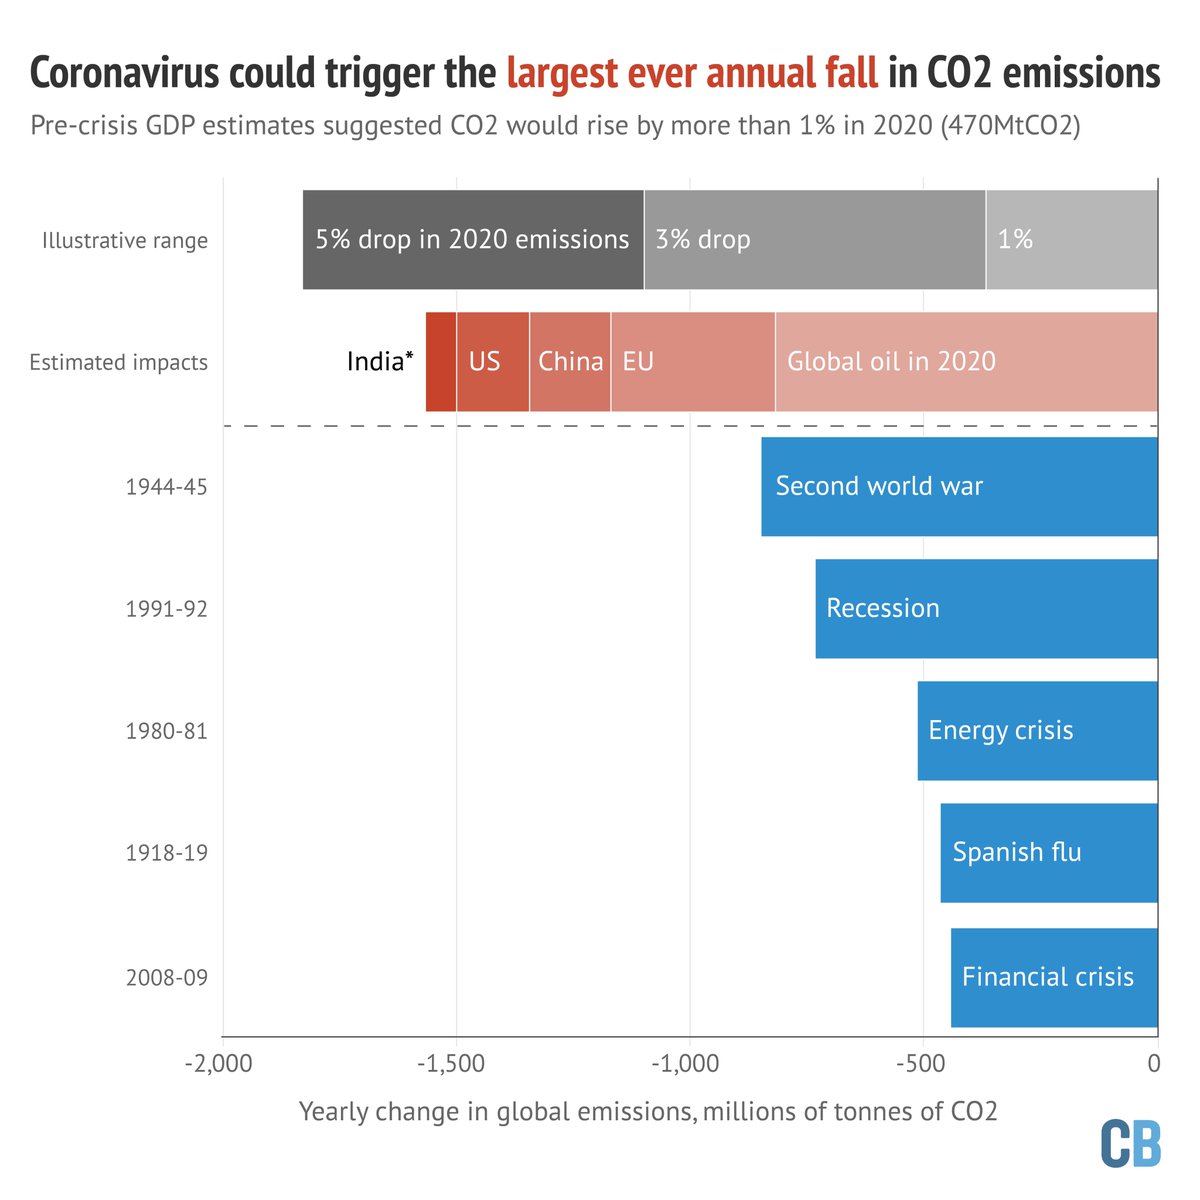
My analysis: #coronavirus likely to cause **largest ever** fall in global CO2 emissions in 2020
At ~1,600MtCO2 (~4%) wld be >> WWII, financial crisis…
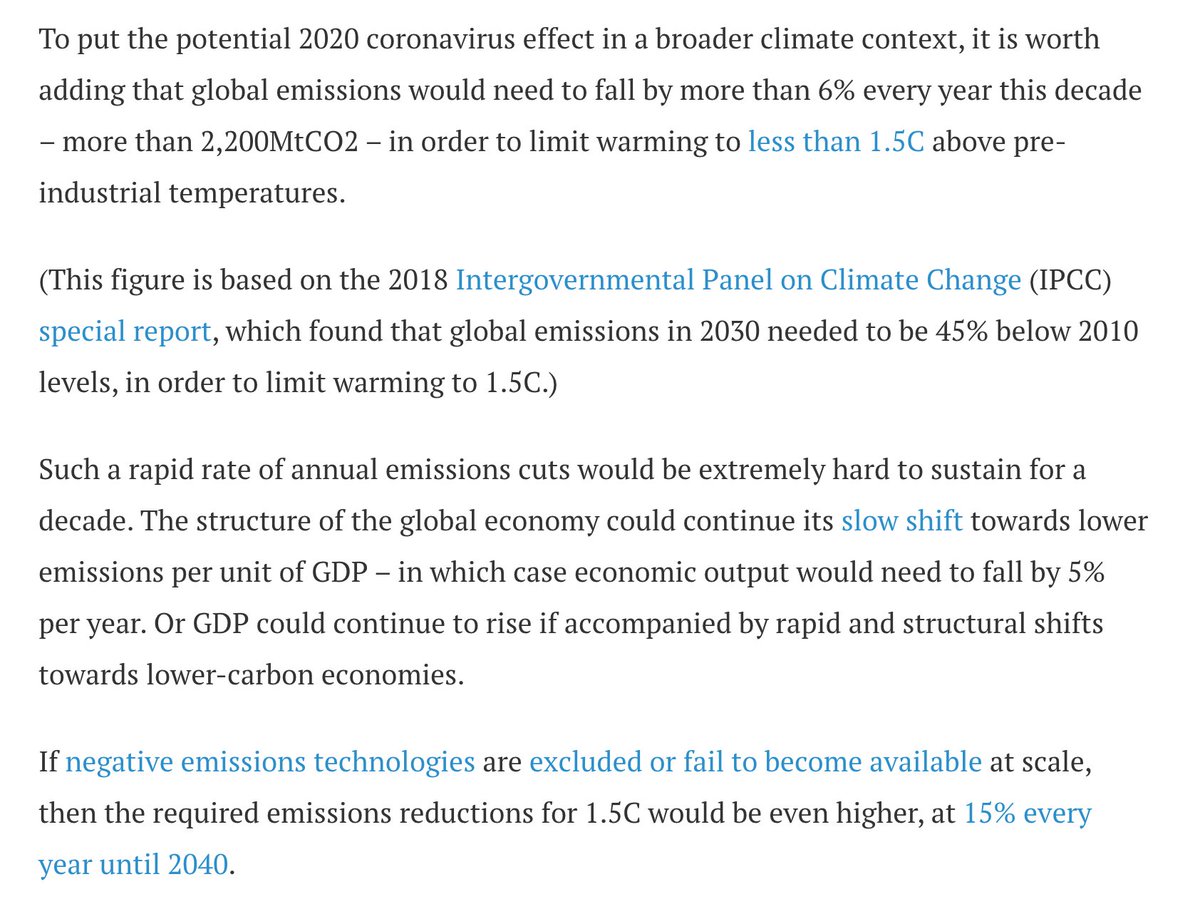
…but even more wld be needed for 1.5C
AND it& #39;d have 2b repeated every yr – not just one-off
THREAD
https://www.carbonbrief.org/analysis-coronavirus-set-to-cause-largest-ever-annual-fall-in-co2-emissions">https://www.carbonbrief.org/analysis-...
First, really impt to stress that looking at CO2 impact of #coronavirus is not the same as celebrating.
Almost everyone& #39;s affected by this terrible pandemic, in small ways & large, via friends, loved ones or only as a result of lockdown restrictions. https://www.carbonbrief.org/analysis-coronavirus-set-to-cause-largest-ever-annual-fall-in-co2-emissions">https://www.carbonbrief.org/analysis-...
Almost everyone& #39;s affected by this terrible pandemic, in small ways & large, via friends, loved ones or only as a result of lockdown restrictions. https://www.carbonbrief.org/analysis-coronavirus-set-to-cause-largest-ever-annual-fall-in-co2-emissions">https://www.carbonbrief.org/analysis-...
Second, #coronavirus is unprecdented. Things are changing fast & hard data is pretty sparse.
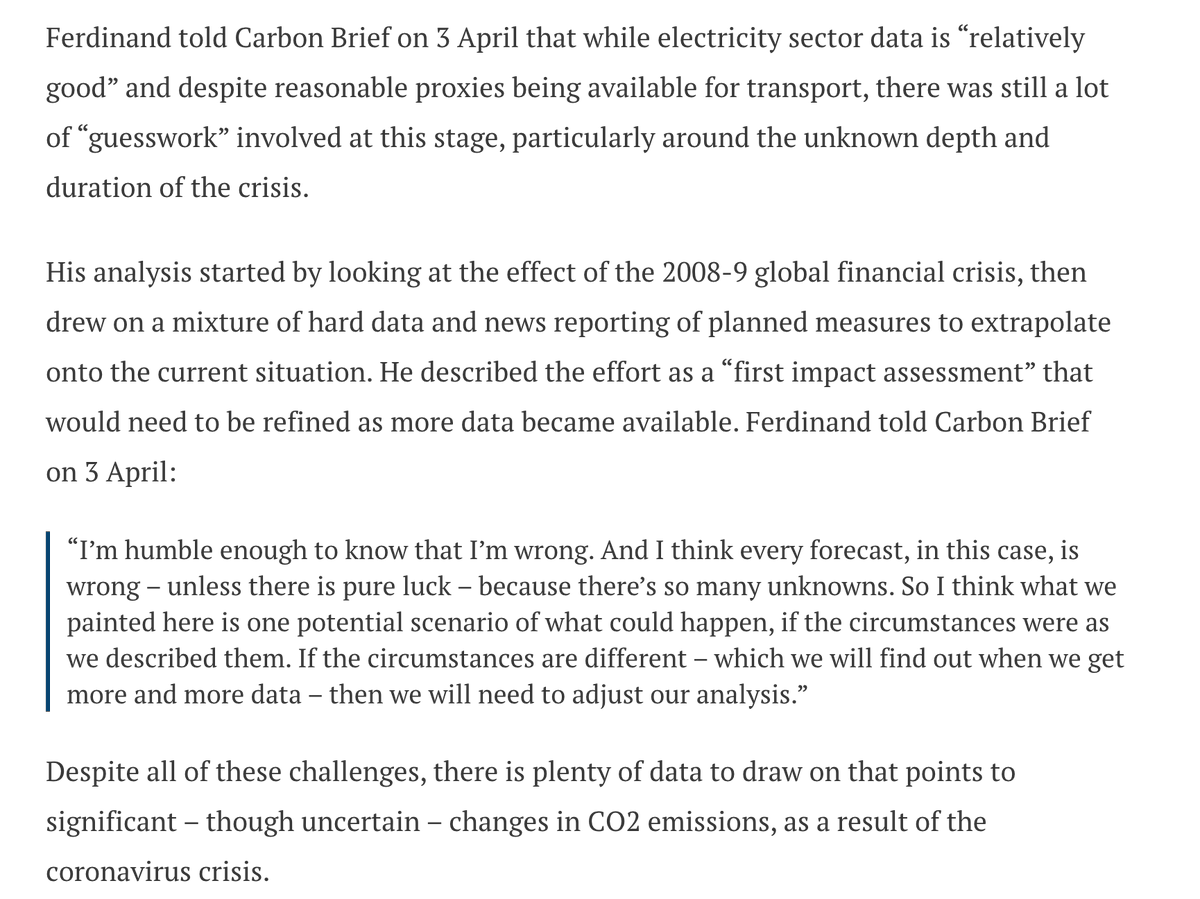
We should all heed @MFOslo quote in my piece and be "humble enough to know that I& #39;m wrong" in any forecasts.
I am wrong too.
https://www.carbonbrief.org/analysis-coronavirus-set-to-cause-largest-ever-annual-fall-in-co2-emissions">https://www.carbonbrief.org/analysis-...
We should all heed @MFOslo quote in my piece and be "humble enough to know that I& #39;m wrong" in any forecasts.
I am wrong too.
https://www.carbonbrief.org/analysis-coronavirus-set-to-cause-largest-ever-annual-fall-in-co2-emissions">https://www.carbonbrief.org/analysis-...
Before the details, what does it all mean?
 https://abs.twimg.com/emoji/v2/... draggable="false" alt="1⃣" title="Keycap digit one" aria-label="Emoji: Keycap digit one">Getting to net-zero emissions to avoid dangerous climate change -limiting warming to 1.5/2C– will be incredibly hard.
We can& #39;t do it by crashing the economy; we need to break the link between GDP & CO2.
https://www.carbonbrief.org/analysis-coronavirus-set-to-cause-largest-ever-annual-fall-in-co2-emissions">https://www.carbonbrief.org/analysis-...
We can& #39;t do it by crashing the economy; we need to break the link between GDP & CO2.
https://www.carbonbrief.org/analysis-coronavirus-set-to-cause-largest-ever-annual-fall-in-co2-emissions">https://www.carbonbrief.org/analysis-...
New zero-carbon tech will help. But we must deploy existing tech rapidly, at scale. Efficiency 1st.
And individual action isn& #39;t enough. Behaviour change, yes, but also the places & policies to enable it.
Everything. All at once. Yesterday. https://www.carbonbrief.org/analysis-coronavirus-set-to-cause-largest-ever-annual-fall-in-co2-emissions">https://www.carbonbrief.org/analysis-...
What does it all mean?
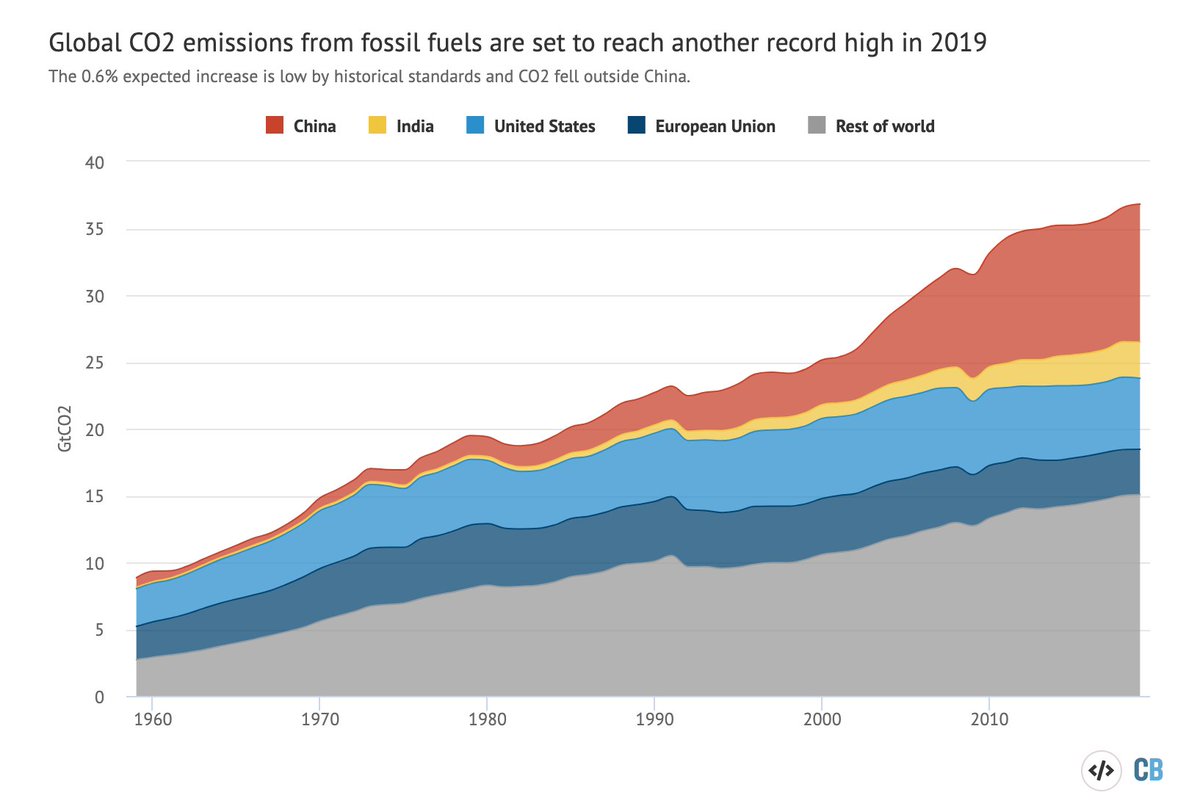
 https://abs.twimg.com/emoji/v2/... draggable="false" alt="2⃣" title="Keycap digit two" aria-label="Emoji: Keycap digit two">Current emissions are huge…and China is big but it isn& #39;t everything.
China emits ~200MtCO2 a week
The US ~100Mt
India ~50
EU electricity ~16
A 25% cut in China for a month is only 2% for the year – and more like 0.5% globally.
https://www.carbonbrief.org/analysis-global-fossil-fuel-emissions-up-zero-point-six-per-cent-in-2019-due-to-china">https://www.carbonbrief.org/analysis-...
What does it all mean?
 https://abs.twimg.com/emoji/v2/... draggable="false" alt="3⃣" title="Keycap digit three" aria-label="Emoji: Keycap digit three"> #coronavirus is temporary but CO2 is forever.
We& #39;ve already put >2,000GtCO2 into the atmosphere.
Even if we cut global emissions this year by 10%, whoop, we only add another, what, 33GtCO2 in 2020 instead of 37GtCO2.
Go team!
We& #39;ve already put >2,000GtCO2 into the atmosphere.
Even if we cut global emissions this year by 10%, whoop, we only add another, what, 33GtCO2 in 2020 instead of 37GtCO2.
Go team!
What does it all mean?
 https://abs.twimg.com/emoji/v2/... draggable="false" alt="4⃣" title="Keycap digit four" aria-label="Emoji: Keycap digit four">Emissions aren& #39;t necessarily from where you think.
International aviation is only, what, 2.5% of global CO2? That& #39;s not a free pass for flying, but it is pause for thought.
Just one eg – cement – is WAY bigger, roughly 8%. https://www.carbonbrief.org/qa-why-cement-emissions-matter-for-climate-change">https://www.carbonbrief.org/qa-why-ce...
International aviation is only, what, 2.5% of global CO2? That& #39;s not a free pass for flying, but it is pause for thought.
Just one eg – cement – is WAY bigger, roughly 8%. https://www.carbonbrief.org/qa-why-cement-emissions-matter-for-climate-change">https://www.carbonbrief.org/qa-why-ce...
Anyway, enough philosophising from me. Let& #39;s get back to the data on #coronvirus, energy use and CO2 emissions.
https://www.carbonbrief.org/analysis-coronavirus-set-to-cause-largest-ever-annual-fall-in-co2-emissions">https://www.carbonbrief.org/analysis-...
https://www.carbonbrief.org/analysis-coronavirus-set-to-cause-largest-ever-annual-fall-in-co2-emissions">https://www.carbonbrief.org/analysis-...
Sure, there is loads of data out there:
* congestion stats
* electricity demand
* air pollution
* flight cancellations
etc etc etc
…but a lot of it is hard to translate into emissions https://www.carbonbrief.org/analysis-coronavirus-set-to-cause-largest-ever-annual-fall-in-co2-emissions">https://www.carbonbrief.org/analysis-...
* congestion stats
* electricity demand
* air pollution
* flight cancellations
etc etc etc
…but a lot of it is hard to translate into emissions https://www.carbonbrief.org/analysis-coronavirus-set-to-cause-largest-ever-annual-fall-in-co2-emissions">https://www.carbonbrief.org/analysis-...
Apart from a lack of timely data, there& #39;s also the issue of attribution:
If CO2 falls in a given period, is it 100% due to #coronavirus or are other factors also at work? What about…
* weather
* existing trends
* 2nd-order effects eg oil price war https://www.carbonbrief.org/analysis-coronavirus-set-to-cause-largest-ever-annual-fall-in-co2-emissions">https://www.carbonbrief.org/analysis-...
By last week, we felt there was enough data to look at how #coronavirus might affect global CO2 in 2020
We identified 5 sources covering ~75% of global CO2
 https://abs.twimg.com/emoji/v2/... draggable="false" alt="1⃣" title="Keycap digit one" aria-label="Emoji: Keycap digit one">CB analysis of China
 https://abs.twimg.com/emoji/v2/... draggable="false" alt="2⃣" title="Keycap digit two" aria-label="Emoji: Keycap digit two">ICIS on EU ETS
 https://abs.twimg.com/emoji/v2/... draggable="false" alt="3⃣" title="Keycap digit three" aria-label="Emoji: Keycap digit three">
 https://abs.twimg.com/emoji/v2/... draggable="false" alt="4⃣" title="Keycap digit four" aria-label="Emoji: Keycap digit four">EIA STEO for whole US + global oil
 https://abs.twimg.com/emoji/v2/... draggable="false" alt="5⃣" title="Keycap digit five" aria-label="Emoji: Keycap digit five">India power data https://www.carbonbrief.org/analysis-coronavirus-set-to-cause-largest-ever-annual-fall-in-co2-emissions">https://www.carbonbrief.org/analysis-...
We identified 5 sources covering ~75% of global CO2
In each case, I tried to get a figure for how much CO2 is expected to fall *because of #coronavirus*
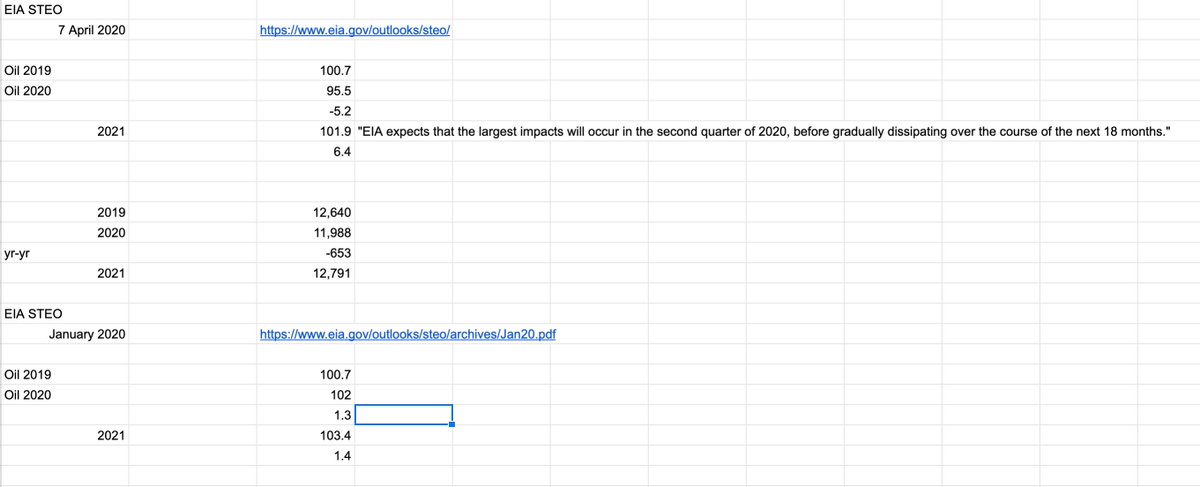
So eg in Jan20, EIA thought US CO2 would fall by 1.7% this year. In April it said 7.7%. So the covid-19 impact is -6%.
(Or is it…?! Pesky attribution!) https://twitter.com/DrSimEvans/status/1247825334789160961">https://twitter.com/DrSimEvan...
So eg in Jan20, EIA thought US CO2 would fall by 1.7% this year. In April it said 7.7%. So the covid-19 impact is -6%.
(Or is it…?! Pesky attribution!) https://twitter.com/DrSimEvans/status/1247825334789160961">https://twitter.com/DrSimEvan...
Similarly, EIA said in Jan20 that global oil demand would rise by 1.3Mbpd to 102Mbpd.
As of Apr20 it was saying demand would *fall* to 95.5Mbpd.
Delta = 6.5Mbpd
It& #39;s a bit messy but I collated all this in a spreadsheet & converted into CO2 emissions.
https://www.carbonbrief.org/analysis-coronavirus-set-to-cause-largest-ever-annual-fall-in-co2-emissions">https://www.carbonbrief.org/analysis-...
For India, @robbie_andrew has a great chart showing how electricity demand has taken a big hit, mainly cutting coal burn.
I took a simplistic approach assuming the 25% fall in demand (33% for coal) lasts 12wks, at coal fleet-avg of 0.9tCO2/GWh
~70MtCO2 https://twitter.com/robbie_andrew/status/1244923302637965314">https://twitter.com/robbie_an...
I took a simplistic approach assuming the 25% fall in demand (33% for coal) lasts 12wks, at coal fleet-avg of 0.9tCO2/GWh
~70MtCO2 https://twitter.com/robbie_andrew/status/1244923302637965314">https://twitter.com/robbie_an...
For China and the EU ETS, I took figures from @MFOslo for @ICISOfficial & @laurimyllyvirta analysis for @CarbonBrief, then took out an estimate for the oil component to avoid overlap w global oil
(I took oil out of US total too)
https://www.icis.com/explore/resources/news/2020/03/27/10487371/european-power-and-carbon-markets-affected-by-covid-19-an-early-impact-assessment">https://www.icis.com/explore/r... https://www.carbonbrief.org/analysis-coronavirus-has-temporarily-reduced-chinas-co2-emissions-by-a-quarter">https://www.carbonbrief.org/analysis-...
Adding all of those estimated #coronavirus impacts together I came to a 2020 global total of -1,600MtCO2.
That& #39;s a lot.
It& #39;d be easily the largest ever annual fall.
https://www.carbonbrief.org/analysis-coronavirus-set-to-cause-largest-ever-annual-fall-in-co2-emissions">https://www.carbonbrief.org/analysis-...
That& #39;s a lot.
It& #39;d be easily the largest ever annual fall.
https://www.carbonbrief.org/analysis-coronavirus-set-to-cause-largest-ever-annual-fall-in-co2-emissions">https://www.carbonbrief.org/analysis-...
One subtlety I tried to explain in the piece, but not in the chart, is that global CO2 emissions were expected to *increase* this year, before the #coronvirus crisis took hold.
This early draft chart attempted to make the point:
https://www.carbonbrief.org/analysis-coronavirus-set-to-cause-largest-ever-annual-fall-in-co2-emissions">https://www.carbonbrief.org/analysis-...
This early draft chart attempted to make the point:
https://www.carbonbrief.org/analysis-coronavirus-set-to-cause-largest-ever-annual-fall-in-co2-emissions">https://www.carbonbrief.org/analysis-...
Other forecasts & new data keep coming out.
Just b4 we published last wk @RystadEnergy cut its oil demand outlook for 2020 to -9.4%
That would change my analysis significantly (see GIF)
A ~4% global #coronvirus CO2 impact becomes ~6% (!)
https://www.carbonbrief.org/analysis-coronavirus-set-to-cause-largest-ever-annual-fall-in-co2-emissions">https://www.carbonbrief.org/analysis-...
Tomorrow, the @IEA is planning to publish its own latest forecast for global oil demand in 2020. Later this month it& #39;ll also have its own global CO2 forecast for the year.
I& #39;ll try to keep updating my story here: https://www.carbonbrief.org/analysis-coronavirus-set-to-cause-largest-ever-annual-fall-in-co2-emissions">https://www.carbonbrief.org/analysis-...
I& #39;ll try to keep updating my story here: https://www.carbonbrief.org/analysis-coronavirus-set-to-cause-largest-ever-annual-fall-in-co2-emissions">https://www.carbonbrief.org/analysis-...
(I started – but never finished – a thread just after publication last week, so for reference here& #39;s a link back:
https://twitter.com/DrSimEvans/status/1248255996142800896
Sign">https://twitter.com/DrSimEvan... of the times – I was interrupted by childcare duties
https://twitter.com/DrSimEvans/status/1248256000550998016
And">https://twitter.com/DrSimEvan... Easter weekend weather wasn& #39;t conducive to work!)

 Read on Twitter
 Getting to net-zero emissions to avoid dangerous climate change -limiting warming to 1.5/2C– will be incredibly hard.We can& #39;t do it by crashing the economy; we need to break the link between GDP & CO2. https://www.carbonbrief.org/analysis-..." title="Before the details, what does it all mean?https://abs.twimg.com/emoji/v2/... draggable="false" alt="1⃣" title="Keycap digit one" aria-label="Emoji: Keycap digit one">Getting to net-zero emissions to avoid dangerous climate change -limiting warming to 1.5/2C– will be incredibly hard.We can& #39;t do it by crashing the economy; we need to break the link between GDP & CO2. https://www.carbonbrief.org/analysis-..." class="img-responsive" style="max-width:100%;"/>
 Current emissions are huge…and China is big but it isn& #39;t everything.China emits ~200MtCO2 a weekThe US ~100MtIndia ~50EU electricity ~16A 25% cut in China for a month is only 2% for the year – and more like 0.5% globally. https://www.carbonbrief.org/analysis-..." title="What does it all mean?https://abs.twimg.com/emoji/v2/... draggable="false" alt="2⃣" title="Keycap digit two" aria-label="Emoji: Keycap digit two">Current emissions are huge…and China is big but it isn& #39;t everything.China emits ~200MtCO2 a weekThe US ~100MtIndia ~50EU electricity ~16A 25% cut in China for a month is only 2% for the year – and more like 0.5% globally. https://www.carbonbrief.org/analysis-..." class="img-responsive" style="max-width:100%;"/>
 #coronavirus is temporary but CO2 is forever.We& #39;ve already put >2,000GtCO2 into the atmosphere.Even if we cut global emissions this year by 10%, whoop, we only add another, what, 33GtCO2 in 2020 instead of 37GtCO2.Go team!" title="What does it all mean?https://abs.twimg.com/emoji/v2/... draggable="false" alt="3⃣" title="Keycap digit three" aria-label="Emoji: Keycap digit three"> #coronavirus is temporary but CO2 is forever.We& #39;ve already put >2,000GtCO2 into the atmosphere.Even if we cut global emissions this year by 10%, whoop, we only add another, what, 33GtCO2 in 2020 instead of 37GtCO2.Go team!" class="img-responsive" style="max-width:100%;"/>

