Read our new SOMO report: Private gains we can ill afford - The financialisation of Big Pharma
https://www.somo.nl/private-gains-we-can-ill-afford/?noredirect=en_GB
In">https://www.somo.nl/private-g... this report we explore the extent to which the 27 largest pharmaceutical companies - measured by revenue in 2018 - are financialised
https://www.somo.nl/private-gains-we-can-ill-afford/?noredirect=en_GB
In">https://www.somo.nl/private-g... this report we explore the extent to which the 27 largest pharmaceutical companies - measured by revenue in 2018 - are financialised
We focus on three areas of financialisaton
A)Growing balance sheet (debt and financial reserves) in relation to revenue
B)Payouts to shareholders
C)Intangibles as % of total assets
A)Growing balance sheet (debt and financial reserves) in relation to revenue
B)Payouts to shareholders
C)Intangibles as % of total assets
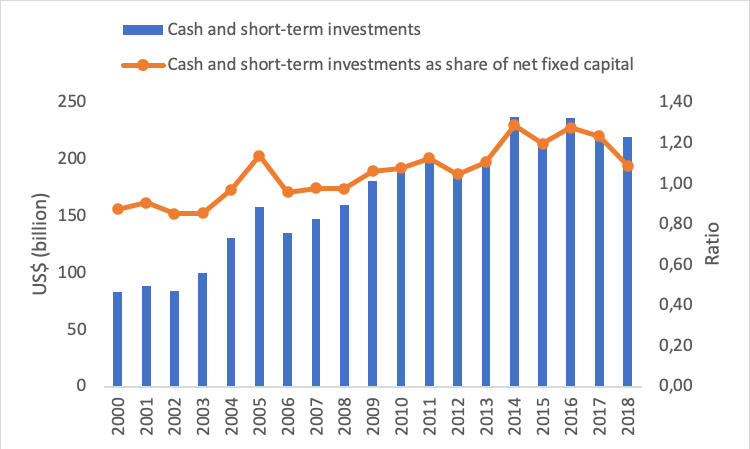
Between 2000 and 2018, the corporations grew their combined cash reserves from $83 to $219 Bn. As share of fixed capital it increased to 109%
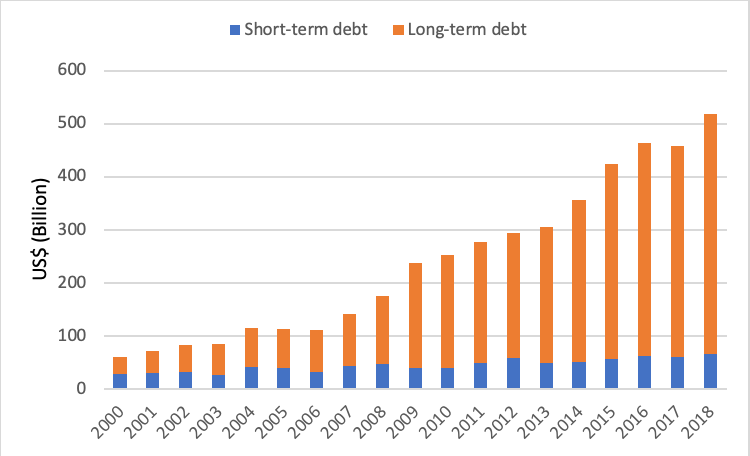
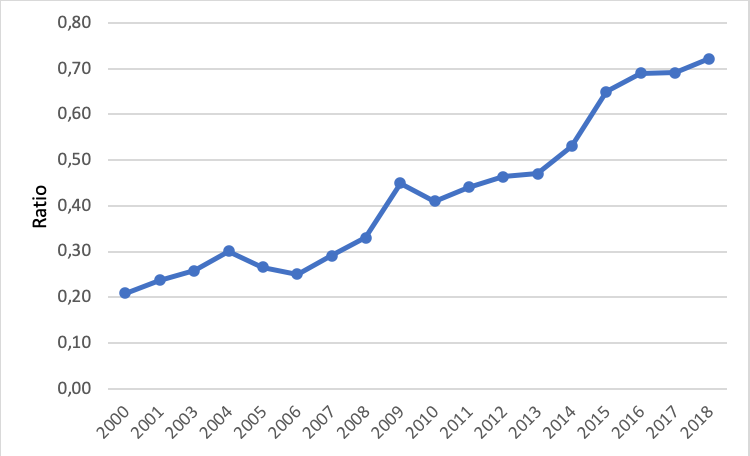
These 27 corporations recorded $518 Bn of debt in 2018 compared to a mere $61 Bn in 2000. As share of net sales-> debt increased to 72%
Despite this surge in debt and growing reserves, investments in fixed capital decreased as a share of net sales -> 6% in 2000 to 5% in 2018
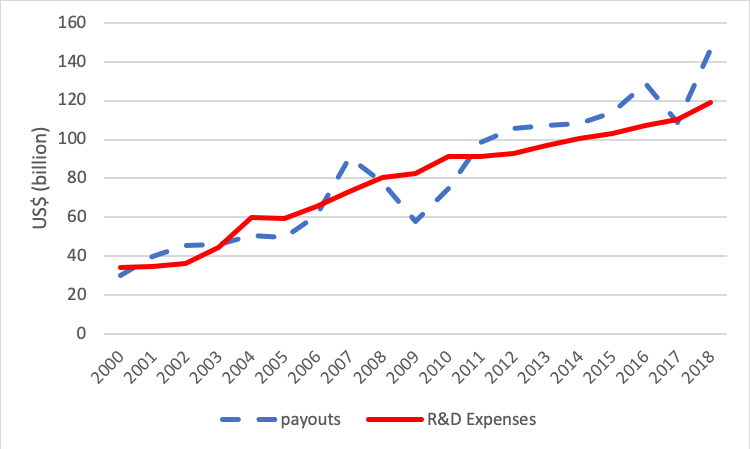
Total payouts to shareholders (dividends and share buybacks) have increased from 88% total R&D investments in 2000 to 123 % in 2018.
Total payouts (US$1,540 Bn) have exceeded R&D expenses (US$1,482 Bn) by US$58 Bn since 2000.
Total payouts (US$1,540 Bn) have exceeded R&D expenses (US$1,482 Bn) by US$58 Bn since 2000.
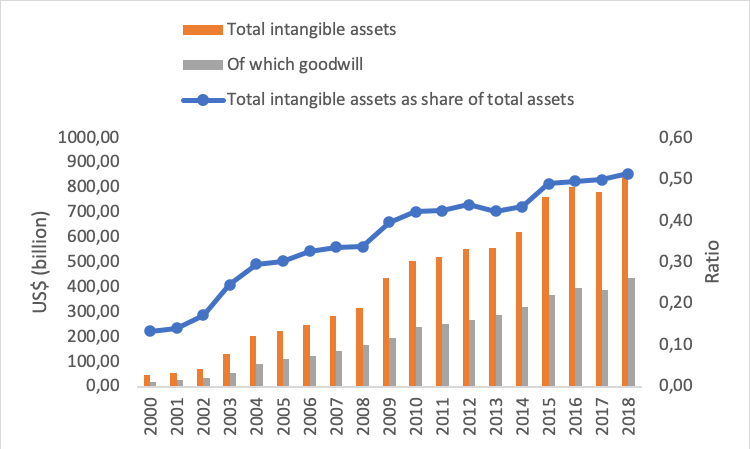
Intangible assets increased from $48 bn in 2000 to $857 bn in 2018. As % of total assets, intangibles exploded from 13% 2000 to 51% in 2018
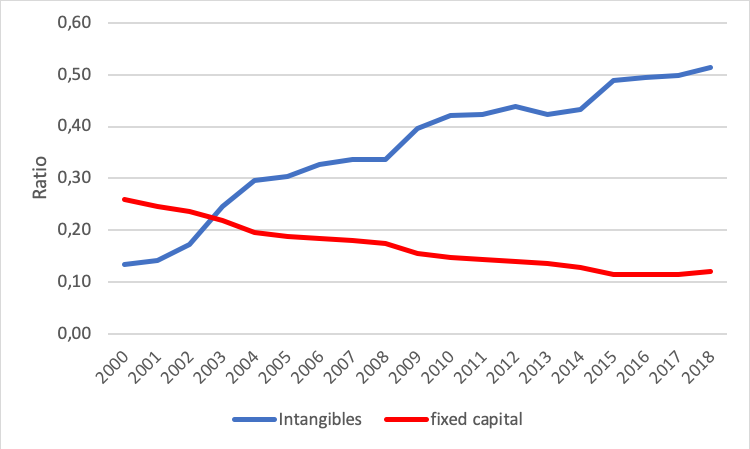
As share of total assets – fixed assets declined and the valuation of intangibles (mostly goodwill) amplified
As share of total assets – fixed assets declined and the valuation of intangibles (mostly goodwill) amplified

 Read on Twitter