Different countries & regions count deaths due to #COVID19 #SARSCoV2 differently. This is why I am interested in graphs of & #39;excess mortality& #39; - they aren& #39;t dependant on counting method. They capture all deaths that are > expected.
Let& #39;s chat quickly about excess mortality!
1/n https://twitter.com/d_spiegel/status/1249986522692096003">https://twitter.com/d_spiegel...
Let& #39;s chat quickly about excess mortality!
1/n https://twitter.com/d_spiegel/status/1249986522692096003">https://twitter.com/d_spiegel...
& #39;Excess mortality& #39; means: How many more people died this year than died on average over the last few years?
In general, we expect the number of deaths to average out fairly smoothly for the same times of year (though on average there are variations through the year)
2/n
In general, we expect the number of deaths to average out fairly smoothly for the same times of year (though on average there are variations through the year)
2/n
We can average these numbers over the last 5, 10, or 20 years, & put confidence intervals on what we would expect & #39;normal& #39; death to look like.
Then we can plot the total number of deaths, from any cause, this year, on that plot.
3/n
Then we can plot the total number of deaths, from any cause, this year, on that plot.
3/n
While of course there will be variation in non-COVID causes of death in this year, we would expect this to be within the variation we& #39;ve seen in previous years.
What can catch our attention is when deaths this year deviates far outside what we expect - "excess mortality"
4/n
What can catch our attention is when deaths this year deviates far outside what we expect - "excess mortality"
4/n
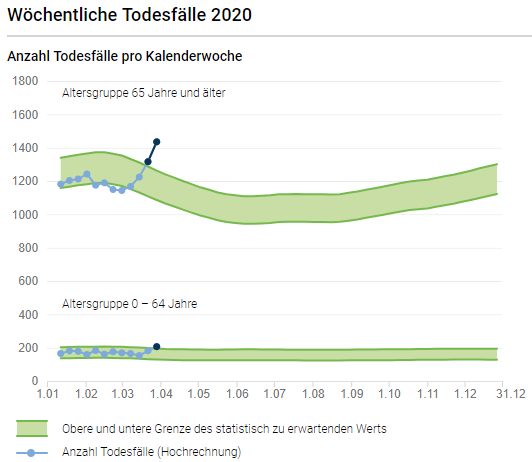
Excuse the German, but I think the Swiss data shows this well: It& #39;s split into >= 65 years (top) and <65 years. In both cases, we& #39;re outside the & #39;average band& #39; of deaths this year.
The average deaths are shown as a green band. Anything outside of this is below or above avg.
5/n
The average deaths are shown as a green band. Anything outside of this is below or above avg.
5/n
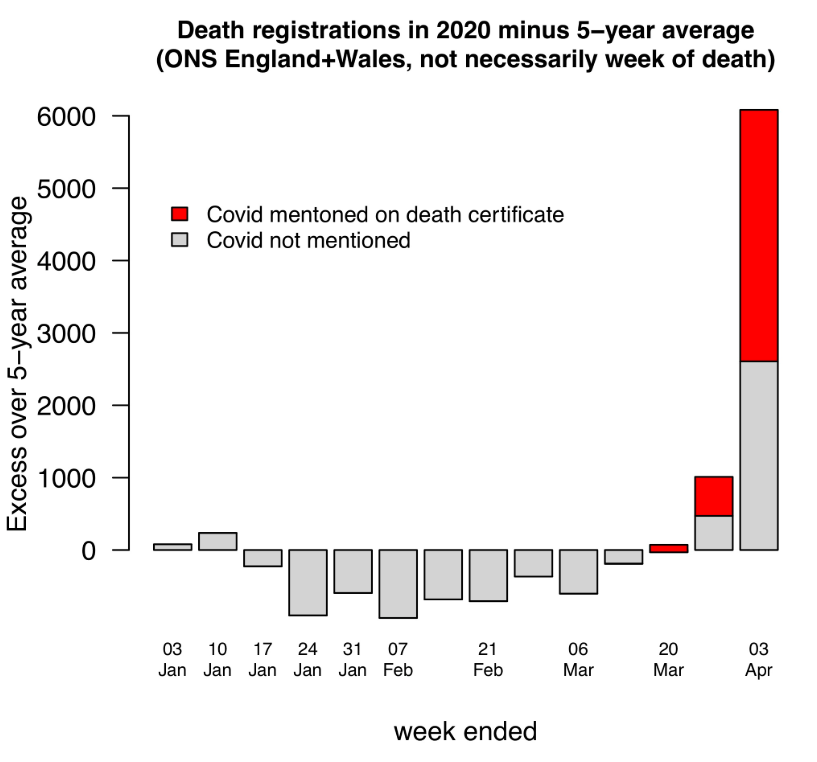
Let& #39;s go back to the graph just released by @ONS for England & Wales. Here, the bars show any deviation from the average of the past 5 years. Deaths were actually slightly down compared to average for Jan+Feb - hence why the bars go & #39;down& #39;
5/n
5/n
However, you can see that in the last couple of weeks that trend has changed sharply - we now have a huge excess of deaths. Really, the only explanation of this is #COVID19 #SARSCoV2. However, you can see that not all the excess deaths are formally attributed to #COVIDー19
6/n
6/n
This isn& #39;t a & #39;cover up& #39; - our health services just generally aren& #39;t designed to operate in a pandemic. Not all of these people will have even been tested for #COVID19 - We don& #39;t test every elderly respiratory death for every possible virus in normal time.
7/n
7/n
And we are short of #COVID19 #SARSCoV2 tests to use, so we wouldn& #39;t expect this to change suddenly.
I don& #39;t know how doctors are allowed to classify deaths in the UK, but as I said - this *isn& #39;t* an & #39;on purpose& #39; cover up. However, it does lead to under-counting.
8/n
I don& #39;t know how doctors are allowed to classify deaths in the UK, but as I said - this *isn& #39;t* an & #39;on purpose& #39; cover up. However, it does lead to under-counting.
8/n
This is why & #39;excess mortality& #39; can be helpful - it takes away those dependencies & allow us to see, roughly, the impact that #COVID19 #SARSCoV2 is having. Exact numbers are tricky here - not all deaths *will* be #COVIDー19.
However, the trend is clear!
9/n
However, the trend is clear!
9/n
Worth adding that there may well be a spike in non-COVID deaths as well - indirectly attributable to COVID-19 due to being home-bound, being hesitant to ask for help/visit doctor/seek care, & care not being as available due to overloaded health system.
10/n
10/n

 Read on Twitter


