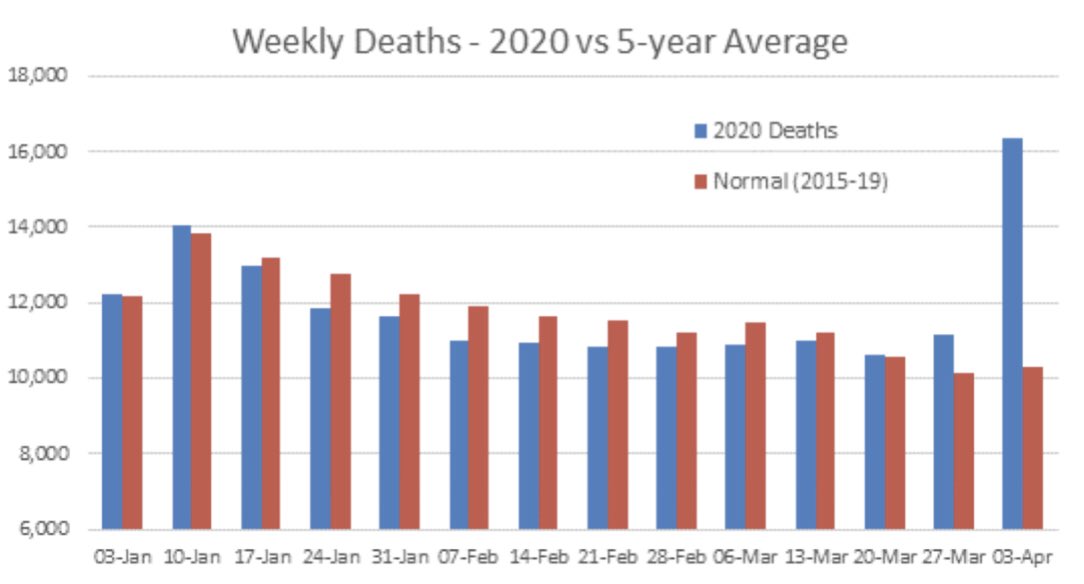
Latest ONS weekly deaths data (to w/e 3 April) have just been released and the impact of COVID-19 is now very apparent, with death numbers significantly higher than normal in week.
Year to date there have been 1.4% more deaths than the five-year average.
Please see notes below.
Year to date there have been 1.4% more deaths than the five-year average.
Please see notes below.
1. The numbers are for England and Wales only and are 11-18 days old.
2. ONS have helpfully broken out deaths where COVID-19 is mentioned on the death certificate - there were 3,475 this week. These differ from the @DHSCgovuk numbers - explanation here: https://twitter.com/ons/status/1244910649060274176">https://twitter.com/ons/statu...
2. ONS have helpfully broken out deaths where COVID-19 is mentioned on the death certificate - there were 3,475 this week. These differ from the @DHSCgovuk numbers - explanation here: https://twitter.com/ons/status/1244910649060274176">https://twitter.com/ons/statu...
5. Of particular interest is the difference between the excess deaths observed in week and the number officially attributed to COVID-19.
It looks like the actual impact of COVID-19 is about 75% higher than the official number!
It looks like the actual impact of COVID-19 is about 75% higher than the official number!
4. Importantly, please don’t read too much into simple analysis based on death counts.
UK population is ageing and growing. 2020 death counts SHOULD be higher than 5-year average (all else being equal).
The best way to compare is to look at age-standardised death rates.
UK population is ageing and growing. 2020 death counts SHOULD be higher than 5-year average (all else being equal).
The best way to compare is to look at age-standardised death rates.
5. The CMI (continuous mortality investigation) calculate age-standardised death rates to allow proper comparison.
This report will be available within the next 24 hours and will be produced weekly during the crisis.
This report will be available within the next 24 hours and will be produced weekly during the crisis.

 Read on Twitter


