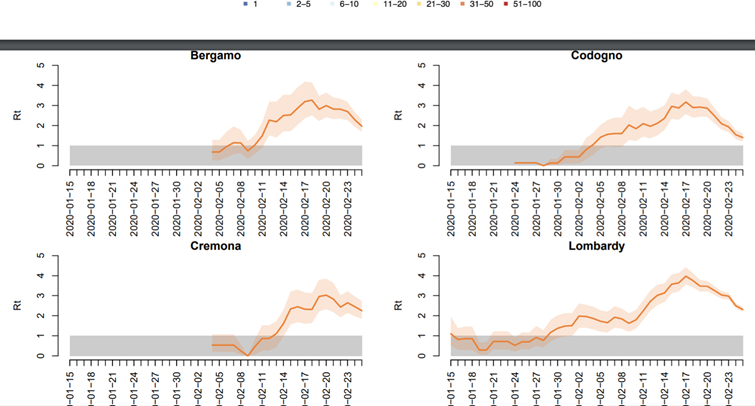
These are probably the most stunning graphs on #COVID2019 #COVID19 They are from a paper analyzing the initial spread in Lombardian communes and they show that the transmission started falling around February 20, before the epidemic was even discovered.
https://arxiv.org/abs/2003.09320?fbclid=IwAR1zF4JUs2NIIVKTnwjntk-Ki2SoGJ5VxkTNchXiurszJE8ERRSAhUrLDnI">https://arxiv.org/abs/2003....
https://arxiv.org/abs/2003.09320?fbclid=IwAR1zF4JUs2NIIVKTnwjntk-Ki2SoGJ5VxkTNchXiurszJE8ERRSAhUrLDnI">https://arxiv.org/abs/2003....
BTW it was clear a month ago from a simple analysis of the Lombardian death growth data that the epidemic had stopped growing exponentially before it was detected https://medium.com/@daniilgor/covid-19-epidemiological-models-and-the-lombardy-data-c7937c6d243">https://medium.com/@daniilgo...

 Read on Twitter


