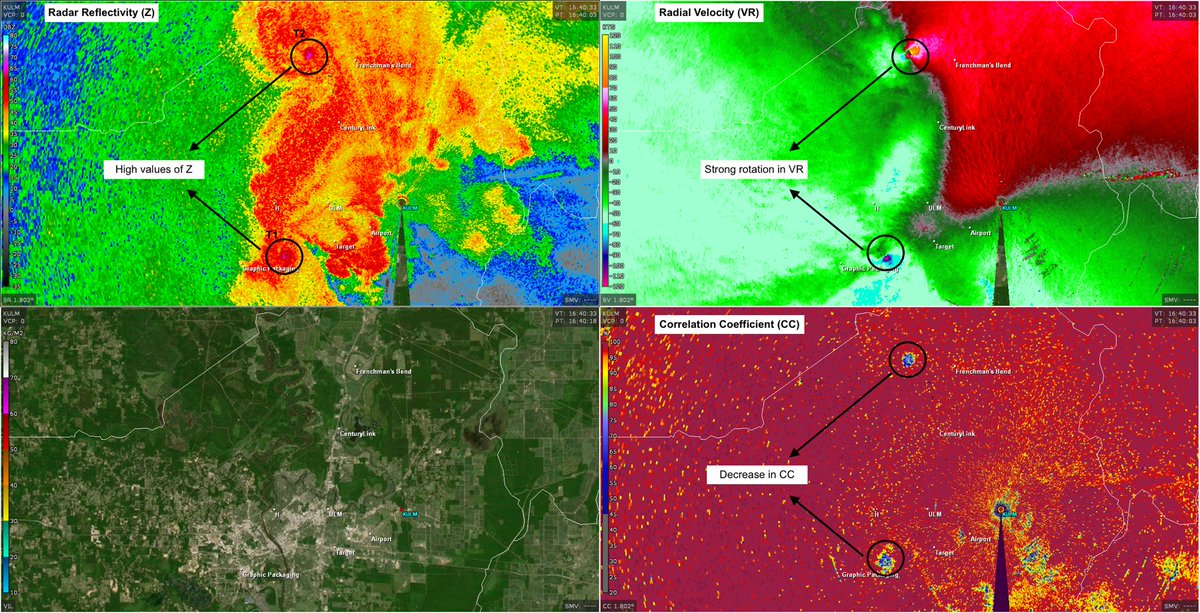
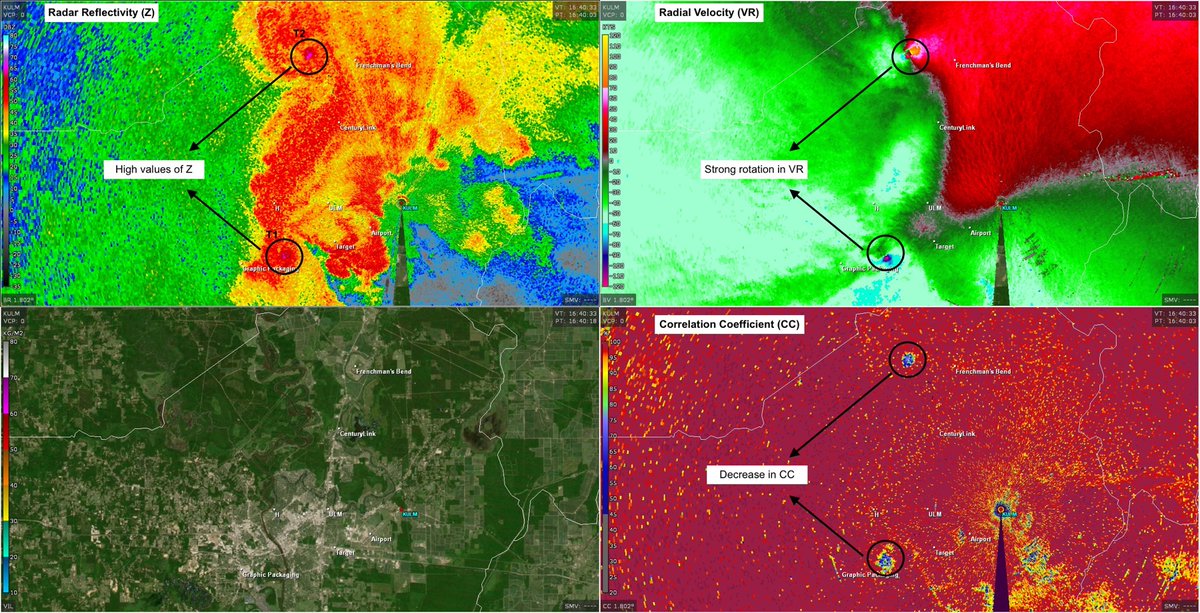
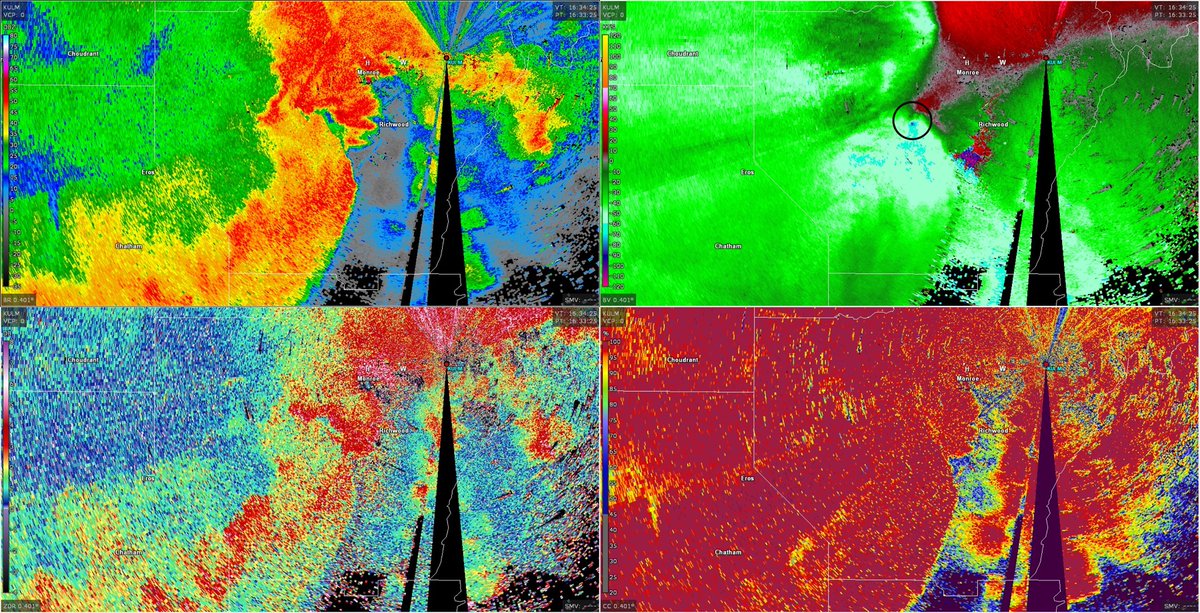
Quick review of our local tornado event yesterday. Let’s start here - this is an incredible shot from our radar of 2 concurrent tornadoes moving through Ouachita Parish at 11:40am. At this time T1 was south of I-20 crossing the river from West Monroe into Monroe. (1/n)
And T2 was approaching Sterlington High School. Since our radar is dual-pol, we can distinguish b/w normal weather targets (like rain) from debris being lofted by a tornado. We see this as a decrease in CC - but it has to occur coincident with high Z and rotation in VR (2/n)
That is very apparent in the radar image. Two clear “tornadic debris signatures” are evident from the ULM radar. (3/n)
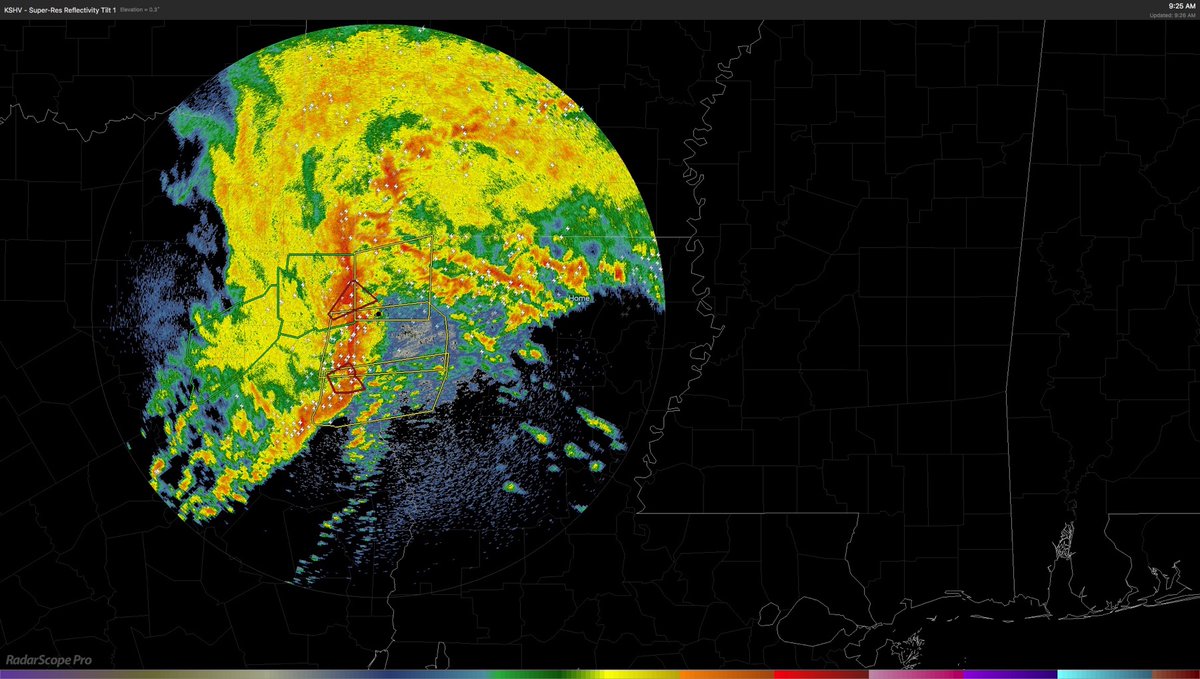
The tornadoes were embedded within a larger mesoscale convective system that initially formed in Texas overnight, likely produced tornadoes around Shreveport early Sunday morning, before continuing to track roughly along I-20. Here’s the MCS around 9:30am Sunday (4/n)
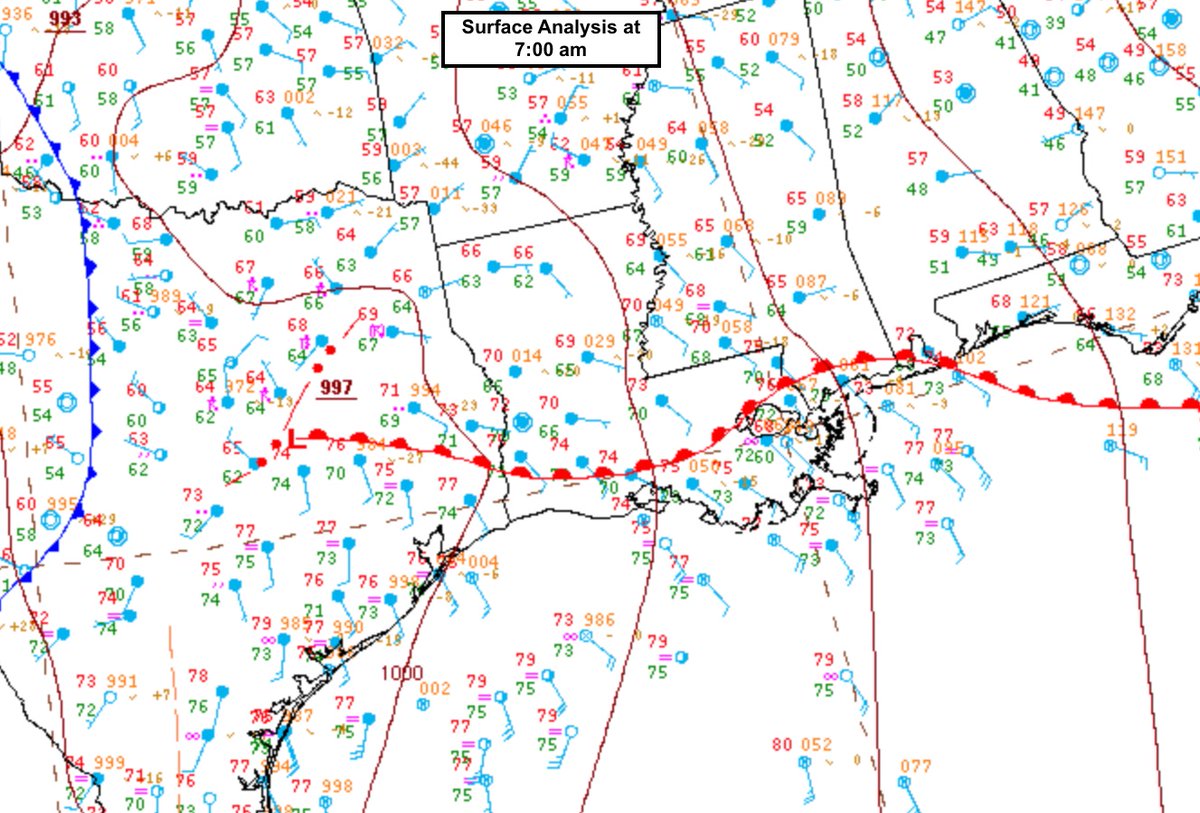
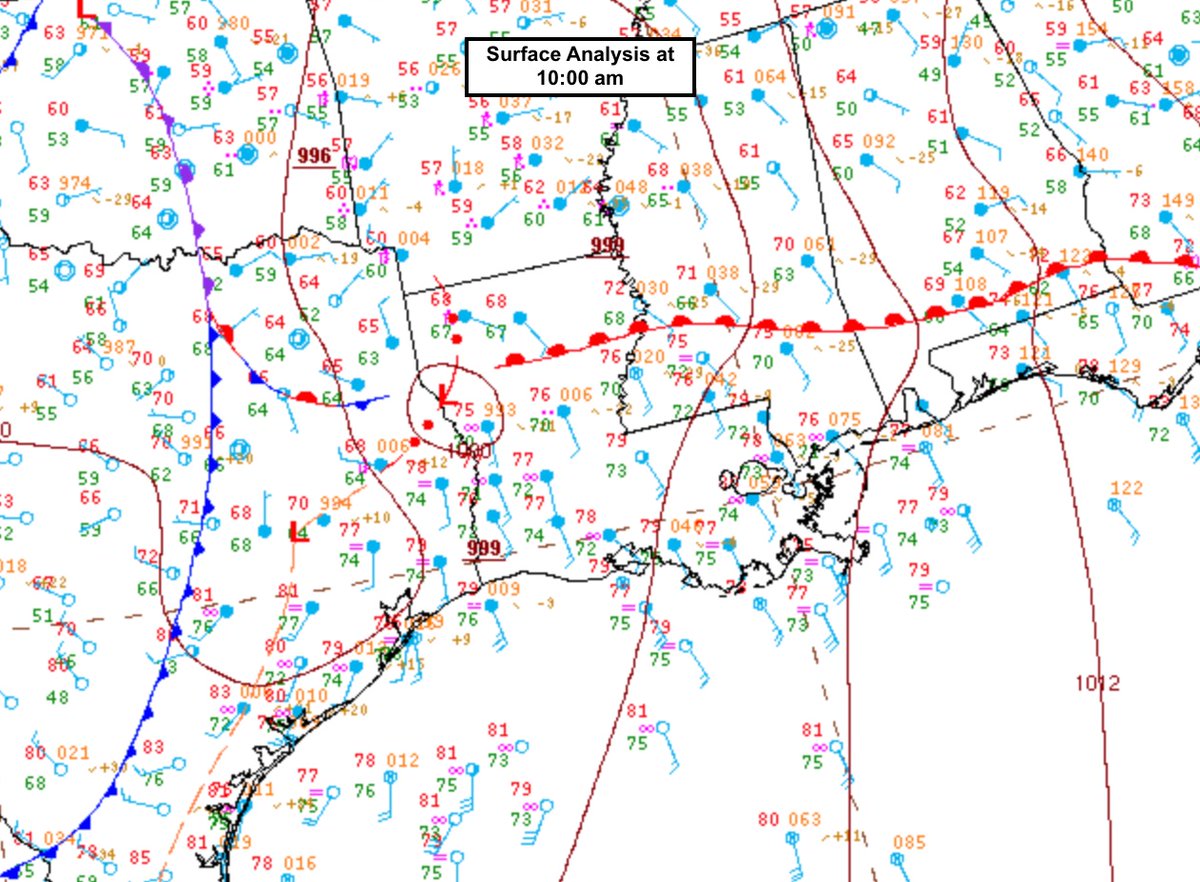
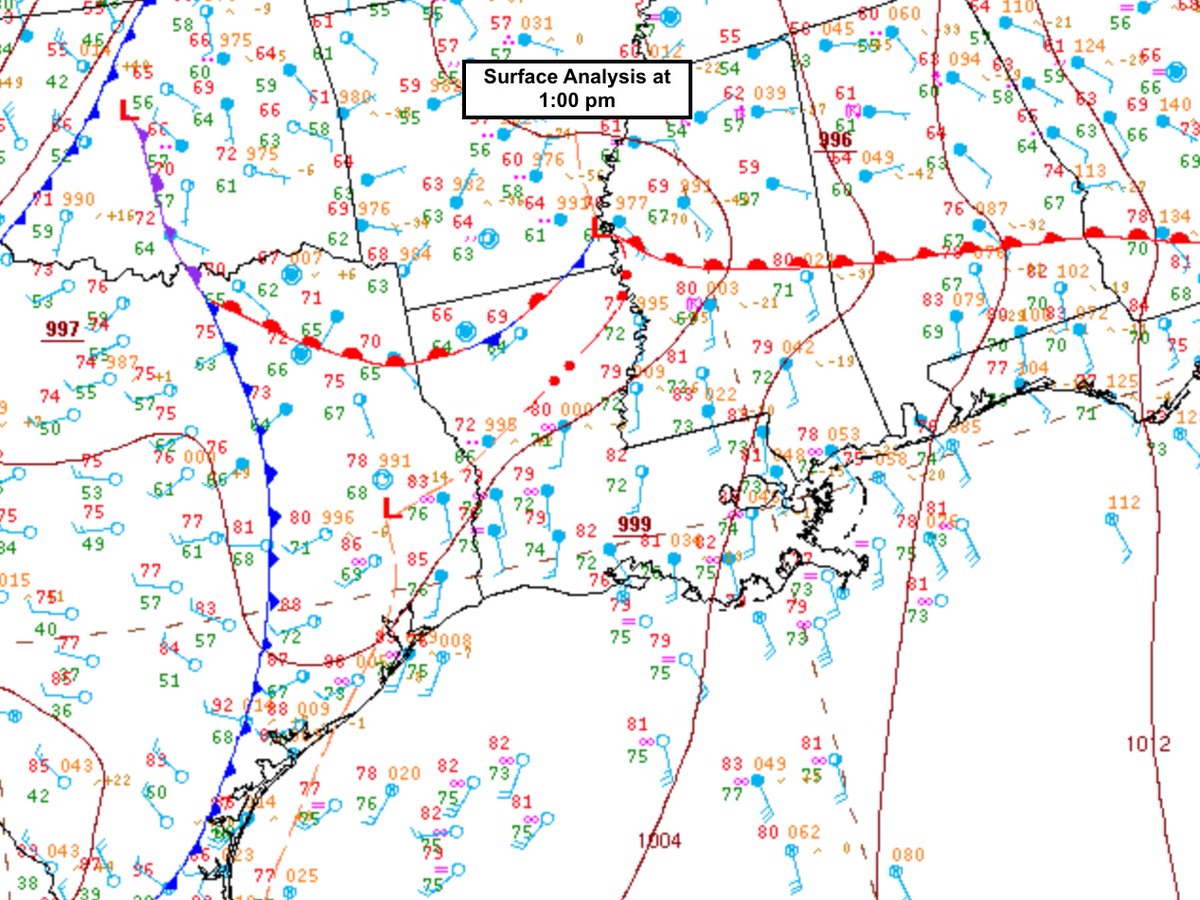
The MCS appeared to interact with a warm front that was surging northward during the event. Here’s the NOAA surface analysis at 7am, 10am, and 1pm. This is important, because any part of the MCS that was north of the front was probably elevated. (5/n)
Usually elevated convection means it’s hard to develop a tornado. But fronts can also help to enhance the local low-level shear, increasing tornado chances for any part of the convection that can actually become more surface based (i.e., just south of the front). (6/n)
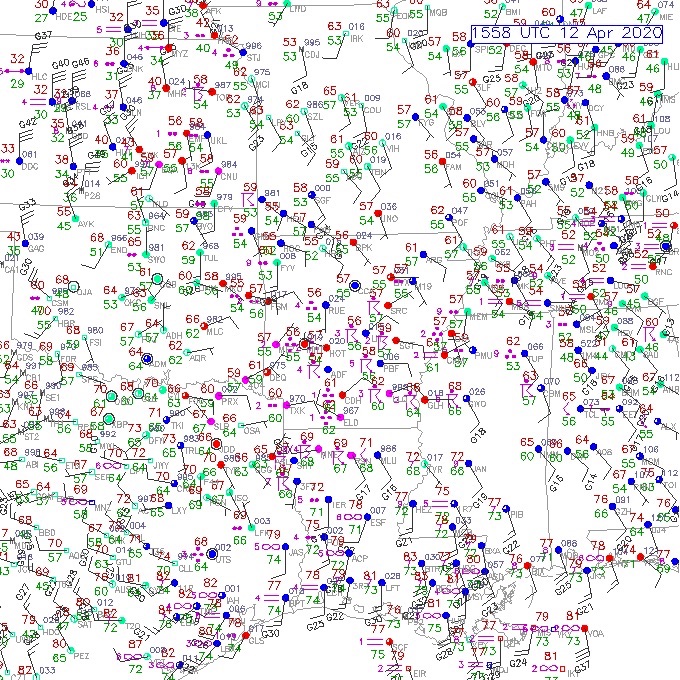
That seems like exactly what happened. Surface observations around the time the MCS made its approach to northeast LA indicate the warm front had surged north of Monroe - likely locally enhancing low-level shear and the convection no longer being elevated. (7/n)
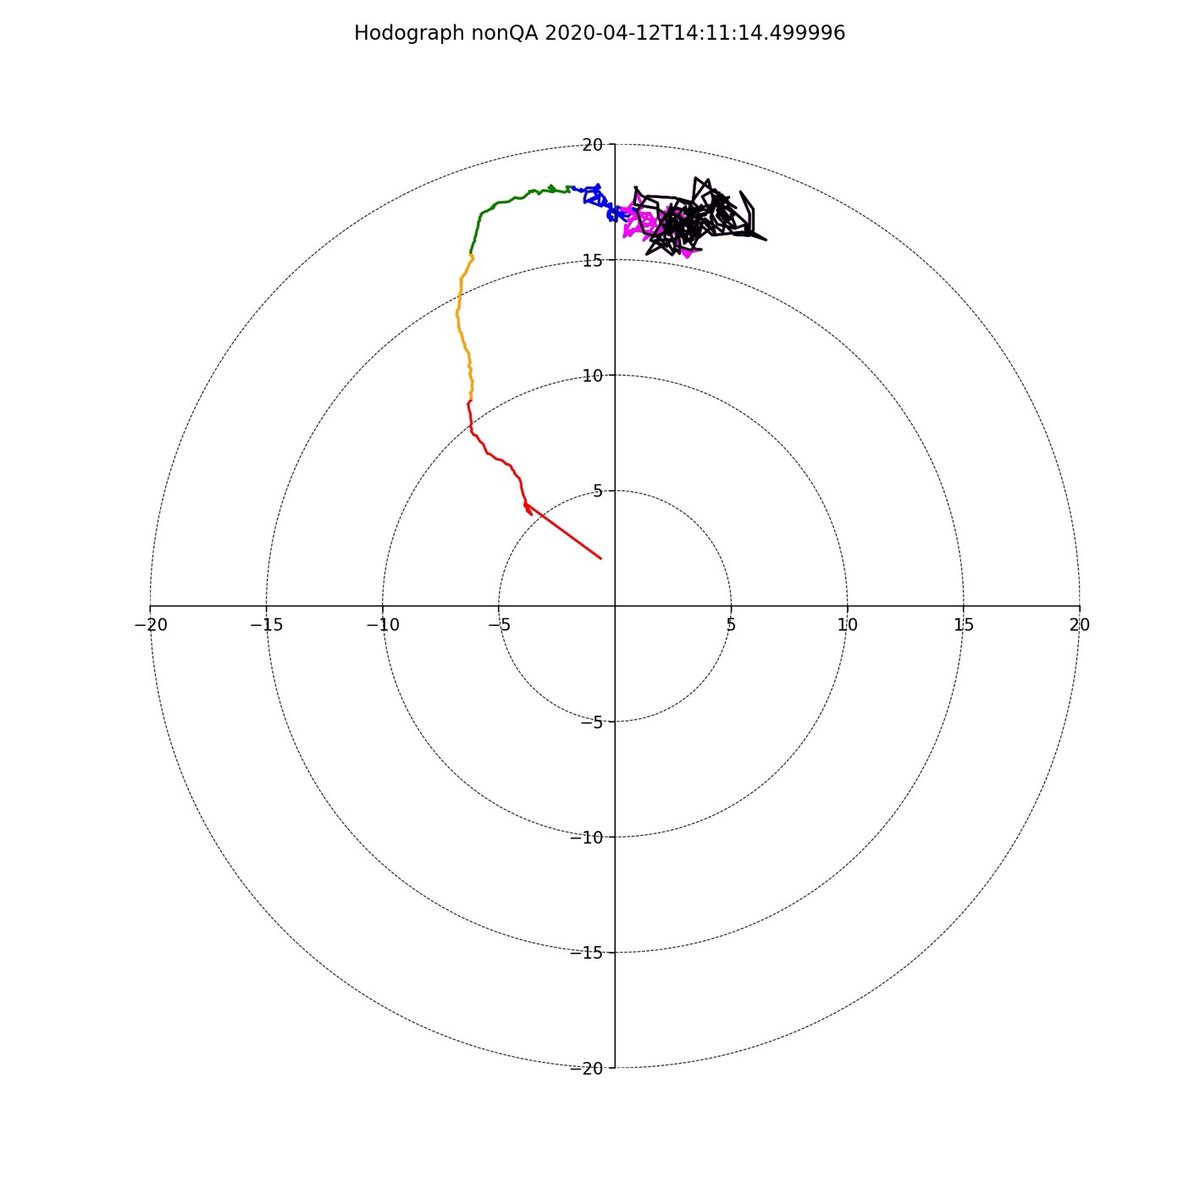
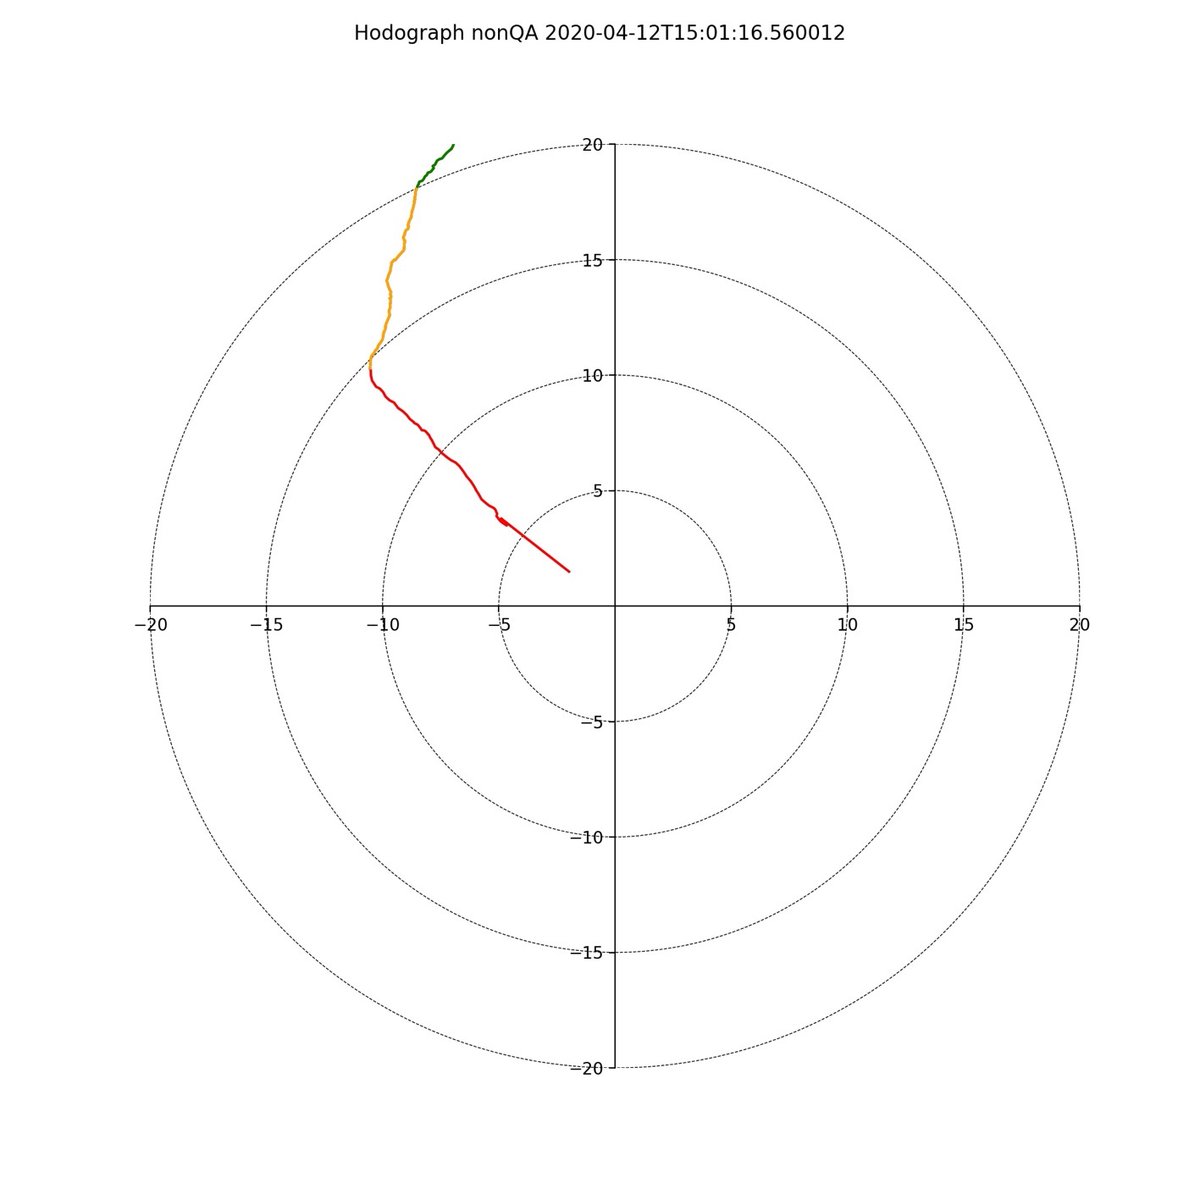
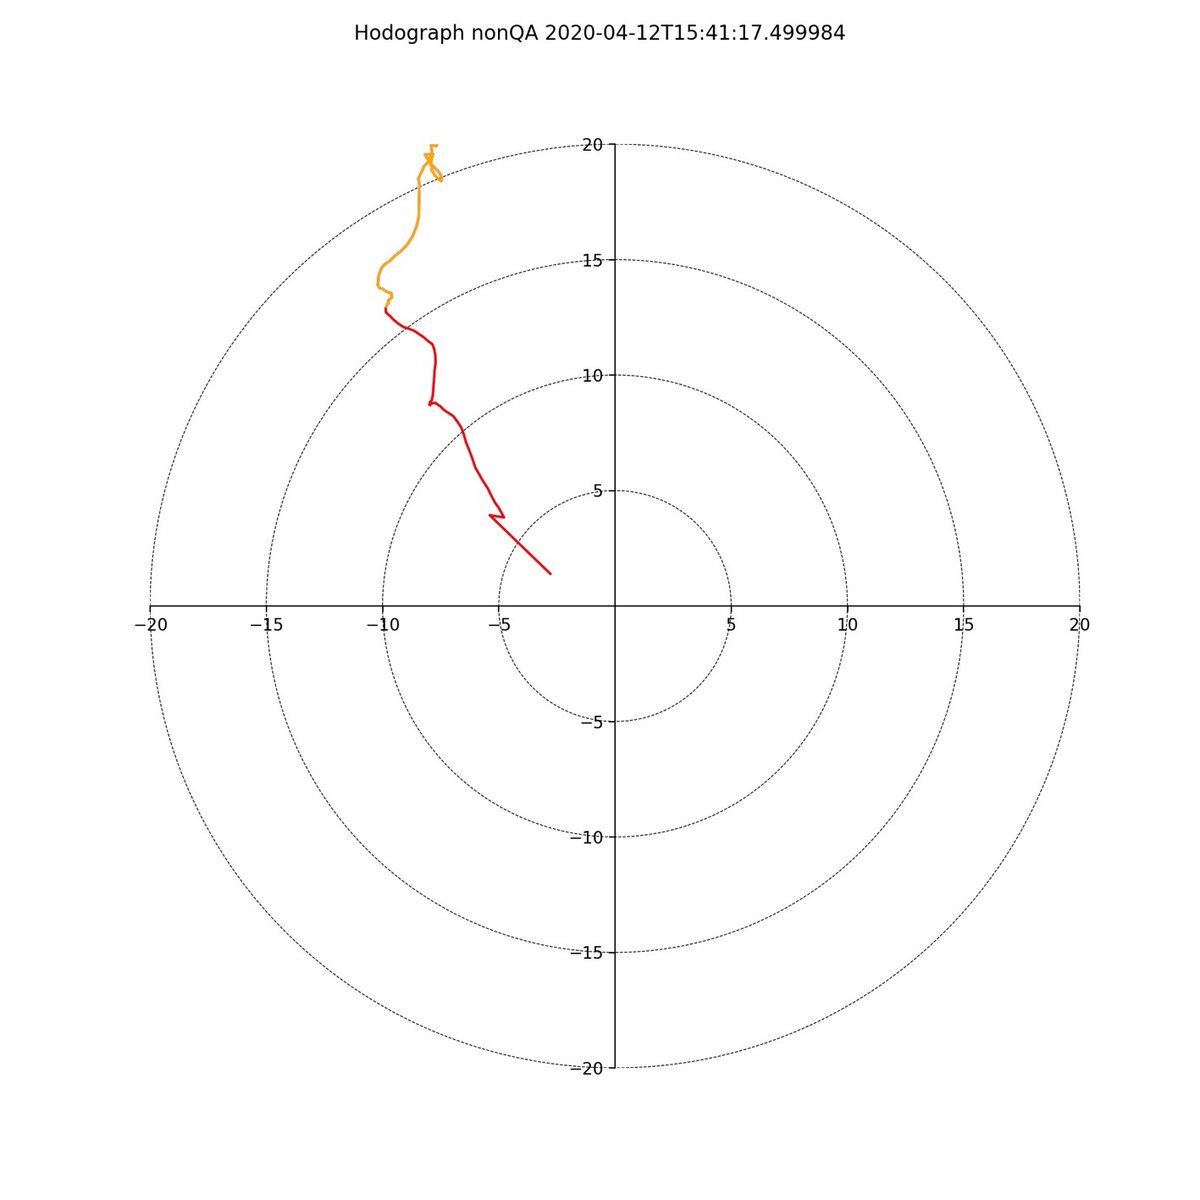
We were running our @NSF funded Doppler wind lidar during the event, and while low-level shear was already plenty intense, an increase in the ~sfc-500m AGL winds occurred near the time the warm front passed. Pay attention to the length of the red+yellow lines. (8/n)
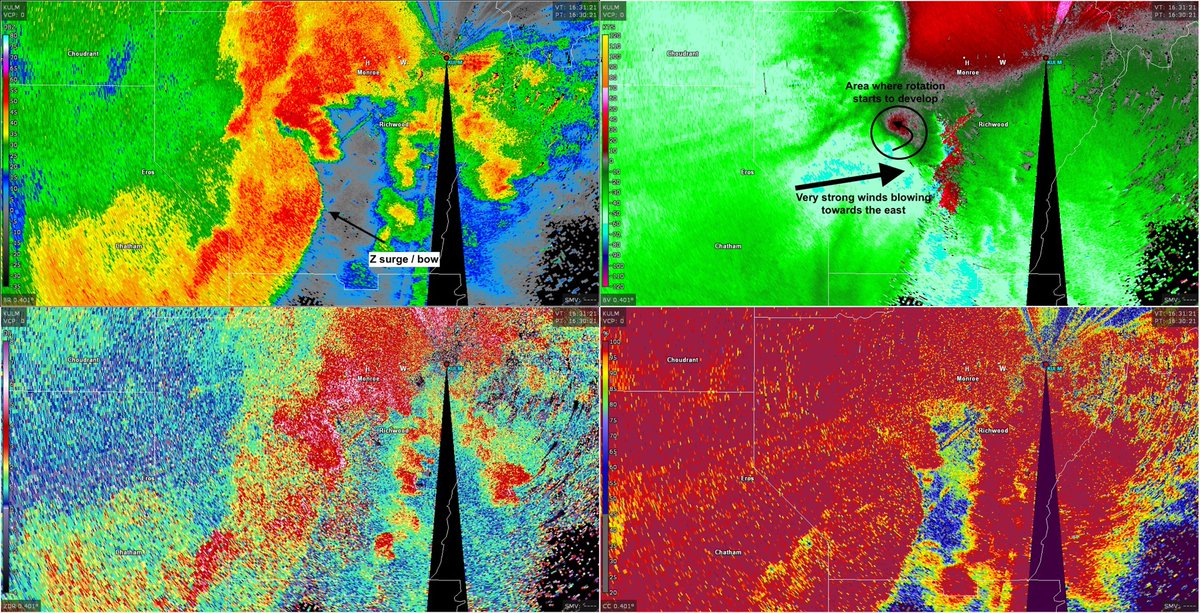
Now let’s examine the radar data a little closer. Here’s a loop specifically of the Monroe tornado. One thing that stands out is how the tornado developed along the northern end of a surge/bow in the line.
http://wxdata.geos.ulm.edu/monroe.gif
(9/n)">https://wxdata.geos.ulm.edu/monroe.gi...
http://wxdata.geos.ulm.edu/monroe.gif
(9/n)">https://wxdata.geos.ulm.edu/monroe.gi...
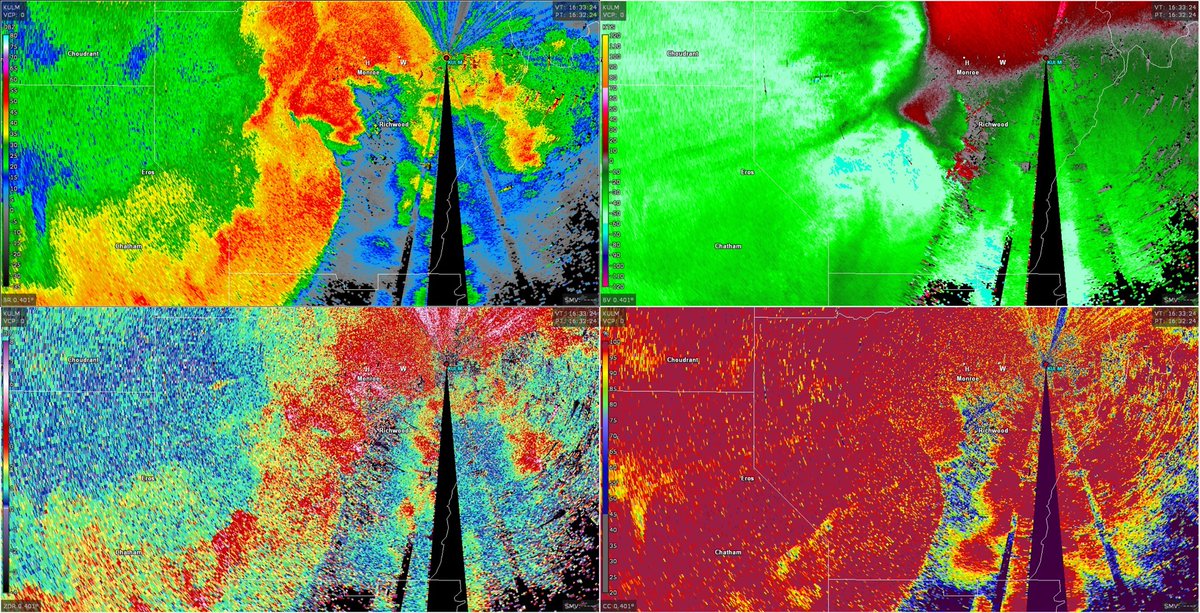
This process stands out a little better on the radar images from 11:30-11:33am. By 11:33am we have a clear circulation, though no debris signature. That finally forms 2-min later. (10/n)
We can track the debris signature, first impacting the Graphic Packaging paper mill, residential areas in south Monroe, the I20-165 interchange, residential areas north of Target, and into the airport. It also came *very* close to our radar.
http://wxdata.geos.ulm.edu/monroe-2.gif
(11/n)">https://wxdata.geos.ulm.edu/monroe-2....
http://wxdata.geos.ulm.edu/monroe-2.gif
(11/n)">https://wxdata.geos.ulm.edu/monroe-2....
The debris signature loses some definition towards the end of the loop, both as the tornado is likely dissipating, but also due to ground clutter contamination close to the radar site. (12/n)
Finally (for now), the Sterlington tornado north of Monroe exhibited a great example of debris dispersion and fallout. Watch as the circular CC minimum expands and disperses as the tornado dissipates.
http://wxdata.geos.ulm.edu/sterlington.gif
(13/13)">https://wxdata.geos.ulm.edu/sterlingt...
http://wxdata.geos.ulm.edu/sterlington.gif
(13/13)">https://wxdata.geos.ulm.edu/sterlingt...

 Read on Twitter