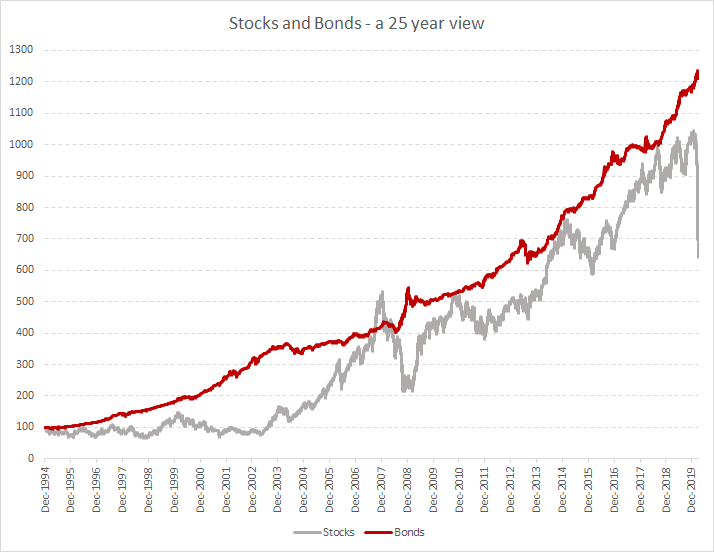
An update to a chart I use in various presentations. The long term (25+ years) performance of equity and bonds. Equity is Nifty and bonds is I-Sec Sov Bond Index (g-secs only).
The large March 2020 drop has created a wide performance gap, but do note that bonds were leading before the recent equity fall. Trailing period performance:
Important notes: past performance is not necessarily indicative of future results. I am working from home with limited access to the databases I would normally use. If there are errors please forgive. Please don& #39;t use this data to make investment decisions.

 Read on Twitter


