ICYMI
Refresher: cross-asset "Correlation Matrix" for year 2019 - one year correlation
update & review this matrix every week for different time frames would help one to spot some great opportunities on cross-asset correlations; uncovering some good emerging leading indicators https://twitter.com/kerberos007/status/1212532772344147974">https://twitter.com/kerberos0...
Some new notable correlations emerging: from 500x500 matrix.
Updated on 10-year correlation matrix - from 2010 to 2020 as of Friday.
SPX
HYG
GOLD:HYG ratio
JPY:HYG ratio
JPY index
VIX
etc.
Updated on 10-year correlation matrix - from 2010 to 2020 as of Friday.
SPX
HYG
GOLD:HYG ratio
JPY:HYG ratio
JPY index
VIX
etc.
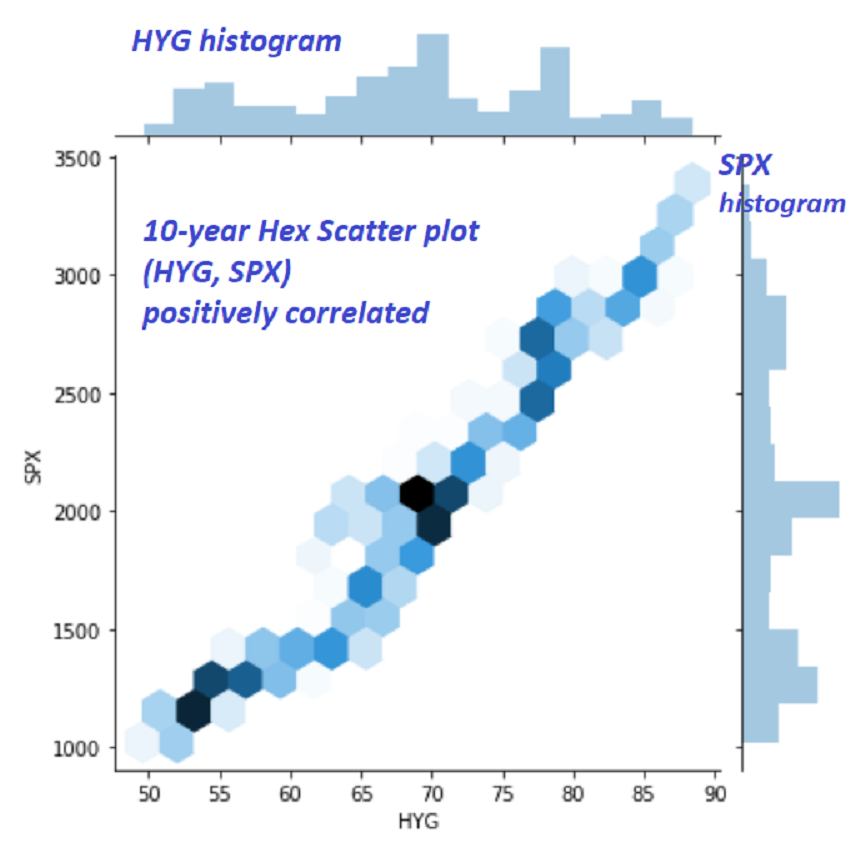
Amazing positive correlation between
$HYG and $SPX in the last 10 years.
10-year Hex ScatterPlot (HYG, SPX)
$HYG and $SPX in the last 10 years.
10-year Hex ScatterPlot (HYG, SPX)
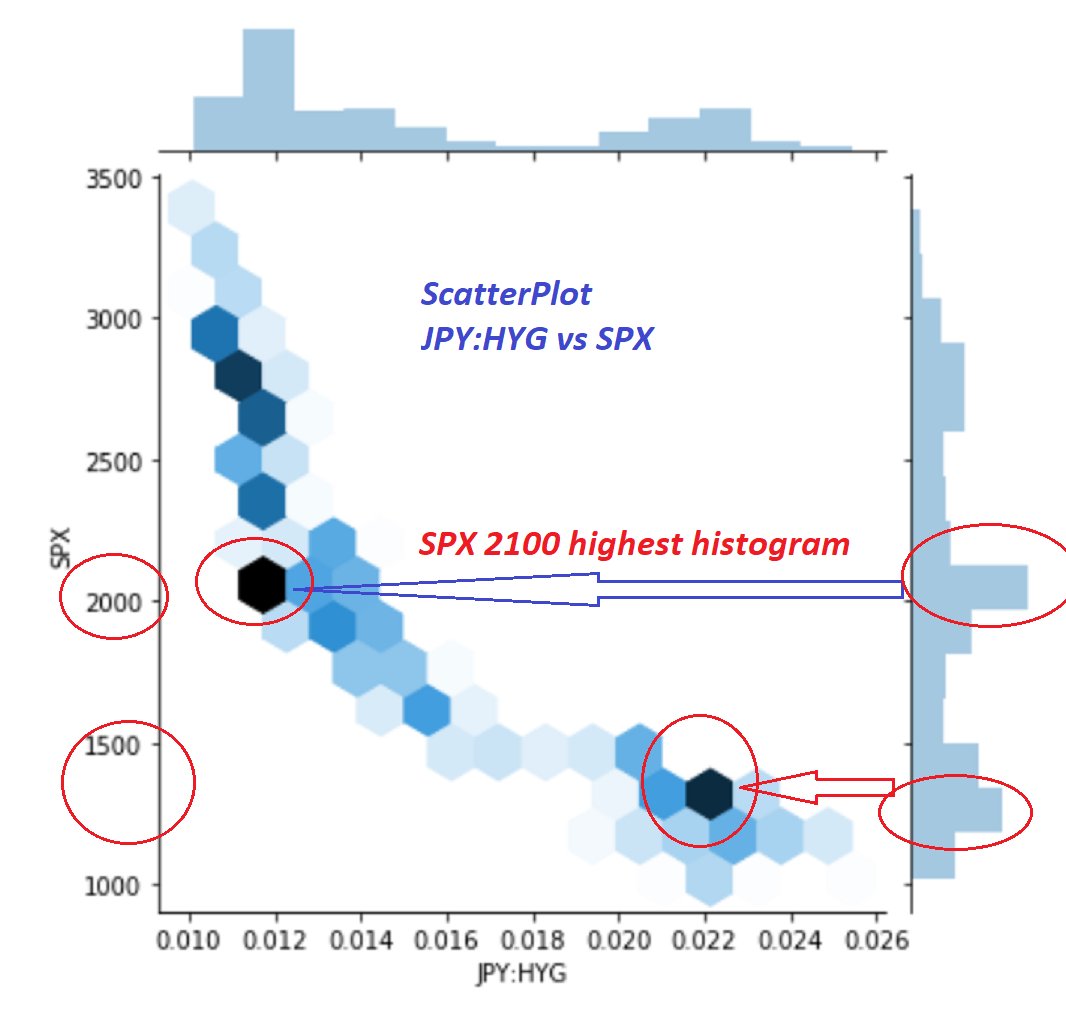
Amazing negative correlation between
JPY:HYG ratio and $SPX in the last 10 years.
10-year Hex ScatterPlot (JPY:HYG, SPX)
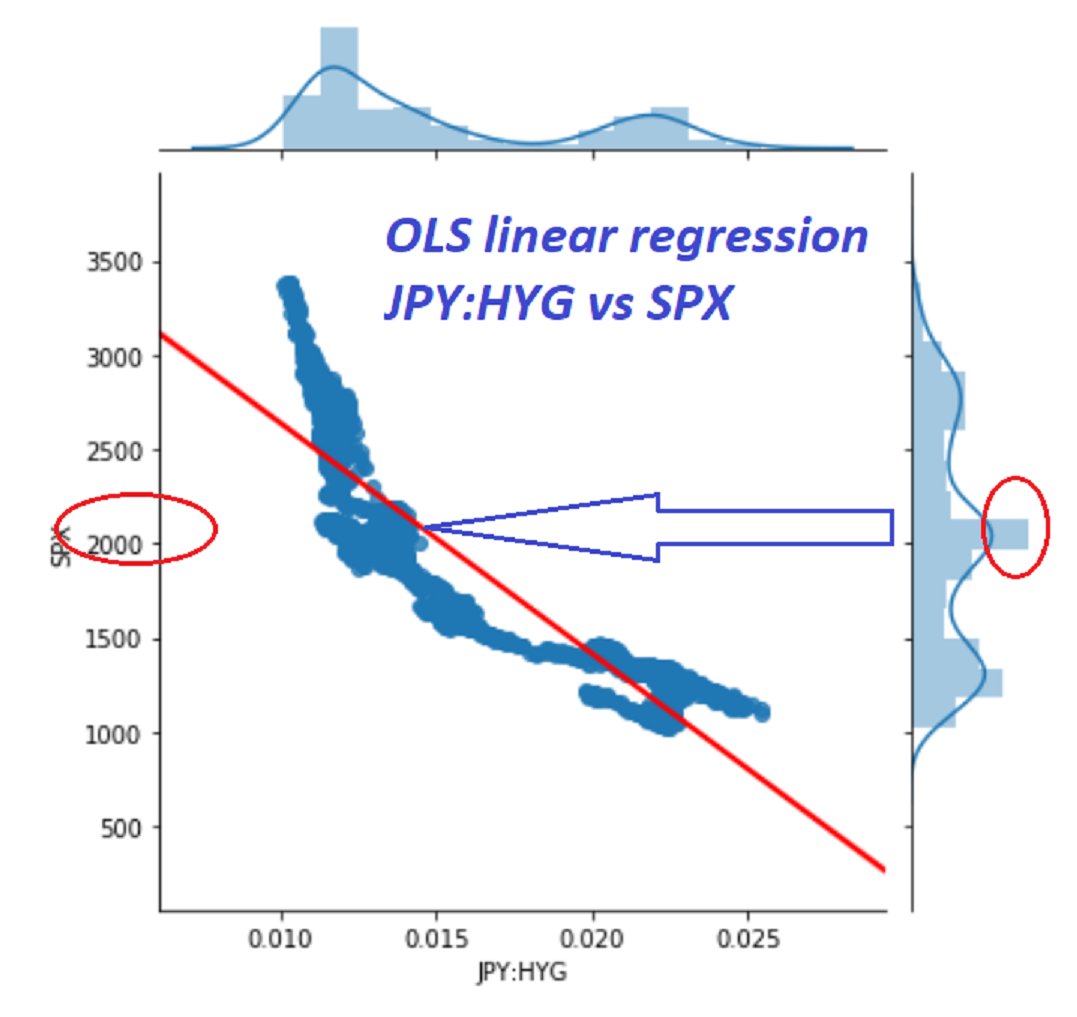
Notice the histogram: $SPX = 2100
JPY:HYG ratio and $SPX in the last 10 years.
10-year Hex ScatterPlot (JPY:HYG, SPX)
Notice the histogram: $SPX = 2100
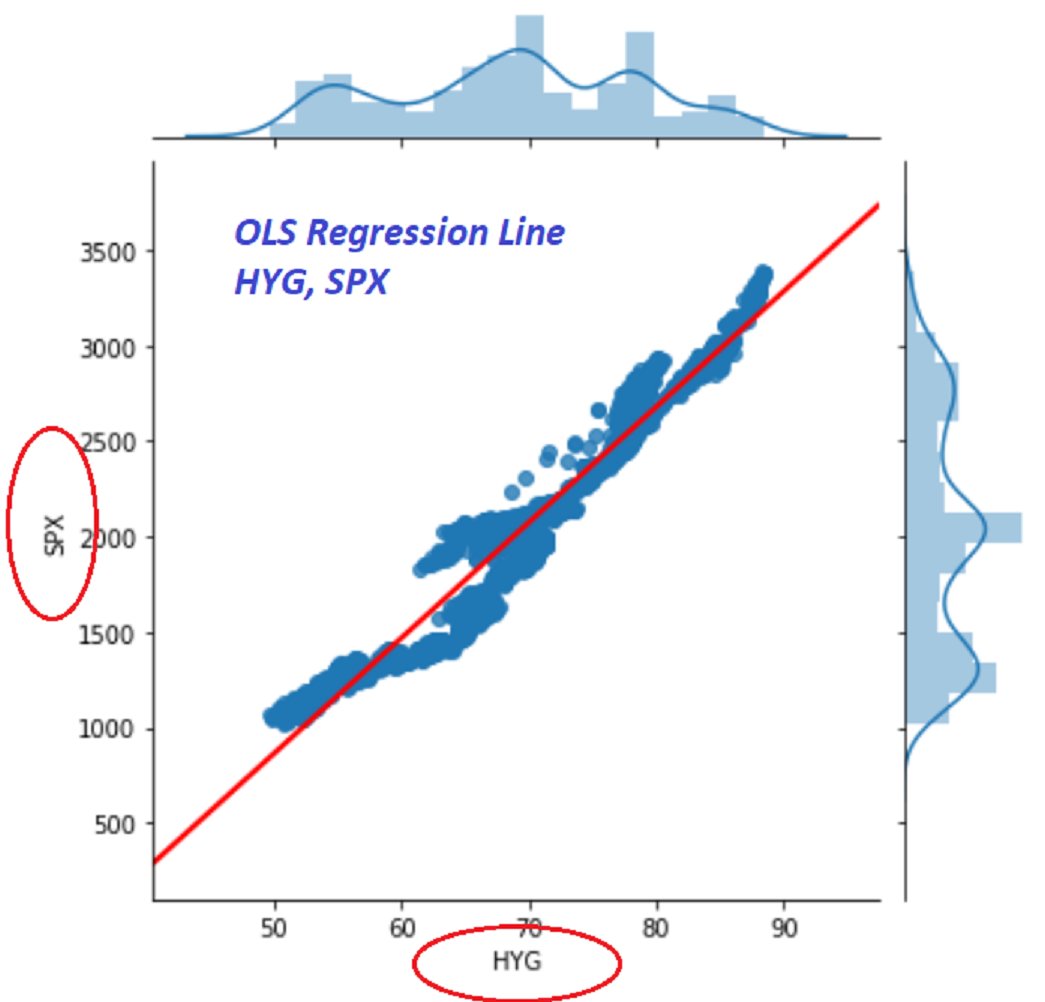
JPY:HYG and $SPX scatterplot
Perfect OLS regression line (red line) - 10 year period
negatively correlated over the last 10 year period
SPX 2100?
Perfect OLS regression line (red line) - 10 year period
negatively correlated over the last 10 year period
SPX 2100?
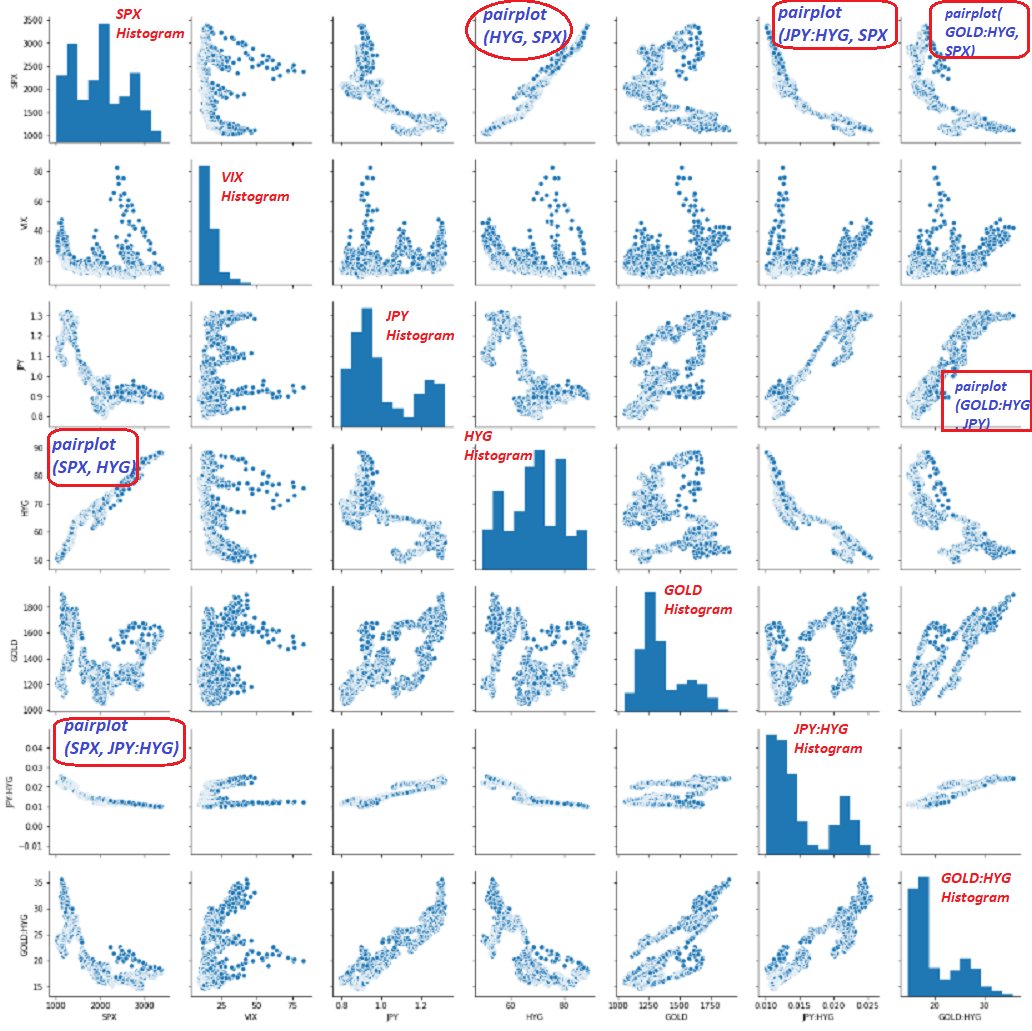
A quick glance of all correlations & scatterplots among cross assets
It is a quick& #39;n dirty way to spot some good correlations
If one monitor these charts everyday, he would become an expert on cross-asset correlations in no time, discovering some good leading indicators https://abs.twimg.com/emoji/v2/... draggable="false" alt="🧐" title="Face with monocle" aria-label="Emoji: Face with monocle">
It is a quick& #39;n dirty way to spot some good correlations
If one monitor these charts everyday, he would become an expert on cross-asset correlations in no time, discovering some good leading indicators
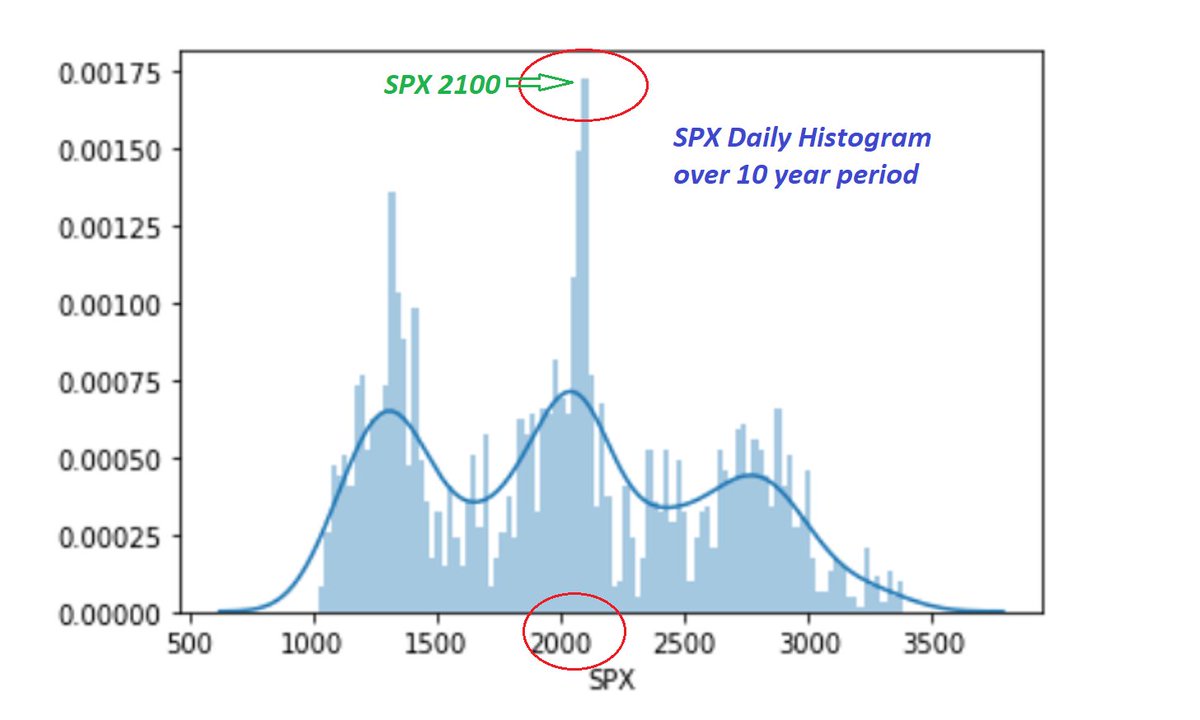
$SPX daily histogram plot - zoomed view
Since April 2010, 10 year period
That huge spike @ 2100 = Magnet
most traded zone and a Magnet in he last 10 years.
Since April 2010, 10 year period
That huge spike @ 2100 = Magnet
most traded zone and a Magnet in he last 10 years.

 Read on Twitter
 " title="A quick glance of all correlations & scatterplots among cross assetsIt is a quick& #39;n dirty way to spot some good correlationsIf one monitor these charts everyday, he would become an expert on cross-asset correlations in no time, discovering some good leading indicatorshttps://abs.twimg.com/emoji/v2/... draggable="false" alt="🧐" title="Face with monocle" aria-label="Emoji: Face with monocle">" class="img-responsive" style="max-width:100%;"/>
